HAL Id: hal-00302550
https://hal.archives-ouvertes.fr/hal-00302550
Submitted on 29 Jan 2007HAL is a multi-disciplinary open access
archive for the deposit and dissemination of sci-entific research documents, whether they are pub-lished or not. The documents may come from teaching and research institutions in France or abroad, or from public or private research centers.
L’archive ouverte pluridisciplinaire HAL, est destinée au dépôt et à la diffusion de documents scientifiques de niveau recherche, publiés ou non, émanant des établissements d’enseignement et de recherche français ou étrangers, des laboratoires publics ou privés.
Comparison of measurements of peroxyacyl nitrates and
primary carbonaceous aerosol concentrations in Mexico
City determined in 1997 and 2003
N. A. Marley, J. S. Gaffney, R. Ramos-Villegas, B. Cárdenas González
To cite this version:
N. A. Marley, J. S. Gaffney, R. Ramos-Villegas, B. Cárdenas González. Comparison of measurements of peroxyacyl nitrates and primary carbonaceous aerosol concentrations in Mexico City determined in 1997 and 2003. Atmospheric Chemistry and Physics Discussions, European Geosciences Union, 2007, 7 (1), pp.1421-1448. �hal-00302550�
ACPD
7, 1421–1448, 2007 PAN and Carbonaceous Aerosol in Mexico City J. S. Gaffney et al. Title Page Abstract Introduction Conclusions References Tables Figures ◭ ◮ ◭ ◮ Back CloseFull Screen / Esc
Printer-friendly Version Interactive Discussion
Atmos. Chem. Phys. Discuss., 7, 1421–1448, 2007 www.atmos-chem-phys-discuss.net/7/1421/2007/ © Author(s) 2007. This work is licensed
under a Creative Commons License.
Atmospheric Chemistry and Physics Discussions
Comparison of measurements of
peroxyacyl nitrates and primary
carbonaceous aerosol concentrations in
Mexico City determined in 1997 and 2003
N. A. Marley1, J. S. Gaffney1, R. Ramos-Villegas2, and B. C ´ardenas Gonz ´alez3 1
University of Arkansas at Little Rock, Little Rock, Arkansas, U.S.A. 2
Secretariat of the Environment, Government of the Federal District, Mexico City, D.F., Mexico 3
El Centro National de Investigation y Capitaci ´on Ambiental, Instituto National de Ecologia, Secretaria de Medio Ambiente y Recursos Naturales, Mexico City, D.F., Mexico
Received: 18 December 2006 – Accepted: 1 January 2007 – Published: 29 January 2007 Correspondence to: J. S. Gaffney (jsgaffney@ualr.edu)
ACPD
7, 1421–1448, 2007 PAN and Carbonaceous Aerosol in Mexico City J. S. Gaffney et al. Title Page Abstract Introduction Conclusions References Tables Figures ◭ ◮ ◭ ◮ Back CloseFull Screen / Esc
Printer-friendly Version Interactive Discussion
Abstract
Peroxyacetyl nitrate (PAN) concentrations in ambient air can be a good indicator of air quality and the effectiveness of control strategies for reducing ozone levels in urban areas. As PAN is formed by the oxidation of reactive hydrocarbons in the presence of nitrogen dioxide (NO2), it is a direct measure of the peroxyacyl radical levels
pro-5
duced from reactive organic emissions in the urban air shed. Carbon soot, known as black carbon or elemental carbon, is a primary atmospheric aerosol species and is a good indicator of the levels of combustion emissions, particularly from diesel en-gines, in major cities. Mexico City is the second largest megacity in the world and has long suffered from poor air quality. Reported here are atmospheric measurements of
10
PAN and black carbon obtained in Mexico City during the Mexico Megacity 2003 field study. These results are compared with measurements obtained earlier during the In-vestigaci ´on sobre Materia Particulada y Deterioro Atmosf ´erico – Aerosol and Visibility Research (IMADA-AVER) campaign in 1997 to obtain an estimate of the changes in emissions in Mexico City and the effectiveness of control strategies adopted during that
15
time. Concentrations of PAN in 1997 reached a maximum of 34 ppb with an average daily maximum of 15 ppb. The PAN levels recorded in 2003 were quite different, with an average daily maximum of 3 ppb. This dramatic reduction in PAN levels observed in 2003 indicate that reactive hydrocarbon emissions have been reduced in the city due to controls on olefins in liquefied petroleum gas (LPG) and also due to the
signifi-20
cant number of newer vehicles with catalytic converters that have replaced older higher emission vehicles. In contrast, black/elemental carbon levels were similar in 1997 and 2003 indicating little improvement likely due to the lack of controls on diesel vehicles in the city. Thus, while air quality and ozone production has improved, Mexico City and other megacities continue to be a major source of black carbon aerosols, which can be
25
an important species in determining regional radiative balance and climate.
ACPD
7, 1421–1448, 2007 PAN and Carbonaceous Aerosol in Mexico City J. S. Gaffney et al. Title Page Abstract Introduction Conclusions References Tables Figures ◭ ◮ ◭ ◮ Back CloseFull Screen / Esc
Printer-friendly Version Interactive Discussion
1 Introduction
Megacities are large urban and suburban complexes whose populations are in the tens of millions of inhabitants (Zarski, 1994). With the rapid growth of the world’s population and the continuing industrialization and migration of the populace towards major urban centers, the numbers of these megacities are increasing. Although New York City
5
was the only megacity in the world in 1950, they now number 14 and their distribution is growing most rapidly in the tropical areas of South America and Asia. Today, the largest metropolitan complexes are centered at Tokyo, Japan, and Mexico City, Mexico (Molina and Molina, 2002a). Within the next 1015 years it is predicted that there will be more than 30 megacities worldwide.
10
Megacities have become important global sources of air pollutants from the associ-ated mobile and stationary sources and the emissions from megacities are leading to regional and global increases in many key trace gases as well as primary and secondary aerosols. The Mexico City metropolitan area (MCMA), which occupies ∼1300 km2 with a population of ∼18 M, is one of the largest megacities in the world
15
and is well known for its high levels of air pollution and visibility reduction (Molina and Molina, 2002b). It has been estimated that emissions from the Mexico City basin contribute 15 Mega-tons of fine aerosol (PM2.5) per year to the surrounding regions
(Gaffney et al., 1999). This fine aerosol is composed of approximately 32% organic carbon, 15% elemental carbon, 10% ammonium nitrate and 20% ammonium sulfate
20
(Chow et al., 2002). The emissions of sulfate aerosols alone from the MCMA are esti-mated to amount to 1% of the total global burden (Barth and Church, 1999). While sul-fate is an important light scattering aerosol species, black carbon is an important light absorbing aerosol species. The aerosol emissions from megacities such as Mexico City therefore play potentially important roles in regional radiative balance and climate
25
(Jacobson 2002; Gaffney and Marley, 2005)
Elevated levels of ozone have been known for some time in Mexico City (Bravo et al., 1989; MARI, 1994; Streit and Guzman, 1996; Fast and Zhong, 1998). Mexico City
ACPD
7, 1421–1448, 2007 PAN and Carbonaceous Aerosol in Mexico City J. S. Gaffney et al. Title Page Abstract Introduction Conclusions References Tables Figures ◭ ◮ ◭ ◮ Back CloseFull Screen / Esc
Printer-friendly Version Interactive Discussion
is located at an altitude of 7200 ft in an air basin surrounded by mountains (Fast and Zhong, 1998; Doran et al., 1998) and at a latitude of 19◦of North latitude, which implies
high levels of incoming solar radiation all year long. In the past, peak ozone levels exceeding 300 ppb were not uncommon, particularly during the late dry winter months of February and March. These very high levels of ozone require high levels of reactive
5
hydrocarbons as well as elevated levels of nitrogen oxide (NO) emissions to produce the coupled OH and peroxyradical chemistry that is key to the formation of urban ozone (Finlayson-Pitts and Pitts, 2000.). Hydrocarbon measurements taken in Mexico City (Blake and Rowland, 1995) showed that the heavy domestic and commercial use of LPG has led to very high levels of butane and propane in that megacity’s air, exceeding
10
parts-per-million (ppm) of carbon in many cases. Indeed, LPG was proposed as an important source of the reactive volatile organic carbon compounds (VOCs) propene and butenes, which could account for an appreciable portion of the observed urban ozone in Mexico City (Blake and Rowland, 1995). Volatile organic carbon samples collected before and during a Mexican National Holiday with reduced automobile traffic
15
clearly showed that mobile emissions are equally important as LPG as sources of reactive olefins such as the butenes (Gaffney et al., 1999). In addition, earlier work suggested that mobile sources contribute 75% of the total hydrocarbons to the Mexico City air (Riveros et al., 1998) and that NO2was probably the most important contributor
to ozone production in Mexico City (Raga et al., 2001a).
20
Peroxyacyl nitrates (PANs) are important indicator compounds of peroxyradical activ-ity in an urban air shed (Finlayson-Pitts and Pitts, 2000; Gaffney et al., 1989). Formed by the reaction of peroxyacyl radicals with NO2, they exist in equilibrium with the peroxy radical species according to:
RC = O − O2+ NO2 ⇄RC = O − O − O − NO2 (1)
25
where R is typically (in order of importance); CH3-(peroxyacetyl nitrate, PAN),
CH3CH2-(peroxypropionyl nitrate, PPN), and CH3CH2CH2-(peroxybutryl nitrate, PBN) in an urban environment. The peroxyacyl radicals are formed from the reactive olefins
ACPD
7, 1421–1448, 2007 PAN and Carbonaceous Aerosol in Mexico City J. S. Gaffney et al. Title Page Abstract Introduction Conclusions References Tables Figures ◭ ◮ ◭ ◮ Back CloseFull Screen / Esc
Printer-friendly Version Interactive Discussion
directly or via formation of aldehydes that can react with OH to form the peroxyacyl species.
Thus, measurements of the temporal variability of the PANs are useful in determining the oxidative reactions involved in the formation of ozone as well as other secondary air pollutants and aerosol species such as nitric acid and ammonium nitrate as they
5
are a direct measure of the peroxyacyl radical formation activity. Therefore the PANs serve as a measure of the peroxy radical concentrations in the atmosphere. Since the PANs have low aqueous solubilities, low reactivity with OH, and are slow to photolyze, they can lead to the transport of NO2 over long distances and can simultaneously
act as a reservoir for NO2during transport of the urban plume. This can have regional
10
scale impacts on ozone, nitrate aerosols, and other pollutants associated with megacity plumes (Gaffney et al., 1989).
Carbonaceous particulate matter or “soot” particles are produced from the partial combustion of hydrocarbons, particularly from diesel fuels, and are therefore a mea-sure of the combustion emissions in an urban area. Although the elemental
composi-15
tion of these particles is dominated by carbon (>90%), soot particles may be regarded as a complex organic polymer, rather than an amorphous form of elemental carbon (An-dreae and Gelencer, 2006). The absolute identification of carbon soot is difficult and the techniques commonly used, such as Raman spectroscopy, electron microscopy, and mass spectrometry are impractical for routine monitoring of this material. Various
20
measurement methods have been developed for the routine quantitation of aerosol soot content that make use of some of its characteristic properties. These methods have created operational definitions such as “black carbon” or “elemental carbon” de-pending on the key property being measured (Gaffney and Marley, 2006). The term “black carbon” arises from the use of optical attenuation methods and refers to the
25
highly absorbing nature of carbon soot aerosols. In contrast, the term “elemental car-bon” is used when thermal combustion methods are employed for detection and refers to the refractory nature of the aerosols at temperatures up to 350–400◦C. Comparisons
ACPD
7, 1421–1448, 2007 PAN and Carbonaceous Aerosol in Mexico City J. S. Gaffney et al. Title Page Abstract Introduction Conclusions References Tables Figures ◭ ◮ ◭ ◮ Back CloseFull Screen / Esc
Printer-friendly Version Interactive Discussion
yielded correlation coefficients of 0.99 (Hansen and McMurry, 1990), 0.97 (Allen et al., 1999), and 0.94 (Babich et al., 2000) and the various terms used to identify combustion derived aerosols are commonly used interchangeably.
Although originally identified as a pollutant and a tracer for combustion emissions, carbon soot has more recently gained attention as a major light absorbing species with
5
significant impacts on the radiative balance of the atmosphere (Ramanathan et al., 2005). Some model calculations suggest that the contribution of carbon soot aerosols to global warming may be as much as 0.3–0.4◦C, rivaling the contributions from
atmo-spheric methane (Jacobson, 2004; Chung and Seinfeld, 2005). The ultimate climate effects from carbon aerosols will depend on their physical and chemical properties, as
10
well as their residence times and distributions in the atmosphere (Jacobson, 2001). In order to adequately assess the aerosol impacts on global and regional climate, a better understanding of black carbon emission rates and atmospheric distributions will be essential.
In an attempt to better understand the Mexico City air chemistry with regard to
15
oxidants and aerosols, a comprehensive collaborative study was carried out during February–March 1997 that included a wide variety of chemistry, aerosol and meteo-rological measurements (Edgerton et al.,1999; Doran et al., 1998; Fast and Zhong, 1998). This field campaign (IMADA-AVER) was jointly sponsored by the U.S. De-partment of Energy’s Office of Biological and Environmental Research Atmospheric
20
Science Program (DOE/ASP) and Petrleos Mexicanos (PEMEX) through the Mexican Petroleum Institute (Instituto Mexicano de Petroleo, or IMP).
As part of IMADA-AVER, measurements of near-surface tropospheric PANs were made at the IMP laboratories to determine the concentrations and temporal variabil-ity of these species in the megacvariabil-ity (Gaffney et al., 1999). Levels of the PANs were
25
found to approach 40 ppb in the central metropolitan area. Peroxyacetyl nitrate, was the major species, although PPN and PBN were also observed in the low ppb ranges. These are the highest values of the PANs seen in any urban area since 50 ppb val-ues were reported for PAN in the late 1970s downwind of Los Angeles in the south
ACPD
7, 1421–1448, 2007 PAN and Carbonaceous Aerosol in Mexico City J. S. Gaffney et al. Title Page Abstract Introduction Conclusions References Tables Figures ◭ ◮ ◭ ◮ Back CloseFull Screen / Esc
Printer-friendly Version Interactive Discussion
coast air basin in southern California (Tuazon et al., 1981). Volatile organic carbon measurements obtained at IMP during the same time indicated that automobiles were responsible for much of the reactive hydrocarbons in the atmosphere (Gaffney et al., 1999). The meteorological measurements demonstrated that the air basin was subject to a strong advection of the boundary layer in the afternoon leading to a clearing out
5
of the pollutants emitted and formed during the day. This regional meteorology leads to very little carryover of the pollutants in Mexico City from day to day and atmospheric chemistry that is dominated by reactions that took place typically over a one day period (Gaffney et al., 1999; Fast and Zhong, 1998; Doran et al., 1998). The application of a simple box model indicated that considerable amounts of air pollutants, both oxidants
10
and aerosols, were being transported out of the Mexico City air basin (Gaffney et al., 1999; Elliott et al., 1997).
In April 2003, the DOE/ASP again conducted a field study in Mexico City (Mexico Megacity 2003) in collaboration with the MCMA 2003 air quality study organized by M. J. Molina and L. T. Molina of the Massachusetts Institute of Technology. Continuous
15
measurements of the PANs and black carbon aerosols were obtained during April 2003 at the National Center for Environmental Research and Training (Centro Nacional de Investigaci ´on y Capacitaci ´on Ambiental, or CENICA), on the Iztapalapa campus of the Universidad Aut ´onoma Metropolitana (UAM). Data were collected before and during the Easter holiday to assess changes in PAN and BC loadings as a function of vehicle
20
traffic levels.
Results are presented here for PAN and black carbon concentrations obtained in Mexico City during the Mexico Megacity 2003 field study. These results are compared with those obtained 6 years earlier during the IMADA-AVER study. Changes in PAN and carbonaceous aerosol levels are presented as an indication of changes in emission
25
levels during that time and the effectiveness of ozone control strategies that have been adopted in Mexico City since 1997. The black carbon aerosol comparisons are of particular importance in the evaluation of the regional impacts of the changing megacity emissions of this key absorbing aerosol species and its importance for regional climate
ACPD
7, 1421–1448, 2007 PAN and Carbonaceous Aerosol in Mexico City J. S. Gaffney et al. Title Page Abstract Introduction Conclusions References Tables Figures ◭ ◮ ◭ ◮ Back CloseFull Screen / Esc
Printer-friendly Version Interactive Discussion
considerations.
2 Experimental Methods
Measurements were obtained from 20 February to 23 March 1977 at Building No. 24 (Refinaci ´on y Petroquimica) of the IMP laboratories (Eje Central Lazaro Cardenas No. 152, Delegacion Gustavo A. Madero, M ´exico, Districto Federale). This site is located
5
in the north central part of Mexico City (19◦29′19.392′′N, 99◦08′50.258′′W). The PANs
were determined using an automated gas chromatograph equipped with an electron capture detection system (GC/ECD). This system has been described in detail else-where (Gaffney et al., 1993, 1997, 1998, 1999). A 2-cm3 sample was injected auto-matically onto a packed GC column (carbowax 400) every 30 min. Data were collected
10
using a recording integrator and processed manually for each of 1380 samples. Cali-bration of the instrument for the PANs was accomplished by manual injection of stan-dards synthesized by strong acid nitration of the corresponding peracids (Gaffney et. al., 1984; Gaffney and Marley, 2005a).
Data for ozone and NO2 concentrations for 1997 were obtained from the Mexico
15
City ambient air monitoring network (la Red Autom ´atica de Monitoreo Atmosf ´erico, or RAMA), operated at that time by the Direcci ´on General de Prevencin y Control de la Contaminacin de la Ciudad de M ´exico. Nineteen of the 33 urban RAMA stations measure ozone, (by UV absorption), nitrogen oxide (NO) and total nitrogen oxides (NOx) (by chemiluminescence) among other criteria pollutants, on an hourly basis.
20
The NO2concentrations were estimated by subtraction of NO and PAN concentrations
from NOx results (NO2≃ NOx–NO–PAN). Measurements made at La Merced RAMA
station (Avenida Congresso de la Union No. 148, Colonia Merced Balbuena, Dela-gaci ´on Venustiano Carranza, M ´exico, D.F.), were used as a comparison to the PAN measurements taken at IMP in 1997. This site is located in the center of Mexico City
25
(19◦25′27.792′′N, 99◦07′09.397′′W) approximately 7.7 km (4.8 mi) south-southwest of
IMP.
ACPD
7, 1421–1448, 2007 PAN and Carbonaceous Aerosol in Mexico City J. S. Gaffney et al. Title Page Abstract Introduction Conclusions References Tables Figures ◭ ◮ ◭ ◮ Back CloseFull Screen / Esc
Printer-friendly Version Interactive Discussion
Measurements of the PANs, NO2 and fine aerosol black carbon content were ob-tained from 3 April to 1 May 2003 on the rooftop of the CENICA laboratory building (19◦21′44.541′′N, 99◦04′16.425′′W) on the UAM Iztapalapa campus (Calle “Sur 10”
No. 230, Colonia La Vicentina, Delegaci ´on Iztapalapa, M ´exico, D.F.). This site is ap-proximately 16.1 km (10.0 mi) south-southwest of the site at the IMP site that was used
5
in 1997. Measurements of the PANs and NO2 were obtained by fast gas
chromatog-raphy with luminal detection. This system has been described in detail elsewhere (Marley, et al., 2004) but will be briefly reviewed here. A 2-cm3sample loop was used to automatically inject samples onto a 30-ft. capillary GC column (DB-1) at 1-min in-tervals. Both NO2and the PANs were detected by the chemiluminescent reaction with
10
luminol and the intensity of the emission at 425 nm was measured with a photon count-ing module. The instrument was controlled by a 1.8-GHz Notebook computer with a Windows 2000 operating system and a custom software application programmed in LabVIEW. The instrument was calibrated for NO2 by dilution of a 2.8-ppm NO2 tank standard in air with a gas calibrator (Dasibi; Model 1009-CP) and for the PANs with the
15
synthetic standards described above.
The black carbon content of fine aerosols was measured by using a seven-channel aethalometer (Andersen) with a sample inlet designed to collect aerosols in the 0.1 to 2 micron size range. The aerosols in the air sample are collected within the instrument by continuous filtration through a paper tape strip. The optical transmission of the
20
deposited aerosol particles is then measured sequentially at seven wavelengths (370, 450, 520, 590, 660, 880, and 950 nm). Since black carbon is a strongly absorbing aerosol species with an absorption coefficient relatively constant over a broad spectral region (Marley et al., 2001) the instrument can automatically calculate the black carbon content from the transmission measurements by assuming black carbon to be the main
25
absorbing aerosol species in the samples with a 1/λ dependence typical of broadband absorbers and a mass specific absorption coefficient of 16.6 m2/g at 880 nm (Hansen et al., 1982). The instrument is operated by an embedded computer with a display screen and keypad that controls all instrument functions and automatically records the data to
ACPD
7, 1421–1448, 2007 PAN and Carbonaceous Aerosol in Mexico City J. S. Gaffney et al. Title Page Abstract Introduction Conclusions References Tables Figures ◭ ◮ ◭ ◮ Back CloseFull Screen / Esc
Printer-friendly Version Interactive Discussion
a built-in 3.5” floppy diskette. Data were recorded for each of the seven channels at a two-minute time resolution. In addition, the analog output of the 520 nm channel was monitored continuously and one minute averages of this channel were recorded separately.
Measurements of total PM2.5 concentrations were also obtained at the CENICA site
5
by a Tapered Element Oscillating Microbalance (TEOM, Ruppert & Pastashnick) oper-ated at 35◦C. This instrument measures the total fine aerosol mass concentration by
using a vibrating element whose frequency is dependent on the particle mass collected on a filter located at the end of the element (Hinds, 1999). Hourly averages of ozone for this time period were obtained from the RAMA station at Cerro de la Estrella (Calzada
10
San Lorenzo, Colonia Paraje San Juan, Delegaci ´on Iztapalapa, M ´exico D.F.). This site (19◦ 20′09.184′′N, 99◦ 04′ 28.829′′W) is located 3.0 km (1.8 mi) from the main
sampling site at CENICA.
3 Results and Discussion
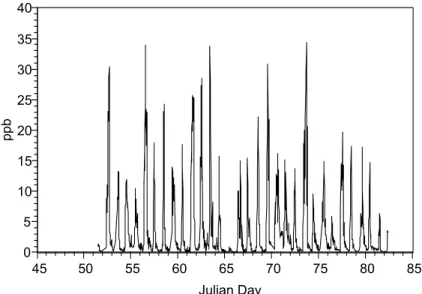
The 30-min concentrations of PAN measured in 1997 are shown in Fig. 1. The strong
15
diurnal concentration pattern observed is evidence of the regional afternoon clearing of the pollutants from the MCMA basin. The PAN concentrations reached a maximum of 34 ppb with an average daily maximum of 15 ppb. The higher PAN analogs were also observed in 1997. Levels of PPN and PBN reached 5 and 1.1 ppb respectively, giving a total maximum concentration for all the PANs of 40 ppb, the highest reported since
20
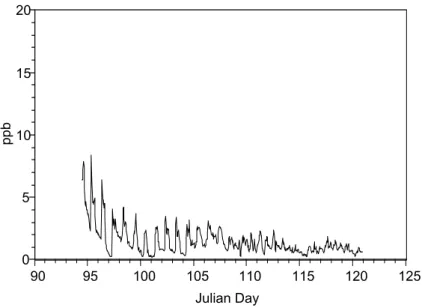
measurements taken near Los Angeles in the 1970s (Tuazon et al., 1981). Figure 2 shows the time sequence observed for PAN in Mexico City in 2003. The PAN levels recorded in 2003 were quite different, reaching a maximum of only 8 ppb early in the study with an average daily maximum for the time period of 3 ppb. In addition, neither PPN nor PBN were observed above the detection limit of 0.02 ppb at any time during
25
the study period. The typical diurnal concentration pattern is evident in the first 14 days of the study, indicating the same daily meteorological patterns observed in 1997
ACPD
7, 1421–1448, 2007 PAN and Carbonaceous Aerosol in Mexico City J. S. Gaffney et al. Title Page Abstract Introduction Conclusions References Tables Figures ◭ ◮ ◭ ◮ Back CloseFull Screen / Esc
Printer-friendly Version Interactive Discussion
leading to a daily clearing of the basin. 18 April 2003 (Julian day 108) was Good Friday marking the beginning of the holiday period accompanied with a decrease in traffic levels and a decrease in mobile and stationary emissions. This resulted in even lower PAN levels after that day. The average daily maximum before 18 April was 4 ppb while the average daily maximum afterwards was 1.7 ppb. The IMADA-AVER study in 1997
5
also incorporated a Mexican national holiday (Benito Juarez’s Birthday) on 21 March (Julian Day 80). The maximum PAN concentration observed on that day was 12 ppb.
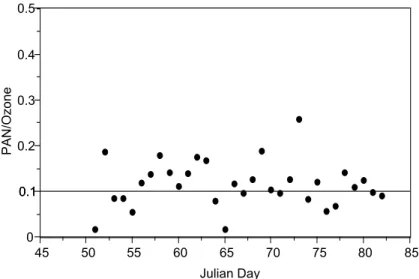
Maximum ozone levels reached 242 ppb during the 1997 study period but only reached 135 ppb in 2003. The ratio of PAN to ozone daily maximum concentrations is shown in Fig. 3 for 1997 and Fig. 4 for 2003. Past measurements of PAN to ozone
10
concentrations in polluted air masses have yielded a ratio of 0.1 (Tuazon et al., 1981; Finlayson-Pitts and Pitts, 2000; Gaffney et al., 1989). The observed ratio of PAN/ozone in 1997 generally agrees with the value of 0.1. However, many days exceeded 0.1 and 6 out of the 32 study days exceeded a ratio of 0.2. This has been attributed to the significant presence of PAN precursors, including higher aldehydes and olefins, in the
15
Mexico City air during that time and also to the fact than the higher PAN levels act to tie up NO2 thus reducing the ozone production rate and the subsequent ozone levels (Gaffney et al, 1999). The PAN/ozone values observed in 2003 only reached the value of 0.1 the first two days of the study. The PAN/ozone ratios after 5 April (Julian Day 95) were significantly below 0.1 with an average daily value of 0.02 for the rest of the study
20
period and an average of 0.03 for the period before the Easter holiday.
As expected, NO2 levels were also lower in 2003 than in 1997. The maximum NO2
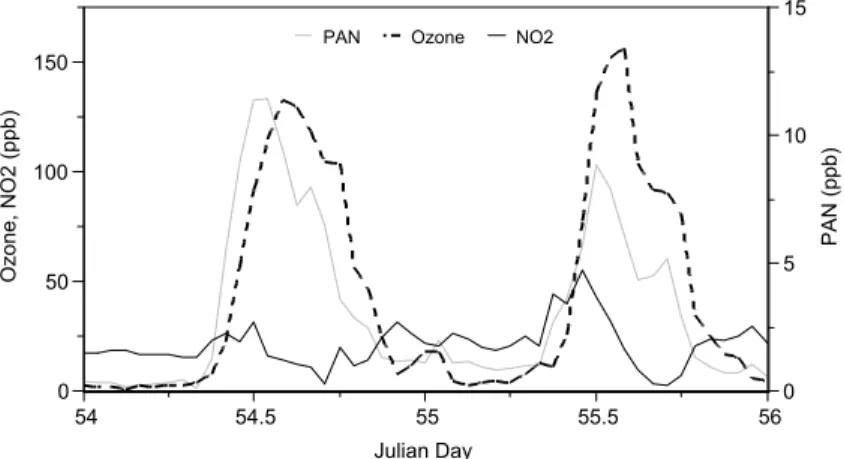
concentrations reached 205 ppb in 1997 and 137 ppb in 2003. Figure 5 shows the concentration profiles of ozone, NO2, and PAN for two representative days in 1997.
Figure 6 shows similar concentration profiles for 2003. Although the overall
concentra-25
tion levels are lower in 2003 than in 1997, the concentration profiles appear to follow similar patterns. There is a rapid conversion of NO to NO2in the Mexico City air in both
1997 and 2003 as indicated by the fact that NO2reaches a maximum before noon. At
ACPD
7, 1421–1448, 2007 PAN and Carbonaceous Aerosol in Mexico City J. S. Gaffney et al. Title Page Abstract Introduction Conclusions References Tables Figures ◭ ◮ ◭ ◮ Back CloseFull Screen / Esc
Printer-friendly Version Interactive Discussion
earlier than ozone. Shortly after midday the boundary layer height increases leading in a reduction of NO2 atmospheric concentrations. In late afternoon PAN levels begin to
drop faster than ozone. As this rapid decrease in PAN is not likely due to reaction with NO, because this would cause ozone to be lost faster than PAN, it was proposed that this behavior might be due to heterogeneous loss of PAN on carbonaceous aerosol
5
surfaces (Gaffney et al., 1999). It has been shown in laboratory studies that PAN can be lost on contact with soot surfaces at low ppb levels during relatively short contact times (Gaffney et al., 1998). Figure 6 also includes the black carbon aerosol profiles obtained in 2003. The NO2concentration levels correspond well with the black carbon
concentrations as both black carbon and NO, the NO2 precursor, are produced from
10
combustion. The PAN levels in Fig. 6 begin to drop as the black carbon concentrations reach their maximum supporting the suggestion of heterogeneous loss. This same loss pattern has also been observed in Santiago, Chile where PAN levels have been seen to exceed 20 ppb (Rappengluck et al., 1998; 2000). This city has a large diesel bus fleet and the black carbon levels are likely to be even higher than those observed
15
in Mexico City.
Daily average PM2.5 concentrations have been reported elsewhere for La Merced site during the AMADA-AVER campaign in 1997 (Edgerton et al., 1999; Chow et al., 2002). These fine aerosol levels ranged from 21–60 µg/m3 in 1997 with an average of 36 µg/m3. The daily average PM2.5 during the 2003 study ranged from 26–69µg/m3
20
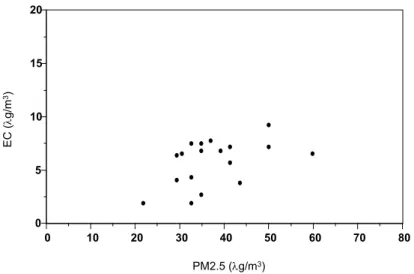
with an average of 45 µg/m3. This is not a significant difference in fine atmospheric aerosols from 1997 to 2003. The samples collected in 1997 were also analyzed for elemental carbon content by thermal evolution analysis (Chow et al., 1993, 2001). Fig-ure 7 shows the elemental carbon content of the PM2.5 aerosol fraction as calculated
from the previously reported results (Edgerton et al., 1999; Chow et al., 2002). The
25
percent elemental carbon in the fine aerosol samples collected in 1997 varied from 6– 23% with an average during the campaign of 15 (σ=5) %. Figure 8 shows the daily average black carbon content of fine aerosols as determined from light absorption and TEOM measurements made in 2003. The daily average percent black carbon in fine
ACPD
7, 1421–1448, 2007 PAN and Carbonaceous Aerosol in Mexico City J. S. Gaffney et al. Title Page Abstract Introduction Conclusions References Tables Figures ◭ ◮ ◭ ◮ Back CloseFull Screen / Esc
Printer-friendly Version Interactive Discussion
aerosols measured in 2003 ranged from 5–18% with an average of 10 (σ = 3)%. This may represent a slight decrease in black/elemental carbon aerosol content in 2003, especially at higher PM2.5concentrations. However, the thermal evolution method used
in 1997 to determine elemental carbon may sometimes result in high values if correc-tions are not adequately made for charring of the sample during analysis (Chow et al.,
5
2004).
The decreasing trend in PAN levels observed in Mexico City from 1997 to 2003 is similar to that observed in southern California where the maximum PAN concentra-tions have steadily decreased from 50–70 ppb in the 1960s to 3–10 ppb in the 1990s (Grosjean, 2003). The PPN concentrations in southern California have also decreased
10
from 5–6 ppb in the 1960s to less than 1 ppb in the 1990s. Peak ozone concentrations were about 540 ppb in 1960 and 210 in 1997 (Grosjean, 2003; South Coast Air Quality Management District, 1995; www.aqmd.gov.). This trend in decreasing atmospheric oxidants reflects the increasingly stringent controls on VOC and NOx emissions in the state of California. Although the trend for both PAN and ozone in southern California
15
is downward, the ambient levels of PAN have decreased faster than those of ozone yielding a decrease in the PAN/ozone ratio from 0.13 in the 1960s to 0.02 in 1997. Since California’s emission controls have focused on reducing the most reactive VOCs thus reducing the overall photochemical reactivity of the emissions (Carter, 1994) it has been suggested that this may have resulted in a larger reduction of the PAN precursors
20
compared to the VOCs that produce ozone but do not produce PAN (Grosjean, 2003). As the Mexico City and Los Angeles areas have many similarities in their air pollution problems including, a high density of mobile emissions resulting in similar atmospheric chemistries, the Mexican government utilized a similar approach to improving the air quality in the MCMA as that used by the state of California (Molina and Molina, 2002b).
25
This included the removal of reactive olefins from LPG (Blake and Rowland, 1995; DDF et al., 1996), re-strengthening motor vehicle emission standards with limits on the most reactive VOCs and the introduction of two-way catalytic converters in new vehicles starting with the model year 1991 and three-way catalytic converters stating
ACPD
7, 1421–1448, 2007 PAN and Carbonaceous Aerosol in Mexico City J. S. Gaffney et al. Title Page Abstract Introduction Conclusions References Tables Figures ◭ ◮ ◭ ◮ Back CloseFull Screen / Esc
Printer-friendly Version Interactive Discussion
with 1993 models (Molina and Molina, 2002b). Fuel-based motor vehicle emission inventories for Mexico City have subsequently estimated a decrease in NOx and hy-drocarbon emissions of 26% and 39%, respectively, from 1998 to 2000 (Schifter et al., 2003; 2005). It is therefore not surprising that results from the recent studies in Mexico City should yield results similar to those observed in the Los Angeles area with respect
5
to atmospheric oxidants, particularly the PANs. However, fine atmospheric aerosols, particularly black carbon aerosols remain a problem in this megacity. This is primarily due to the lack of controls on diesel particulate emissions.
The presence of the highly absorbing black carbon aerosols in Mexico City leads to a reduction in solar flux of 17.6% locally (Raga et al., 2001b). The mass of these
ab-10
sorbing aerosols exported from this megacity into the surrounding region is estimated to be 6 000 metric tons per day or 2 mega-tons per year of black carbon (Gaffney et al., 1999). Since freshly formed black carbon aerosols are hydrophobic, they are expected to be more resistant to washout and have longer lifetimes than more hygro-scopic aerosols such as sulfate and nitrate (Gaffney and Marley 2005b; Dua et al.,
15
1999). In addition, since Mexico City is located at an altitude of 2.2 km above sea level these aerosols are introduced into the atmosphere at altitudes that would be consid-ered to be in the free troposphere 300 km away and are therefore assumed to have longer lifetimes than aerosols released at lower altitudes (Raga et al., 2001b). The Mexico City Metropolitan Area is therefore a major source of black carbon aerosols to
20
the surrounding regions and the release of these highly absorbing aerosols into the sur-rounding areas will have an impact on the radiative balance and climate on a regional scale.
4 Conclusions and Recommendations
A comparison of results for PAN in Mexico City in 2003 with those obtained in 1997
25
indicate that the overall reactivity of the urban air chemistry has changed consistent with the control strategies that have been put into place in Mexico City, i.e., reduction
ACPD
7, 1421–1448, 2007 PAN and Carbonaceous Aerosol in Mexico City J. S. Gaffney et al. Title Page Abstract Introduction Conclusions References Tables Figures ◭ ◮ ◭ ◮ Back CloseFull Screen / Esc
Printer-friendly Version Interactive Discussion
of olefin content in LPG sources and the replacement of motor vehicles with those that employ the use of catalytic converters to reduce the reactive VOC emissions. Although the levels of PAN are still fairly high for an urban center, PAN and ozone levels are gradually dropping in Mexico City with similar trends to that observed over a number of decades in the Los Angeles air basin (Grosjean, 2003).
5
The Mexico City urban air is generally transported downwind of the city on a daily basis leading to the strong diurnal cycles observed for PAN at the urban sites. It is apparent that both NOx and reactive VOC emissions in Mexico City, although still high, are being reduced. Although the reduction of reactive VOCs in the urban emissions leads to the reduction of photochemical oxidants in the MCMA basin, the lower
reactiv-10
ity of the VOCs will certainly lead to the production of PANs downwind of Mexico City as the emissions are transported out of the area. This may lead to regional impacts that were not explored in this study. It is recommended that measurements of PANs in the outflow regions should be undertaken to evaluate the potential impacts of ozone and PAN on ecosystems in the region.
15
The results for black carbon aerosol content indicate that this pollutant is not being reduced in Mexico City, consistent with no control strategies being put into place. It is clear that this and other megacities continue to be major sources of this key aerosol species on a global scale. As the lifetimes for black carbon aerosols are anticipated to be longer than that for the more hygroscopic aerosol species, the global impact of the
20
emissions from megacities such as Mexico City must continue to be evaluated (Gaffney and Marley, 2005b). Considering the importance of black carbon aerosols in radiative balance, these major sources of absorbing aerosols cannot be ignored if we are to adequately assess their role in climate change.
Acknowledgements. This work was supported by the U.S. Department of Energy, Office of
25
Science, Office of Biological and Environmental Research (OBER), Atmospheric Science Pro-gram. Part of this work was performed at Argonne National Laboratory under DOE contract W-31-109-Eng-38. We wish to thank R. Petty of OBER for his continuing encouragement. We also wish to thank the scientists and researchers at CENICA and IMP and the Government of
ACPD
7, 1421–1448, 2007 PAN and Carbonaceous Aerosol in Mexico City J. S. Gaffney et al. Title Page Abstract Introduction Conclusions References Tables Figures ◭ ◮ ◭ ◮ Back CloseFull Screen / Esc
Printer-friendly Version Interactive Discussion
the Federal District, for their hospitality and help with the measurements during the IMADA-AVER and the MCMA-Mexico Megacity 2003 collaborative field studies.
References
Allen, G. A., Lawrence, J., Koutrakis, P.: Field validation of a semi-continuous method for aerosol black carbon (Aethalometer) and temporal patterns of summertime hourly black
car-5
bon measurements in southwestern PA. Atmos. Environ. 33, 817, 1999.
Andreae, M. O. and Gelencser, A.: Black carbon or brown carbon? The nature of light-absorbing carbonaceous aerosols. Atmos. Chem. Phys. Discuss., 6, 3419–3463, 2006,
http://www.atmos-chem-phys-discuss.net/6/3419/2006/.
Babich, P., Davey, M., Allen, G., Koutrakis, P.: Method comparisons for particulate nitrate,
ele-10
mental carbon, and PM2.5 mass in seven U.S. cities, Journal of Air and Waste Management Association, 50, 1095, 2000.
Barth, M. C. and Church, A. T.: Regional and global distributions and lifetimes of sulfate aerosols from Mexico City and southeast China, J. Geophys. Res., 104, 30 231–30 239, 1999.
15
Blake, D. R. and Rowland, F. S.: Urban leakage of liquefied petroleum gas and its impact on Mexico City air quality, Science, 269, 953–956, 1995.
Bravo, H. A., Perrin, G. F., Sosa, R. E., Torres, R. J.: Results of an air pollution strategy (lead reduction in gasoline) on the air quality of Mexico City, In Proceedings of the 8th Clean Air Congress, Man and his Ecosystem, Elseiver Science Publishers, B.V. The Hague, The
20
Netherlands, 1989.
Carter, W. P. L.: Development of ozone reactivity scales for volatile organic compounds, Journal of Air and Waste Management Association 44, 881–889, 1994.
Chow, J. C., Watson, J. G., Pritchett, L. C., Pierson, W. R., Frazier, C. A., and Purcell, R. G.: The DRI thermal/optical reflectance carbon analysis system: Description, evaluation and
25
applications in U.S. air quality studies, Atmos. Environ. 27A, 1185–1201, 1993.
Chow, J. C., Watson, J. G., Crow, D., Lowenthal D. H., and Merrifield, T.: Comparison of IMPROVE and NIOSH carbon measurements, Aerosol Science and Technology 34, 23–41, 2001.
Chow, J. C., Watson, J. G., Edgerton, S. A., Vega, E.: Chemical composition of PM2.5 and
30
ACPD
7, 1421–1448, 2007 PAN and Carbonaceous Aerosol in Mexico City J. S. Gaffney et al. Title Page Abstract Introduction Conclusions References Tables Figures ◭ ◮ ◭ ◮ Back CloseFull Screen / Esc
Printer-friendly Version Interactive Discussion
PM10 in Mexico City during winter 1997, The Science of the Total Environment, 287, 177– 201, 2002.
Chow, J. C., Watson, J. G., Chen, L.-W. A., Arnott, W. P., and Moosm ¨uller, H.: Equivalance of elemental carbon by thermal/optical reflectance and transmittance with different temperature protocols, Environmental Science and Technology 38, 4414–4422, 2004.
5
Chung, S. H., Seinfeld, J. H.: Climate response of direct radiative forcing of anthropogenic black carbon, J. Geophys. Res. 110, D11102, doi:10.1029/2004JD005441, 2005.
DDF (Departamento del Distrito Federal, Gobierno del Estado de M ´exico, Secretar´ıa de Medio Ambiente Recursos Naturales y Pesca, and Secretar´ıa de Salud), 1996, Programa para mejorar la calidad del aire en el Cvalle de M `exico, 1995–2000 (PROAIRE), Mexico.
10
Doran, J. C., Abbott, S., Archuleta, J., Bian, X., Chow, J., Coulter, R. L., de Wekker, S. F. J., Edgerton, S., Elliott, S., Fernandez, A., Fast, J. D., Hubbe, J. M., King, C., Langley, D., Leach, J., Lee, J. T., Martin, T. J., Martinez, D., Martinez, J. L., Mercado, G., Mora, V., Mulhearn, M., Pena, J. L., Petty, R., Porch, W., Russell, C., Salas, R., Shannon, J. D., Shaw, W.J., Sosa, G., Tellier, L., Templeman, B., Watson, J. G., White, R., Whiteman, C. D., and Wolfe, D.: The
15
IMADA-AVER boundary layer experiment in the Mexico City area, B. Am. Meteorol. Soc., 79, 2497–2508, 1998.
Dua, S. K., Hopke, P. K., and Raunemaa, T.: Hygroscopicity of Diesel Aerosols, Water, Air and Soil Pollution 112, 247–257, 1999.
Edgerton, S. A., Arriaga, J. L., Archuleta, J., Bian, X., Bossert, J. E., Chow, J. C., Coulter,
20
R. L., Doran, J. C., Doskey, P. V., Elliot, S., Fast, J. D., Gaffney, J. S., Guzman, F., Hubbe, J. M., Lee, J. T., Malone, E. L., Marley, N. A., McNair, L. A., Neff, W., Ortiz, E., Petty, R., Ruiz, M., Shaw, W. J., Sosa, G., Vega, E., Watson, J. G., Whiteman, C. D., and Zhong, S.: Particulate air pollution in Mexico City: A collaborative research project, Journal of Air and Waste Management Association 49, 1221–1229, 1999.
25
Elliott, S., Blake, D. R., Rowland, F. S., Lu, R., Brown, M. J., Williams, M. D., Russell, A. G., Bossert, J. E., Streit, G. E., Santoyo, M. R., Guzman, F., Porch, W. M., McNair, L. A., Keyantash, J., Kao, C-Y. J., Turco, R. P., Eichinger, W. E.: Ventilation of liquefied petroleum gas components from the valley of Mexico, J. Geophys. Res. 102, 21 197–21 207, 1997. Fast, J. D. and Zhong, S.: Meteorological factors associated with inhomogeneous ozone
con-30
centrations within the Mexico City basin, J. Geophys. Res. 103, 18 927–18 946, 1998. Finlayson-Pitts, B. J., Pitts, J. N., Jr.: Chemistry of the Upper and LowerAtmospheric, Academic
ACPD
7, 1421–1448, 2007 PAN and Carbonaceous Aerosol in Mexico City J. S. Gaffney et al. Title Page Abstract Introduction Conclusions References Tables Figures ◭ ◮ ◭ ◮ Back CloseFull Screen / Esc
Printer-friendly Version Interactive Discussion
Gaffney, J. S., Fajer, R., and Senum, G. I.: An improved procedure for high purity gaseous peroxyacetyl nitrate production: use of heavy lipid solvents, Atmos. Environ., 18, 215–218, 1984.
Gaffney, J. S., Marley N. A., and Prestbo, E. W.: Peroxyacyl nitrates (PANS): Their physical and chemical properties. Handbook of Environmental Chemistry, Volume 4/Part B. (Air Pollution)
5
pp.1-38, O. Hutzinger, ed. Springer-Verlag, Berlin, Germany, 1989.
Gaffney, J. S., Marley, N. A., and Prestbo, E. W.: Measurements of peroxyacetyl nitrate (PAN) at a remote site in the southwestern United States: Tropospheric implications, Environmental Science and Technology, 27, 1905–1910, 1993.
Gaffney, J. S., Marley, N. A., Martin, R. S., Dixon, R. W., Reyes, L .G., Popp, C. J.: Potential
10
air quality effects of using ethanol-gasoline fuel blends: a field study in Albuquerque, New Mexico. Environmental Science and Technology, 31, 3053–3061, 1997.
Gaffney, J. S., Bornick, R. M., Chen, Y.-H., Marley, N.A.: Capillary gas chromatographic analy-sis of nitrogen dioxide and PANs with luminal chemiluminescent detection, Atmos. Environ. 32, 1145–1154, 1998.
15
Gaffney, J. S., Marley, N. A., Cunningham, M. M., and Doskey, P. V.: Measurements of Peroxya-cyl Nitrates (PANs) in Mexico City: Implications for Megacity Air Quality Impacts on Regional Scales, Atmos. Environ., 33, 5003–5012, 1999.
Gaffney, J. S., Marley, N. A.: Analysis of Peroxyacyl Nitrates (PANs), Organic Nitrates, Perox-ides, and Peracids. Chapter 19, Chromatographic Analysis of the Environment, 3rdEdition,
20
L. Nollett, Ed, Marcel Dekker/CRC Press, pp. 711–741, 2005a.
Gaffney, J. S. and Marley, N. A.: The Importance of the Chemical and Physical Properties of Aerosols in Determining Their Transport and Residence Times in the Troposphere, Chap-ter 14, Urban Aerosols and Their Impacts: Lessons Learned from the World Trade CenChap-ter Tragedy. J.S. Gaffney and N.A. Marley, eds. ACS Symposium Book 919, Oxford University
25
Press, pp. 286–300, 2005b.
Gaffney, J. S. and Marley, N. A.: A brief history of aerosol carbon analytical methods. Eighth Conference on Atmospheric Chemistry Symposium: Aerosols – Radiative Impacts and Visi-bility Reduction. 86th American Meteorological Society National Meeting, Atlanta, GA 2006, Proceedings Volume, Paper 1.5, 2006.
30
Grosjean, D.: Ambient PAN and PPN in southern California from 1960 to the SCOS97-NARSTO, Atmos. Environ. 37, S221–S238, 2003.
Hansen, A. D. A., Rosen, H., and Novakov, T.: Real-time measurement of the absorption 1438
ACPD
7, 1421–1448, 2007 PAN and Carbonaceous Aerosol in Mexico City J. S. Gaffney et al. Title Page Abstract Introduction Conclusions References Tables Figures ◭ ◮ ◭ ◮ Back CloseFull Screen / Esc
Printer-friendly Version Interactive Discussion
coefficient of aerosol particles, Applied Optics, 21, 3060, 1982.
Hansen, A. D. A. and McMurry, P.H.: An intercomparison of measurements of aerosol elemental carbon during the 1986 Carbonaceous Species Methods Comparison Study. Journal of Air and Waste Management Association. 40, 894, 1990.
Hinds, W.C.: Aerosol technology: properties, behavior and measurement of airbourne particles,
5
John Wiley and Sons, USA, 1999.
Jacobson, M. Z.: Global direct radiative forcing due to multicomponent anthropogenic and natural aerosols. J. Geophys. Res., 106, 1551–1568, 2001.
Jacobson, M. Z.: Conrol of fossil fuel particulate black carbon and organic matter, pos-sibly the most effective method of slowing global warming. J. Geophys. Res., 107,
10
doi:10.1029/2001JD001376, 2002.
Jacobson, M. Z.: Climate response of fossil fuel and biofuel soot, accounting for soot’s feedback to snow and sea ice albedo and emissivity, J. Geophys. Res. 109, D21201, doi:10.1029/2004JD004945, 2004.
Marley, N. A., Gaffney, J. S., White, R. V., Rodriguez-Cuadra, L., Herndon, S.E., Dunlea, E.,
15
Volkamer, R. M., Molina, L. T., Molina, M. J.: Fast gas chromatography with luminol chemi-luminescence detection for the simultaneous determination of nitrogen dioxide and peroxy-acetyl nitrate in the atmosphere, Review of Scientific Instruments, 75, 4595–4605, 2004. Marley, N. A., Gaffney, J. S., Baird, J. C., Blazer, C. A., Drayton, P. Pj., Frederick, J. E. The
deter-mination of scattering and absorption coefficients of size-fractionated aerosols for radiative
20
transfer calculations. Aerosol Science and Technology 34, 535–549, 2001.
MARI: Mexico City Air Quality Initiative, Los Alamos National Laboratory and the Mexican Petroleum Institute, Los Alamos Report #LA-12699, 1994.
Molina, L. T. and Molina, M. J.: Air quality impacts: Local and global concern. Chapter 1, Air quality in the Mexico Megacity, An integrated assessment. Molina, L.T., Molina, M.J., Eds.
25
Kluwer Academic, Netherlands, 2002a.
Molina, L. T. and Molina, M. J.: Cleaning the air:A comparative study. Chapter 2, Air quality in the Mexico Megacity, An integrated assessment. Molina, L. T., Molina, M. J., Eds. Kluwer Academic, Netherlands, 2002a.
Raga, G. B., Baumgardner, D., Castro, T., Mart`ınez-Arroyo, A., and Navarro-Gonz ´alez, R.:
30
Mexico City air quality: a qualitative review of gas and aerosol measurements (1960–2000), Atmos. Environ. 35, 4041–4058, 2001a.
ACPD
7, 1421–1448, 2007 PAN and Carbonaceous Aerosol in Mexico City J. S. Gaffney et al. Title Page Abstract Introduction Conclusions References Tables Figures ◭ ◮ ◭ ◮ Back CloseFull Screen / Esc
Printer-friendly Version Interactive Discussion
and implications for the regional environment: Mexico City, Atmos. Environ. 35, 1805–1811, 2001b.
Ramanathan, V., Chung, C., Kim, D., Bettge, t., Buja, L., Kiel, J. T., Washington, W. M., Fu, Q., Sikka, D. R., and Wild, M.: Atmospheric brown clouds: Impacts on South Asain climate and hydrological cycle. Proc. Natl. Acad. Sci. USA, 102, 5326–5333, 2005.
5
Rappengluck, B., Oyola, P., Olaeta, U. I., Schmitt, R., and Fabian, P.: The evolution of pho-tochemical smog in the metropolitan area of Santiago, Chile, Preprint Paper 3.8 10th Con-ference on Air Pollution Meteorology. &8th Annual Meeting of the American Meteorological Society, Phoenix, AZ, pp. 86–90, 1998.
Rappengluck, B., Oyola, P., Olaeta, I., and Fabian, P.: The evolution of photochemical smog in
10
the metropolitan area of Santiago, Chile, J. App. Meteorol. 39, 275–290, 2000.
Riveros, H. G., Arriaga, J. L., Tejeda, J., Juli ´an-S ´anchez, A., and Riveros-Rosas, H.: Ozone and its precursors in the atmosphere of Mexico City, Journal of Air and Waste Management Association 48, 866–871, 1998.
Schifter, I., D`ıaz, L., M ´ugica, V., and L ´opez-Salinas, E.: Fuel-based motor vehicle emission
15
inventory for the metropolitan area of Mexico City. Atmos. Environ. 39, 931–940, 2005. Schifter, I., D`ıaz, L., Dur ´an, L., Guzm ´an, E., Ch ´avez, O., and L ´opez-Salinas, E.: Remote
sensing study of emissions from motor vehicles in the metropolitan area of Mexico City, Environmental Science and Technology 37, 395–401, 2003.
South Coast Air Quality Management District: Air Quality Digest,1–15, November, December,
20
1985.
Streit, G. E. and Guzman, F.: Mexico City air quality: Progress of an international collaborative project to define air quality management options, Atmos. Environ. 30, 723–733, 1996. Tuazon, E. C., Winer, A. M., and Pitts, J. N., Jr.: Trace pollutant concentrations in a multiday
smog episode in the California south coast air basin by long path length Fourier transform
25
infrared spectroscopy. Environmental Science and Technology, 15, 1232–1237, 1981. Zarski, L.: Urban air pollution in megacities of the world. Environment 36, 2–3, 1994.
ACPD
7, 1421–1448, 2007 PAN and Carbonaceous Aerosol in Mexico City J. S. Gaffney et al. Title Page Abstract Introduction Conclusions References Tables Figures ◭ ◮ ◭ ◮ Back CloseFull Screen / Esc
Printer-friendly Version Interactive Discussion 45 50 55 60 65 70 75 80 85 Julian Day 0 5 10 15 20 25 30 35 40 p p b
Fig. 1. Concentration profile for peroxyacetyl nitrate (PAN) measured in Mexico City from 20
ACPD
7, 1421–1448, 2007 PAN and Carbonaceous Aerosol in Mexico City J. S. Gaffney et al. Title Page Abstract Introduction Conclusions References Tables Figures ◭ ◮ ◭ ◮ Back CloseFull Screen / Esc
Printer-friendly Version Interactive Discussion 90 95 100 105 110 115 120 125 Julian Day 0 5 10 15 20 p p b
Fig. 2. Concentration profile for peroxyacetyl nitrate (PAN) measured in Mexico City from 3
March to 1 April 2003.
ACPD
7, 1421–1448, 2007 PAN and Carbonaceous Aerosol in Mexico City J. S. Gaffney et al. Title Page Abstract Introduction Conclusions References Tables Figures ◭ ◮ ◭ ◮ Back CloseFull Screen / Esc
Printer-friendly Version Interactive Discussion 45 50 55 60 65 70 75 80 85 Julian Day 0 0.1 0.2 0.3 0.4 0.5 0.1 PAN /O zo n e
Fig. 3. The ratio of PAN to Ozone daily maximum concentrations in Mexico City from 20
ACPD
7, 1421–1448, 2007 PAN and Carbonaceous Aerosol in Mexico City J. S. Gaffney et al. Title Page Abstract Introduction Conclusions References Tables Figures ◭ ◮ ◭ ◮ Back CloseFull Screen / Esc
Printer-friendly Version Interactive Discussion 90 95 100 105 110 115 120 125 Julian Day 0 0.1 0.2 0.3 0.4 0.5 0.1 PAN /O zo n e
Fig. 4. The ratio of PAN to Ozone daily maximum concentrations in Mexico City from 3 March
to 1 April 2003.
ACPD
7, 1421–1448, 2007 PAN and Carbonaceous Aerosol in Mexico City J. S. Gaffney et al. Title Page Abstract Introduction Conclusions References Tables Figures ◭ ◮ ◭ ◮ Back CloseFull Screen / Esc
Printer-friendly Version Interactive Discussion 54 54.5 55 55.5 56 Julian Day 0 5 10 15 PAN (p p b )
PAN Ozone NO2
50 100 150 O zo n e , N O 2 (p p b ) 0
ACPD
7, 1421–1448, 2007 PAN and Carbonaceous Aerosol in Mexico City J. S. Gaffney et al. Title Page Abstract Introduction Conclusions References Tables Figures ◭ ◮ ◭ ◮ Back CloseFull Screen / Esc
Printer-friendly Version Interactive Discussion 98 98.5 99 99.5 100 Julian Day 0 50 100 150 O zo n e , N O 2 (p p b ) 0 5 10 15 PAN (p p b ) BC (u g /m3 )
PAN Ozone NO2 BC
BC
(λ
g
/m
3)
Fig. 6. Concentration profiles for ozone, NO2, PAN, and black carbon aerosol for Julian Day 98
and 99, 2003.
ACPD
7, 1421–1448, 2007 PAN and Carbonaceous Aerosol in Mexico City J. S. Gaffney et al. Title Page Abstract Introduction Conclusions References Tables Figures ◭ ◮ ◭ ◮ Back CloseFull Screen / Esc
Printer-friendly Version Interactive Discussion 0 10 20 30 40 50 60 70 8 PM 2.5 ug/m3 0 0 5 10 15 20 EC u g /m3 EC (λ g /m 3) PM2.5 (λg/m3)
Fig. 7. Elemental carbon content of PM2.5 particulate samples collected during the
ACPD
7, 1421–1448, 2007 PAN and Carbonaceous Aerosol in Mexico City J. S. Gaffney et al. Title Page Abstract Introduction Conclusions References Tables Figures ◭ ◮ ◭ ◮ Back CloseFull Screen / Esc
Printer-friendly Version Interactive Discussion 0 10 20 30 40 50 60 70 8 PM2.5 ug/m3 0 0 5 10 15 20 BC u g /m3 0 10 20 30 40 50 60 70 8 PM2.5 ug/m3 0 0 5 10 15 20 BC u g /m3 PM2.5 (λg/m3) BC (λ g /m 3)
Fig. 8. Black carbon and PM2.5aerosol concentrations measured during the Mexico Megacity
2003 study.


![[DOC] Cours environnement réseau et active directory](data:image/gif;base64,R0lGODlhAQABAIAAAP///wAAACH5BAEAAAAALAAAAAABAAEAAAICRAEAOw==)