HAL Id: hal-00298104
https://hal.archives-ouvertes.fr/hal-00298104
Submitted on 31 Mar 2008
HAL is a multi-disciplinary open access
archive for the deposit and dissemination of
sci-entific research documents, whether they are
pub-lished or not. The documents may come from
teaching and research institutions in France or
abroad, or from public or private research centers.
L’archive ouverte pluridisciplinaire HAL, est
destinée au dépôt et à la diffusion de documents
scientifiques de niveau recherche, publiés ou non,
émanant des établissements d’enseignement et de
recherche français ou étrangers, des laboratoires
publics ou privés.
Detecting vegetation-precipitation feedbacks in
mid-Holocene North Africa from two climate models
Y. Wang, M. Notaro, Z. Liu, R. Gallimore, S. Levis, J. E. Kutzbach
To cite this version:
Y. Wang, M. Notaro, Z. Liu, R. Gallimore, S. Levis, et al.. Detecting vegetation-precipitation
feed-backs in mid-Holocene North Africa from two climate models. Climate of the Past, European
Geo-sciences Union (EGU), 2008, 4 (1), pp.59-67. �hal-00298104�
Clim. Past, 4, 59–67, 2008 www.clim-past.net/4/59/2008/
© Author(s) 2008. This work is distributed under the Creative Commons Attribution 3.0 License.
Climate
of the Past
Detecting vegetation-precipitation feedbacks in mid-Holocene North
Africa from two climate models
Y. Wang1,*, M. Notaro1, Z. Liu1, R. Gallimore1, S. Levis2, and J. E. Kutzbach1
1Center for Climatic Research, University of Wisconsin-Madison, 1225 West Dayton Street, Madison, WI 53706, USA 2National Center for Atmospheric Research, PO BOX 3000, Boulder, CO 80307, USA
*now at: Pacific Northwest National Laboratory, PO BOX 999, MSIN K9-24, Richland, WA 99352, USA
Received: 13 July 2007 – Published in Clim. Past Discuss.: 25 July 2007
Revised: 7 February 2008 – Accepted: 10 March 2008 – Published: 31 March 2008
Abstract. Using two climate-vegetation model simulations
from the Fast Ocean Atmosphere Model (FOAM) and the Community Climate System Model (CCSM, version 2), we investigate vegetation-precipitation feedbacks across North Africa during the mid-Holocene. From mid-Holocene snap-shot runs of FOAM and CCSM2, we detect a negative feed-back at the annual timescale with our statistical analysis. Us-ing the Monte-Carlo bootstrap method, the annual negative feedback is further confirmed to be significant in both sim-ulations. Additional analysis shows that this negative inter-action is partially caused by the competition between evap-oration and transpiration in North African grasslands. Fur-thermore, we find the feedbacks decrease with increasing timescales, and change signs from positive to negative at increasing timescales in FOAM. The proposed mechanism for this sign switch is associated with the different persistent timescales of upper and lower soil water contents, and their interactions with vegetation and atmospheric precipitation.
1 Introduction
Vegetation interactions/feedbacks have received tremendous attention in modern climate (Charney et al., 1975, 1977; Schlesinger et al., 1990; Pielke et al., 1998; Brovkin 2002) and paleoclimate (Kutzbach, 1981; Kutzbach et al., 1996; Ganopolski et al., 1998; Claussen et al., 1999, 2003; Fo-ley et al., 2003; Wang et al., 2005a, b; Wang and Mysak, 2005) studies. Previous understanding (Charney et al., 1975, 1977; Woodward et al., 1998; Box 2–6 in Ruddiman, 2001) largely emphasized that those interactions played an impor-tant role in amplifying initial climate perturbations (i.e., pos-itive feedbacks). Using a statistical method (see Liu et al.,
Correspondence to: Y. Wang
2006a, Notaro et al., 2006 for detailed methodology), we present a negative vegetation-precipitation feedback at the annual timescale from two mid-Holocene simulations with FOAM (Gallimore et al., 2005), and CCSM2 (Levis et al., 2004a), both of which are coupled with the Lund-Potsdam-Jena Dynamic Global Vegetation Model (LPJ-DGVM, Sitch et al., 2003).
In semiarid areas, the dynamics of the simulated hydro-logic cycle is partially governed by the interplay between transpiring water in vegetated areas and surface evapora-tion from bare soils (Dirmeyer, 1994; Sellers et al., 1997). One of the two underlying processes is that when vegetation cover increases, ground evaporation decreases (mainly be-cause there is less energy reaching the soil) and transpiration increases (because there is more vegetation). In our experi-ments, the imbalance of a large bare ground evaporation over transpiration under fully wet soil conditions in mid-Holocene can produce a local enhancement of rainfall for bare soil con-dition compared to vegetated concon-dition (i.e., negative feed-back). A previous study (Doherty et al., 2000) with the GEN-ESIS climate model (Thompson and Pollard, 1997) detected weak or insignificant vegetation feedback in amplifying pre-cipitation in eastern North Africa. Furthermore, Levis et al. (2004a) also mentioned in their 50-year “6K6V” simu-lation that there may have been a weak negative precipita-tion feedback in North Africa. Furthermore, a recent ob-servational study (Wang et al., 2006) detected that at differ-ent timescales, the sign of vegetation-precipitation interac-tions may change with their statistical model. Previous mid-Holocene studies (Cooperative mid-Holocene Mapping Project (COHMAP), 1988; BIOME 6000, Prentice and Webb, 1998) indicated that soil in mid-Holocene North Africa was wetter and darker than that in pre-industrial and present-day condi-tions. Vegetation, mainly grassland, extended farther north into the present-day Sahara Desert (Gasse, 2000, 2002). Small and Kurc (2001) find that observed surface albedo is lower under wet conditions in semiarid areas. Under such a
60 Y. Wang et al.: Vegetation-precipitation feedback in mid-Holocene North Africa
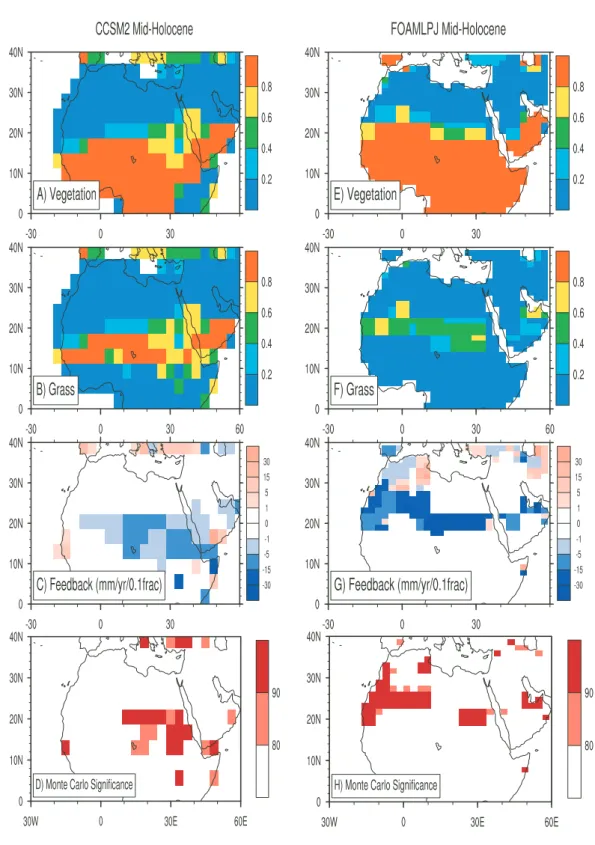
Fig. 1. Mid-Holocene total vegetation fraction for (A) CCSM2 and (E) FOAMLPJ; mid-Holocene grassland coverage for (B) CCSM2 and (F) FOAMLPJ. Estimated feedback parameters (mm/year/0.1 fraction) between total vegetation fraction and annual precipitation (Eq. 2) for (C) CCSM2 and (G) FOAMLPJ mid-Holocene snapshot runs. Statistical (Monte-Carlo) significance of feedback parameters for (D) CCSM2 and (H) FOAMLPJ. In calculating the feedback parameters, we constrain the range of parameter from –60 to 60 mm/year/0.1 fraction. We did this because in cases when the denominator of Eq. (2) becomes small (low vegetation autocorrelation), the estimated feedback parameter becomes a huge, unreliable number. We also use 9-gridcell averaging to smooth the feedback parameters here and in Fig. 2.
Y. Wang et al.: Vegetation-precipitation feedback in mid-Holocene North Africa 61 distinct climate background, vegetation feedbacks are quite
different than present-day (Liu et al., 2006a).
In the meantime of this research, Notaro et al. (2008) conducted a statistical and dynamical assessment of simu-lated vegetation-rainfall interactions in mid-Holocene North Africa with foci on the FOAM model. Compared with the study of Notaro et al. (2008), we present here the detailed results from two mid-Holocene equilibrium simulations in fully coupled climate models (FOAM and CCSM2). Our statistical approach is similar to that employed in Notaro et al. (2008). However, we have combined it with an extensive Monte-Carlo bootstrap test in order to assign the statistical significance for our assessment. In addition, our result fur-ther expands the findings of Notaro et al. (2008) in that we report the timescale-dependence of the estimated vegetation-precipitation feedbacks, which, to our best knowledge, has not been reported before in vegetation and paleoclimate re-searches.
2 Model description, experimental design and outline of methodology
2.1 Model description and experimental design
The coupled atmosphere-ocean component is FOAM ver-sion 1.5. The atmosphere module has a horizontal resolu-tion of R15 (4.5◦ by 7.5◦ latitude-longitude) and 18 verti-cal levels. The ocean component has a horizontal resolu-tion of 128×128 and 32 vertical levels. The LPJ module has been synchronously coupled with FOAM (see Gallimore et al., 2005 for more details). The simulated vegetation pattern agrees with satellite observation (Gallimore et al., 2005; Notaro et al., 2005) and other vegetation model simu-lations (Cramer et al., 2001). The mid-Holocene simulation of CCSM2 (Holland, 2003) consists of a 350-year integration with orbital forcing prescribed at 6000 years before present (hereafter 6 ka) with atmospheric CO2 fixed (280 ppmv), which was extended from the “6K6V” simulation in Levis et al. (2004a). The CCSM2 is a fully coupled atmosphere-ocean-land surface-vegetation climate model (see Holland, 2003; Levis et al., 2004b for more details), and is run at T31 (3.75◦by 3.75◦latitude-longitude) and 26 vertical lev-els. The ocean model of CCSM2 has 40 levels in the vertical and a horizontal resolution of 100×116.
A typical difference between FOAM and CCSM2 is their soil modules. CCSM2 has ten soil layers, while FOAM only has two soil layers. However, the bare ground surface albedo only depends on the top layer soil moisture in our climate models. In CCSM2, soil texture varies by grid cell and with depth (Oleson et al., 2004). The data comes from the IGBP soil dataset (Global Soil Data Task, 2000). Soil colors are from Zeng et al. (2002). The vegetation and soils at 6K in CCSM2 tend to have little albedo difference and sometimes in a direction opposite than expected (Levis et al., 2004a).
In FOAM, soil texture is fixed for the period of integration. In substituting the original FOAM land component with the LPJ-based one, we retain the original FOAM CCM2-based surface/soil diffusive temperature calculation scheme that as-sumes 4-soil layers, but replaces the simple, single layer (bucket) soil water component with the 2-layer soil water scheme of LPJ (Sitch et al., 2003). The local runoff is cal-culated when the soil water of a layer exceeds water holding capacity, and is used as input to the river routing scheme for freshwater discharge into the oceans. The zonal distribution of average runoff predicted by CCSM2 also compares favor-ably to a 1◦ by 1◦ gridded dataset of observed runoff (see Fig. 8 in Stich et al., 2003).
The FOAMLPJ Holocene transient simulation (Liu et al., 2006b; Liu et al., 2007) restarts from the end of the mid-Holocene snapshot run (see Gallimore et al., 2005 for more details), and is integrated from 6.5 ka to pre-industrial (0 ka) with varying orbital forcing (Berger, 1978) and fixed CO2
(280 ppmv) without flux corrections. This experiment set-up allows us to focus on the insolation forcing without con-sidering other external (solar and CO2 variability) and in-ternal volcano) forcings. In this experiment, we simulate a green Sahara and followed by an abrupt collapse of vegeta-tion (mainly grassland) in Northern Africa region. The veg-etation collapse region (Liu et al., 2007) corresponds to the major negative feedback region in Fig. 1g of our paper. 2.1.1 Outline of methodology
Following the methodology in Frankignoul and Hasselmann (1977), Liu et al. (2006a) and Notaro et al. (2006), atmo-spheric variables (precipitation, temperature, evapotranspira-tion etc.) can be divided into two components:
A(t + δta) = λVV (t ) + N (t + δta) (1)
where A(t) represents atmosphere variables at time t, V (t ) is vegetation variables at time t, λV is the feedback
parame-ter, δtais the atmospheric response time, and N (t ) is the
at-mospheric noise from internal atat-mospheric processes that are independent of vegetation variability. Following the method of Frankignoul et al. (1998), we have:
λV =
cov[A(t ), V (t − τ )]
cov[V (t ), V (t − τ )] (2)
where τ is the lag time, which is longer than the persis-tence time of atmospheric internal variability. The feedback parameter λV is calculated as the ratio of lagged covariance
between A and V to the lagged covariance of V . When cal-culating the feedback parameter, we employed the weighted average from the first three lags (e.g., one, two and three year lags for annual timescale) with weights of 1.0, 0.5 and 0.25, respectively.
Furthermore, the statistical significance of λV can be
62 Y. Wang et al.: Vegetation-precipitation feedback in mid-Holocene North Africa
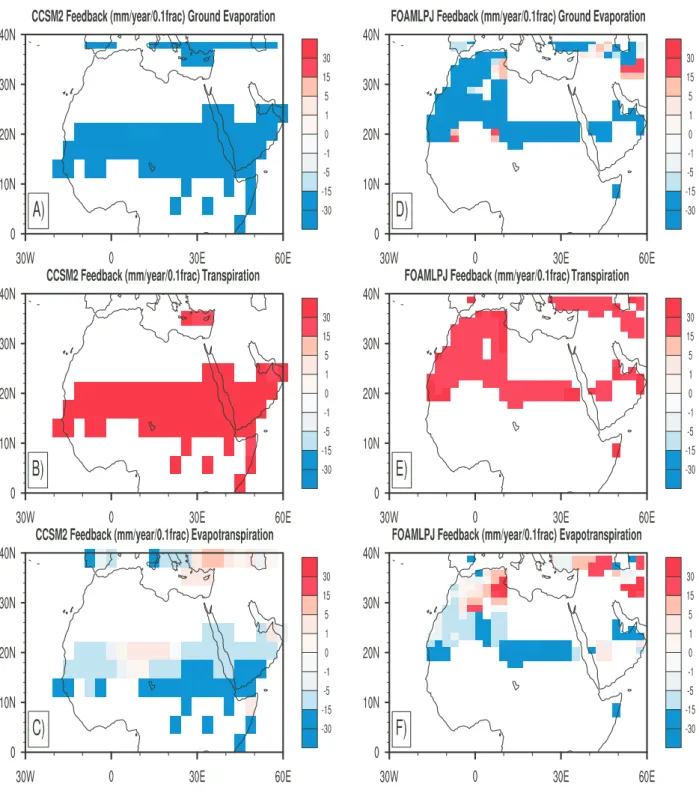
Fig. 2. Estimated feedback (Eq. 2) between total vegetation fraction and ground evaporation (mm/year/0.1 fraction) for (A) CCSM2 and (D) FOAMLPJ from mid-Holocene snapshot runs. Estimated feedback between total vegetation fraction and transpiration (mm/year/0.1 fraction) for (B) CCSM2 and (E) FOAMLPJ from mid-Holocene snapshot runs. Estimated feedback between total vegetation fraction and evapotranspiration (mm/year/0.1 fraction) for (C) CCSM2 and (F) FOAMLPJ from mid-Holocene snapshot runs. Note that, as in Fig. 1, the three leads averaging with same weights is used.
Frankignoul, 2002). λV is computed 1000 times, each using
an atmospheric time series derived from a random permuta-tion of the original time series At. The accumulative
proba-bility produced is then used to judge the significance of λV.
Y. Wang et al.: Vegetation-precipitation feedback in mid-Holocene North Africa 63
Fig. 3. Annual rainfall (mm/day) for CCSM2 (A) 6K control, (C) 0K control, and (E) 6K minus 0K. Top soil moisture content (mm3/mm3) for CCSM2 (B) 6K control, (D) 0K control, and (F) 6K minus 0K from two sets of 350-year control simulations.
3 Results
Following the early work of Frankignoul et al. (1998), the vegetation feedback has been assessed with a simple lin-ear statistical method (Liu et al., 2006a; Notaro et al., 2008). Figure 1 indicates the distribution of total vege-tation, grassland and the averaged feedback parameter be-tween total vegetation cover and annual precipitation from CCSM2 and FOAMLPJ mid-Holocene snapshot runs. In the mid-Holocene total vegetation cover, mainly perennial
grass-land, has extended farther north into the Sahara region in both models (figures not shown here for vegetation/grassland changes between mid-Holocene and pre-industrial). The negative feedback zone matches well with the grassland area, with a magnitude from 1 to about 15 mm/year/0.1 fractional coverage for CCSM2, and from 5 to about 30 mm/year/0.1 fractional coverage for FOAMLPJ. Overall, CCSM2 indi-cates a slightly weaker negative feedback than FOAMLPJ, although both are statistically significant (see Fig. 1d and h). To test the statistical significance, we randomly reorganize
64 Y. Wang et al.: Vegetation-precipitation feedback in mid-Holocene North Africa
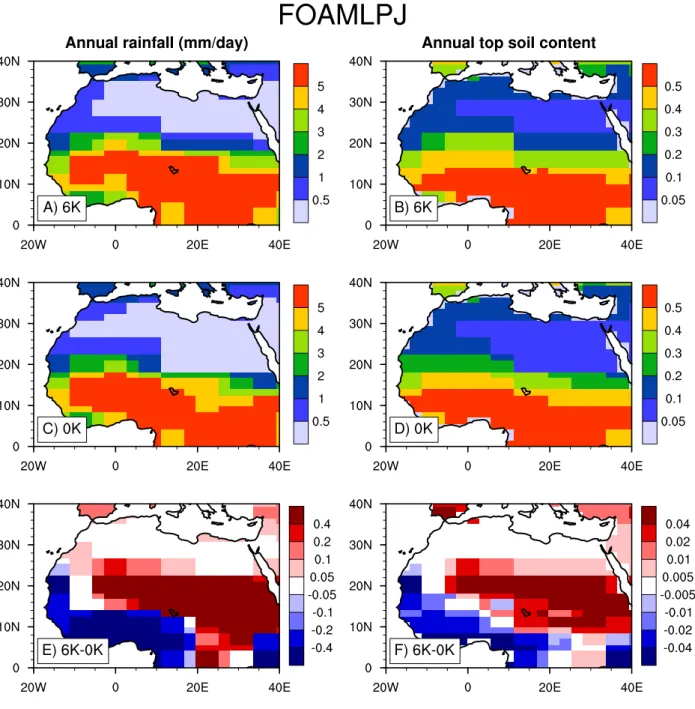
Fig. 4. Annual rainfall (mm/day) for FOAMLPJ (A) 6K control, (C) 0K control, and (E) 6K minus 0K. Top soil moisture content (mm3/mm3) for FOAMLPJ (B) 6K control, (D) 0K control, and (F) 6K minus 0K from two sets of 400-year control simulations.
the annual precipitation, and create 1000 sets for both sim-ulations. We recalculate the new feedback parameters with randomly-ordered annual precipitation, and compared them with those presented in Fig. 1c and g. With 80% and 90% confidence levels, we declare that the negative feedback is of statistical significance in both simulations in the North African semiarid grassland areas.
With a detailed feedback analysis, we find that the main source of negative feedback comes from bare-ground evap-oration (Fig. 2). Note that the total moisture flux, namely
evapotranspiration, is equal to the sum of bare-ground evapo-ration and transpievapo-ration from vegetated surfaces. The transpi-ration term is always positively related to vegetation change. However, among other factors, the total moisture flux de-pends strongly on the competition of bare-ground evapo-ration and transpievapo-ration from vegetated surfaces. In semi-dry grassland areas, if the soil is wet and dark, as in mid-Holocene condition, the first term becomes the same/more important as/than the second term, which causes the strong coincidence of grassland and negative feedback area.
Y. Wang et al.: Vegetation-precipitation feedback in mid-Holocene North Africa 65 Charney’s albedo change theory does not work out here
because the albedo change from grassland to wet/dark soil is small in mid-Holocene. Hence the pre-condition of a large surface albedo change from deserted (bare-ground) and veg-etated surfaces does not apply. Furthermore, a map of feed-back parameters between total vegetation and evapotranspi-ration (Fig. 2c and f) indicates that the negative feedback mainly caused by the increase of bare-ground evaporation, overcomes the reduction of transpiration. We speculate that this may be partially related to the evaporation from a wetter and darker soil in mid-Holocene climatic conditions. When we analyze pre-industrial snapshot simulations from both CCSM2 (Levis et al., 2004) and FOAMLPJ, the negative feedback almost disappears (figures not shown) when the soil becomes drier and lighter.
In the 6500-year transient simulation of FOAMLPJ, we also capture a similar negative feedback and statistical signif-icance as above (figure not shown). In this transient run, we reproduce a vegetation (mainly grassland) collapse at around 5000 years ago (Liu et al., 2006b; Liu et al., 2007; Notaro et al., 2008), which is in good agreement with the paleore-construction work of deMenocal et al. (2000). Accompa-nying this ecosystem collapse is a gradual decline in annual precipitation (see Fig. 1b and c in Liu et al., 2006b; Fig. 2 in Notaro et al., 2008). If the vegetation had a strong pos-itive feedback on annual precipitation, we would expect a similar abrupt change in precipitation. This feature further confirms our finding of a negative interaction between veg-etation and precipitation in North African grasslands in the mid-Holocene.
To show the wetter mid-Holocene conditions in CCSM2 and FOAMLPJ, we obtain the output from two sets of control simulations in both climate models. Figure 3 plots the annual rainfall and top layer soil water content from the CCSM2 mid-Holocene and pre-industrial control runs (350-year av-erage). It is clear that the top soil is wetter in CCSM2 mid-Holocene run (Fig. 3f). This wetter soil corresponds to a higher rainfall in mid-Holocene than that in pre-industrial (Fig. 3e). Similarly, Fig. 4 shows the same variables for the FOAMLPJ mid-Holocene and pre-industrial control runs (400-year average). For both CCSM2 and FOAMLPJ, the wetter soil and higher rainfall conditions closely correspond to the negative feedback regions (Fig. 1c and g) in mid-Holocene. It is also interesting to note that the areas of wet-ter soil and higher rainfall are quite different in CCSM2 and FOAMLPJ. This could most likely explain the different lo-cations of negative feedback zones in Figs. 1 and 2.
However, when analyzing monthly feedback parameters, the two climate vegetation models show slightly different features (Fig. 5). With monthly FPAR (Fraction of Photosyn-thetically Active Radiation absorbed by vegetation canopy, an indication of greenness for vegetation) and monthly pre-cipitation from FOAMLPJ, we find that the feedback changes sign at different timescales. Notice, in preparation our time series for three-monthly and seasonal feedback analysis, we
Fig. 5. Area-averaged feedback parameters (18–23 N, 11–36 E for FOAMLPJ, 11–22 N, 11–36 E for CCSM2), calculated from monthly FPAR and atmospheric precipitation, when we bin indi-vidual monthly data into one-month, three-month, six-month, and twelve-month timeseries. Dashed line is for mid-Holocene snapshot run of FOAMLPJ and CCSM2. Solid line is for transient Holocene run from 6000 to 5500 years BP of FOAMLPJ.
combine the individual monthly data into the corresponding time series at three-month and six-month time intervals. At monthly to seasonal time scales, the vegetation (FPAR) has positive feedbacks to atmospheric precipitation at the same timescale, which is indicated by the positive interaction be-tween leaf phenology and precipitation. However, at semi-annual and semi-annual timescales, the feedback parameter be-comes negative. We speculate that this is partially caused by the interaction between top and lower layer soil water con-tents, their different persistent times, and effects on atmo-spheric precipitation. In early spring, a high FPAR in FOAM can induce large transpiration from deep soil water and hence greater precipitation for the following month when the top soil layer is still dry( Notaro et al., 2008). For CCSM2, this sign change feature is not obvious, although it shows a de-creasing trend of feedback with inde-creasing timescales as in FOAMLPJ. The less positive vegetation precipitation feed-back in North Africa in CCSM2 than in FOAM has also been found in Liu et al. (2006a). We speculate that this is caused by the different soil components in these two climate models as mentioned before.
66 Y. Wang et al.: Vegetation-precipitation feedback in mid-Holocene North Africa
4 Concluding remarks
We have presented three important findings with two fully-coupled atmosphere-ocean-land surface-vegetation climate model simulations in the mid-Holocene. First, a negative feedback between vegetation and precipitation mainly occurs in the mid-Holocene, when the overall climate and soil are wetter and darker than pre-industrial and present-day condi-tions. Second, the negative feedback is partially caused by the competition between ground evaporation and transpira-tion from vegetated surfaces. In the mid-Holocene, the first term has a stronger effect upon moisture fluxes than the sec-ond term, although we agree that this may be model depen-dent. Lastly, at monthly to seasonal timescales, the vegeta-tion precipitavegeta-tion feedback is still positive for FOAM. The feedback changes its sign from positive to negative when moving from monthly and seasonal to semi-annual and an-nual timescales. This sign change feature is not present in CCSM2, possibly due to different soil module components. However, both climate models have the same decreasing trend of feedback when timescales are increasing.
When the large-scale background climatic conditions change from wetter to drier from the mid-Holocene to pre-industrial and/or present-day, the negative feedback almost disappears. This confirms that the background climate is im-portant when studying vegetation climate interactions. The former theory of Charney et al. (1975, 1977), based on the large difference of surface albedos between vegetated and desert areas, may only apply to present-day conditions in North Africa because this albedo change is negligible in the mid-Holocene when the soil is wet and dark. Bare ground evaporation is also much weaker than transpiration in mod-ern times due to the dry soil condition. However, in the mid-Holocene, the bare ground evaporation becomes as impor-tant as transpiration. Furthermore, the previous understand-ing of interactions between vegetation and precipitation may not change at different timescales. As shown in this paper and a recent observational study (Wang et al., 2006), when moving to different timescales, these interactions could be both positive and negative.
Acknowledgements. This work has been supported by ESH/NSF. The CCSM2 and FOAMLPJ model simulations have been carried out at NCAR computation resources. We also would like to thank the two anonymous reviewers and H. Renssen whose input helped to improve the paper. This paper is CCR Contribution Number 922. Edited by: H. Renssen
References
Berger, A. L.: Long-term variations of daily insolation and Quater-nary climatic changes, J. Atmos. Sci., 35, 2362–2367, 1978. Brovkin, V.: Climate-vegetation interaction, J. Phys., 4, 57–72,
2002.
Charney, J. G., Stone, P. H., and Quirk, W. J.: Drought in Sahara-Biogeophysical feedback mechanism, Science, 187, 434–435, 1975.
Charney, J. G., Quirk, W. J., Chow, S.-H., and Kornfield, J.: A comparative study of the effects of albedo change on drought in semi-arid regions, J. Atmos. Sci., 34, 1366–1385, 1977. Claussen, M., Kubatzki, C., Brovkin, V., Ganopolski, A.,
Hoelz-mann, P., and Pachur, H. J.: Simulation of an abrupt change in Saharan vegetation in the mid-Holocene, Geophys. Res. Lett., 24(14), 2037–2040, 1999.
Claussen, M., Brovkin, V., Ganopolski, A., Kubatzki, C., and Petoukhov, V.: Climate change in northern Africa: The past is not the future, Clim. Change, 57(1), 99–118, 2003.
COHMAP Members: Climatic changes of the Last 18,000 years: observations and model simulations, Science, 241, 1043–1052, 1988.
Cramer, W., et al.: Global response of terrestrial ecosystem struc-ture and function to CO2and climate change: results from six
dynamic global vegetation models, Glob. Change Biol., 7, 357– 373, 2001.
Czaja, A., and Frankignoul, C.: Observed impact of Atlantic SST anomalies on the North Atlantic Oscillation, J. Climate, 15, 606– 623, 2002.
deMenocal, P., et al.: Abrupt onset and termination of the African Humid Period: Rapid climate response to gradual insolation forcing, Quat. Sci. Rev., 19, 341–361, 2000.
Dirmeyer, P. A.: Vegetation stress as a feedback mechanism in mid-latitude drought, J. Climate, 7(10), 1463–1483, 1994.
Doherty, R., Kutzbach, J. E., Foley, J. A., and Pollard, D.: Fully coupled climate/dynamical vegetation model simulations over northern Africa during the mid-Holocene, Clim. Dyn., 16, 561– 573, 2000.
Foley, J. A., Coe, M. T., Scheffer, M. and Wang, G. L.: Regime shifts in the Sahara and Sahel: Interactions between ecological and climatic systems in northern Africa, Ecosystems, 6, 524– 539, 2003.
Frankignoul, C., and Hasselmann, K.: Stochastic climate models. Part II: Application to sea surface temperature anomalies and thermocline variability, Tellus, 29, 289–305, 1977.
Frankignoul, C., Czaja, A., and Heveder, B. L.: Air-sea feedback in the North Atlantic and surface boundary conditions for ocean models, J. Climate, 11, 2310–2324, 1998.
Gallimore, R., Jacob, R., and Kutzbach, J. E.: Coupled atmosphere-ocean-vegetation simulations for modern and mid-Holocene cli-mates: role of extratropical vegetation cover feedbacks, Clim. Dyn., 25, 755–776, doi:10.1007/s00382-005-0054-z, 2005. Ganopolski, A., Kubatzki, C., Claussen, M., Brovkin, V., and
Petoukhov, V.: The influence of vegetation-atmosphere-ocean interaction on climate during the Mid-Holocene, Science, 280, 1916–1919, 1998.
Gasse, F.: Hydrological changes in the African tropics since the Last Glacial Maximum, Quat. Sci. Rev., 19, 189-211, 2000. Gasse, F.: Diatom-inferred salinity and carbonate oxygen
iso-topes in Holocene waterbodies of the western Sahara and Sahel (Africa), Quat. Sci. Rev., 21, 737–767, 2002.
Global Soil Data Task. 2000. Global Soil Data Products CD-ROM (IGBP-DIS). CD-ROM. International Geosphere-Biosphere Pro-gramme, Data and Information System, Potsdam, Germany (available online at http://www.daac.ornl.gov), 2000.
Y. Wang et al.: Vegetation-precipitation feedback in mid-Holocene North Africa 67
Harrison, S. P., Kutzbach, J. E., Liu, Z. Bartlein, P. J., Otto-Bliesner, B., Muhs, D., Prentice, I. C., Thompson, R.: Mid-Holocene cli-mates of the Americas: a dynamical response to changed season-ality, Clim. Dyn., 20, 663–688, 2003.
Holland, M.: The North Atlantic Oscillation-Arctic Oscillation in the CCSM2 and its influence on arctic climate variability, J. Cli-mate, 16, 2767–2781, 2003.
Kutzbach, J. E.: Monsoon climate of the Early Holocene: Climate experiment with the Earth’s orbital parameters for 9000 years ago, Science, 214, 59–61, 1981.
Kutzbach, J. E., Bonan, G., Foley, J., and Harrison, S. P.: Vegeta-tion and soil feedbacks on the response of the African monsoon to orbital forcing in the early to middle Holocene, Nature, 384, 623–626, 1996.
Levis, S., Bonan, G., and Bonfils, C.: Soil feedback drives the mid-Holocene North African monsoon northward in fully coupled CCSM2 simulaitons with a dynamic vegetation model, Clim. Dyn., 23, 791–802, doi:10:1007/s00382-004-0477-y, 2004. Levis, S., Bonan, G., Vertenstein M., and Oleson, K. W.: The
Com-munity Land Model’s dynamic global vegetation model (CLM-DGVM): Technical description and user’s guide. NCAR Techni-cal Note, NCAR/TN-459+IA, 2004.
Liu, Z., Notaro, M., Kutzbach, J. E., and Liu, N.: Assessing global vegetation-climate feedbacks from observations, J. Climate, 19, 787–814, 2006a.
Liu, Z., Wang, Y., Gallimore, R., Notaro, M., and Prentice, I. C.: On the cause of abrupt vegetation collapse in north africa during the Holocene: Climate variability vs. vegetation feedback, Geophys. Res. Lett., 33, L22, 709, doi:10.1029/2006GL028062, 2006b. Liu, Z., Wang, Y., et al.: Simulating the transient evolution and
abrupt channge of Northern Africa atmosphere-ocean-terrestrial ecosystem in the Holocene, Quaternary Science Reviews, 26, 1818–1837, 2007.
Notaro, M., Liu, Z., Gallimore, R., Vavrus, S. J., Kutzbach, J. E., Prentice, I. C., and Jacob, R. L.: Simulated and observed prein-dustrial to modern vegetation and climate changes, J. Climate, 18, 3650–3671, 2005.
Notaro, M., Liu, Z., and Williams, J. W.: Observed vegetation-climate feedbacks in the United States, J. Climate, 19, 763–786, 2006.
Notaro, M., Wang, Y., Liu, Z., Gallimore, R., and Levis, S.: Combined statistical and dynamical assessment of sim-ulated vegetation-rainfall interactions in North African dur-ing the Mid-Holocene, Global Change Biology, 14, 347–368, doi:10.1111/j.1365-2486.2007.01495.x, 2008.
Oleson, K. W., et al.: Technical Description of the Commu-nity Land Model (CLM). NCAR technical note, NCAR/TN-461+STR, 2004.
Pielke, R., et al.: Interactions between the atmosphere and terrestrial ecosystems: Influence on weather and climate, Glob. Change Biol., 4, 461–475, 1998.
Prentice, I. C., and Webb, T.: BIOME 6000: reconstructing global mid-Holocene vegetation patterns from palaeoecological records, J. Biogeogr., 25, 997–1005, 1998.
Ruddiman, W. F.: Earth’s Climate: Past and Future, W. H. Freeman and Company, New York, NY 10010, USA, 2001.
Schlesinger, W. H., et al.: Biological feedbacks in global desertifi-cation, Science, 247(4946), 1043–1048, 1990.
Sellers, P. J., et al.: Modeling the exchanges of energy, water, and carbon between continents and the atmosphere, Science, 275, 502–509, 1997.
Sitch, S., et al.: Evaluation of ecosystem dynamics, plant ge-ography and terrestrial carbon cycling in the LPJ Dynamic Global Vegetation Model, Global Change Biology, 9, 161–185, doi:10.1046/j.1365-2486.2003.00569.x, 2003.
Small, E. E., and Kurc, S.: The influence of soil moisture on the surface energy balance in semiarid environments, New Mexico Water Resource Research Institute Technical Completion Report, No. 318, 2001.
Thompson, S. L., and Pollard, D.: Greenland and antarctic mass balances for present and doubled atmospheric CO2 from the
GENESIS version 2 global climate model, J. Climate, 10, 871– 900, 1997.
Wang, W., et al.: Feedbacks of vegetation on summertime climate veriability over the North American Grasslands. Part I: Statisti-cal Analysis, Earth Interactions, 10, 1–27, doi:10.1175/EI196.1, 2006.
Wang, Y., Mysak, L. A., Wang, Z., and Brovkin, V.: The Green-ing of the McGill Paleoclimate Model. Part II: Simulation of Holocene Millennial-Scale Natural Climate Changes, Clim. Dyn., 24(5), 481–496, doi:10.1007/s00382-004-0516-8, 2005a. Wang, Y., Mysak, L. A., and Roulet, N. T.: (2005b), Holocene
cli-mate and carbon cycle dynamics: Experiments with the ”green” McGill Paleoclimate Model, Global Biogeochemical Cycles, 19, GB3022, doi:10.1029/2005GB002484, 2005b.
Wang, Y. and Mysak, L. A.: Response of the ocean, cli-mate and terrestrial carbon to Holocene freshwater discharge after 8 kyr BP, Geophysical Research Letters, 32, L15705, doi:10.1029/2005GL023344, 2005.
Woodward, F. I., Lomas, M. R., and Betts, R. A.: Vegetation-climate feedbacks in a greenhouse world., Philosophical Trans-actions of the Royal Society of London Series B, 353, 29–38, 1998.
Zeng, X., Shaikh, M., Dai, Y., Dickinson, R.E., and Mineni, R.: Coupling of the common land model to the NCAR community climate model, J. Climate, 15, 1832–1854, 2002.