HAL Id: hal-02468662
https://hal.archives-ouvertes.fr/hal-02468662
Submitted on 21 Jun 2021
HAL is a multi-disciplinary open access
archive for the deposit and dissemination of
sci-entific research documents, whether they are
pub-lished or not. The documents may come from
teaching and research institutions in France or
abroad, or from public or private research centers.
L’archive ouverte pluridisciplinaire HAL, est
destinée au dépôt et à la diffusion de documents
scientifiques de niveau recherche, publiés ou non,
émanant des établissements d’enseignement et de
recherche français ou étrangers, des laboratoires
publics ou privés.
Stable oxygen isotope evidence for mobility in medieval
and post-medieval Trondheim, Norway
Stian Suppersberger Hamre, Valérie Daux
To cite this version:
Stian Suppersberger Hamre, Valérie Daux. Stable oxygen isotope evidence for mobility in medieval
and post-medieval Trondheim, Norway. Journal of Archaeological Science: Reports, Elsevier, 2016, 8,
pp.416-425. �10.1016/j.jasrep.2016.06.046�. �hal-02468662�
Stable oxygen isotope evidence for mobility in medieval and
post-medieval Trondheim, Norway
Stian Suppersberger Hamre
a,⁎
, Valérie Daux
b aDepartment of Archaeology, History, Cultural Studies and Religion, University of Bergen, Post Box 7805, 5020 Bergen, Norway
bLaboratoire des Sciences du Climat et de l'Environnement, UMR CNRS/CEA/UVSQ/IPSL, 91191 Gif-sur-Yvette Cedex, France
a b s t r a c t
a r t i c l e i n f o
Article history: Received 1 April 2016
Received in revised form 15 June 2016 Accepted 27 June 2016
Immigration and mobility in the medieval and post-medieval periods in Norway have, up until now, mainly been discussed on the basis of historical sources. This paper presents the results of stable oxygen isotope (δ18O)
anal-yses of the 1st and 3rd molars from 95 individuals from medieval and post-medieval Trondheim, as well as new information about theδ18O composition in the precipitation and drinking water in Trondheim. Through these
analyses, the authors have attempted to shed light on the age of migrating individuals and directions of migra-tion, to investigate temporal changes with regard to migramigra-tion, and to make suggestions regarding the proportion of immigrants to locals in the population.
The results show that the majority of the immigrants came from areas to the north or east of Trondheim, and some travelled at least 800–1000 km to come to Trondheim. It has also been shown that a large proportion of the medieval individuals moved during childhood. Both with regard to child mobility and migration in general, the evidence suggests that the migratory activity decreased from the medieval to the post-medieval period.
© 2016 The Authors. Published by Elsevier Ltd. This is an open access article under the CC BY-NC-ND license (http://creativecommons.org/licenses/by-nc-nd/4.0/).
Keywords:
Stable oxygen isotope analysis Immigration
Mobility Medieval Medieval Norway Trondheim
Human skeletal material Patterns of migration Child migration Archaeology
1. Introduction
Questions regarding immigration and mobility in medieval and early post-medieval Norway have received little academic attention. Re-search into pre-modern immigration in Norway has been carried out mainly by historians and has been based largely on historical sources (Opsahl, 2007; Opsahl and Sogner, 2003), while other sources of infor-mation that could contribute to the development of a more detailed pic-ture of the pre-modern population have been largely ignored. The historical sources present a picture of a country with immigration as an integral part of its development, but studies of the actual people of the time have the potential to develop a much more detailed picture of the population. Against this background, this study set out to improve the understanding of immigration and mobility in medieval and post-medieval Norway. To do so, the study focused on one of the largest and most important towns in Norwegian history, Trondheim, where a large population study was undertaken. Stable oxygen isotope analyses of enamel apatite carbonates were used to determine possible geo-graphic origins and mobility of 95 skeletonised individuals. This study primarily attempts to investigate to what extent people were born
and grew up in the town where they ended their lives, and to identify people who were born elsewhere and moved there. Having determined who was not born in Trondheim, it was also investigated where the peo-ple who moved to Trondheim came from and whether they moved as adults or during childhood.
Trondheim was amongst the largest and most important towns in Norway from medieval times to the present and it was the main royal residence from the beginning of the 10th to the beginning of the 13th century. From 1030, Trondheim was the most important pilgrimage destination in Scandinavia and maintained its popularity throughout the Middle Ages, until the Reformation in 1537. The reason for this pop-ularity was that king Olav II Haraldsson was buried there after he was killed during the battle at Stiklestad in 1030. He was canonised already in 1031 and a wooden chapel was built above his burial site. In 1070, King Olav Kyrre removed the wooden chapel and started building the stone church that was the beginning of what would later be known as the Nidaros Cathedral. The Cathedral wasfinished around 1300. The Archdiocese of Nidaros was founded in 1152/53 with Trondheim as the archbishop's seat and the town became the ecclesiastical“capital” of the Norse world until the Reformation (Moseng et al., 2007).
Trondheim was chosen for this study for several reasons. Firstly, there are no other Norwegian towns with better preserved and/or bet-ter documented skeletal mabet-terial. Secondly, due to Trondheim's posi-tion as both an archbishop's residence and a pilgrimage destinaposi-tion,
⁎ Corresponding author.
E-mail addresses:[email protected](S.S. Hamre),[email protected]
(V. Daux).
http://dx.doi.org/10.1016/j.jasrep.2016.06.046
2352-409X/© 2016 The Authors. Published by Elsevier Ltd. This is an open access article under the CC BY-NC-ND license (http://creativecommons.org/licenses/by-nc-nd/4.0/).
Contents lists available atScienceDirect
Journal of Archaeological Science: Reports
j o u r n a l h o m e p a g e :w w w . e l s e v i e r . c o m / l o c a t e / j a s r e pone could expect people to have travelled from far afield to visit the town during the Middle Ages - travellers who likely would have made an impact on the composition of the town's population. Thirdly, Trond-heim was an important port along the trade route for driedfish from northern Norway down to Bergen, and further on into more southern areas of Europe. Trade continued to be important in Trondheim even after Bergen obtained a near monopoly as a port for exporting dried fish in the Middle Ages. As both an ecclesiastical and royal administra-tive centre, both local trade and regional trade were important (Helle, 2006). Lastly, Trondheim has been one of the most important Norwe-gian towns during the last thousand years, which makes it interesting in itself.
To investigate the above questions, stable oxygen isotope analysis was applied. Mammalian bones and teeth contain hydroxyapatite (Ca4.5[(PO4)2.7(HPO4)0.2(CO3)0.3](OH)0.5) (Kohn et al., 1999). Because
humans, like all large mammals (N1 kg), have an almost constant body temperature, the oxygen isotope compositions of the carbonate (δ18O
C) and phosphate (δ18OP) components of their hydroxyapatite
only vary with that of oxygenfluxes (Longinelli, 1984; Bryant and Froelich, 1995; Kohn, 1996). The main input of oxygen is liquid water (~75%;Bryant and Froelich, 1995; Daux et al., 2008), which generally comes from local reservoirs (wells, springs, creeks, rivers), in turn de-rived from meteoric waters (e.g.Rozanski, 1985; Fritz et al., 1987; Ingraham and Taylor, 1991; Kortelainen and Karhu, 2004).
The isotopic fractionations in hydroxyapatite formation, which take place during the metabolic reactions resulting from water ingestion, are well understood, and the oxygen isotopic composition of local water can be estimated by applying water-to-phosphate (Longinelli, 1984; Luz et al., 1984; Levinson et al., 1987; Daux et al., 2008) or water-to-carbonate conversion equations (Chenery et al., 2012) to measured δ18O
Pandδ18OC. Therefore, measurements ofδ18OCorδ18OPin teeth
and bones have been widely used for assessing the origin and move-ments of humans (e.g.White and Spence, 1998; Dupras and Schwarcz, 2001; Budd et al., 2004; Müller et al., 2003; Evans et al., 2006a; Evans et al., 2006b; Prowse et al., 2007).
2. Material and methods
The material for this study consists offirst and third molars (M1 and M3) from human skeletal remains exhumed from five different
archaeological excavations in the town centre of Trondheim, Norway (Søndregate, Folkebibliotekstomten, Vår frue kirke, Vestfrontplassen and Servicebygget) (Fig. 1) and of four modern contemporaneous M3 teeth collected by a dentist in Trondheim. A total of 95 individuals have been sampled from the archaeological sites, of which 41 date back to the medieval period, while the remaining 54 were buried be-tween approximately 1600 and the 1890s. The material was selected with the idea of having an equal number of individuals from the medi-eval and post-medimedi-eval periods, as well as an equal number of males and females within each group. As always, however, preservation sets its own limits for good intentions, and thefinal sample used in this study consists of 41 medieval skeletons of which 16 were male, 24 were female and 1 of undetermined sex, while the post-medieval sam-ple consists of 54 individuals: 37 males, 13 females and 4 of undeter-mined sex.
2.1. Oxygen isotopic composition of environmental water (δ18O W) in
Trondheim and in the surrounding regions
Since the isotopic composition of tooth enamel carbonate derives from environmental water, this study focuses on identifying both spatial (Central Norway and surrounding areas) and temporal (from medieval times to present) variation.
The oxygen isotopic composition in precipitation in Norway is not very well established, and except for the GNIP (Global Networks of Iso-topes in Precipitation) station at Lista on the south coast, there is no available data for mainland Norway. The only available information for Trondheim comes from different modulations (GNIP,isomap.org and OIPC). Modulations will, however, never be as accurate as local water analyses. Moreover, local measured waters should be preferred to estimations for calibrating the present day value of enamelδ18O
(Daux et al., 2008).
Thus, a precipitation collector was set up outside the premises of the NGU (Norges Geologiske Undersøkelser), at about three kilometres from the medieval graveyards located in the centre of Trondheim, and about four kilometres from the post-medieval graveyards. The distance from the archaeological sites to the ocean is about the same as the dis-tance from the NGU to the ocean, and all of them are at the same ap-proximate elevation, so there is every reason to believe that the precipitation samples collected at the NGU are representative of the
Fig. 1. Maps showing Norway with the location of Trondheim (left), the municipality of Trondheim with Lake Jonsvatnet (right), and the town centre of Trondheim with thefive archae-ological sites providing the skeletal material for this study (front): 1. Vestfrontplassen (1585–1897); 2. Servicebygget (1585–1897); 3. Vår Frue Kirke (16th–mid-19th century); 4. Søndregate (mid-12th century–1531); 5. Folkebibliotekstomten (1175–1275).
town centre where the individuals in this study were buried and may have lived. To minimise evaporation, a funnel shaped collector was used, and to maximise consistency, the samples were collected on the last day of each month, from January to December 2013. The water sam-ples were then stored in a fridge, in light-proof and air-tight 100 ml bot-tles until they were shipped to the GNS Science laboratory (Wellington, New Zealand). To avoid prolonged storage, the samples were sent in two batches, thefirst after six months and the second at the end of the twelve months. Theδ18
O ratios were determined on a GVI AquaPrep attached to a GVI IsoPrime mass spectrometer by the equilibration method. 400μl of water were equilibrated with 3 ml of headspace flushed with CO2for 24 h at 25.5 °C. The CO2was extracted and analysed
by dual inlet on the IsoPrime. All oxygen results are reported with re-spect to SMOW (Standard Mean Ocean Water), normalised to internal standards (Table 1). The external reproducibility of oxygen isotope measurements is close to 0.1‰.
Until the late 1960s, different parts of Trondheim received drinking water from different local sources (Brohan et al., 2006). Today the peo-ple in the city and suburban areas all get their drinking water from one single source, Lake Jonsvatnet. This lake is at an elevation of 150 m. It drains water from the surrounding mountains, which culminate at about 500 m. The residence time of water in the lake is about 10 years (Bjørgum and Broch, 1996). Two tap water samples were collected from Trondheim, in October 2014 and September 2015, and analysed at the Laboratoire des Sciences du Climat et de l'Environnement (Gif-sur-Yvette, France) with a Picarro MODELE with a precision of ±0.2‰ (1σ).
2.2. Air temperature-δ18O
Wandδ18OC-δ18OWrelations
The oxygen isotopic compositions of environmental waters (which derive from precipitation) depend on temperature, amount of precipita-tion and air mass trajectory. For mid-latitudes, rough linear correlaprecipita-tions are observed between theδ18
OWof meteoric waters and air
tempera-ture. Several relationships have been established (e.g.Dansgaard, 1964; Yurtsever and Gat, 1981; Rozanski et al., 1992; Rozanski et al., 1993; Fricke and O'Neil, 1999).Dansgaard's (1964)equation, which was obtained from North Atlantic stations, has been used hereafter for traducing temperature inδ18O
W(δ18OW= 0.695 × T− 13.6, where T
is the air temperature in °C).
The Eq. (6) fromDaux et al. (2008)modified byChenery et al. (2012) was used to convertδ18O
Cinδ18OW(δ18OW= 1.59 ×δ18OC− 48.63).
Application of this conversion leads to a model uncertainty of ±1.0‰ (2σ) according toChenery et al. (2012).
2.3. Determination ofδ18O in human remains
2.3.1. Three point life history
To discover possible migration of the individuals during their life time, the sampling was carried out so as to document different times of their life. As long as both teeth were preserved, samples were taken from tooth enamel on afirst and a third molar for each individual. These teeth represent two points in life and the burial place is known for every individual, which is the third point in the life history of these people. The crown development of thefirst molar begins at around birth and is completed by the time an individual reaches 2.5–3 years. The third molar is the last tooth to be developed; the crown starts devel-oping between 7 and 10 years and is normally completed between 12 and 16 years old (Hillson, 1996:123,Schour and Massler, 1940a; Schour and Massler, 1940b). Thus, thefirst molar will represent the pe-riod between the 1st and 3rd year of life while the third molar samples will represent an age between ~8 and 14 years of age. As they were bur-ied in Trondheim it is reasonable to assume that this is where they dbur-ied and spent the last period of their lives.
2.3.2. Breastfeeding effect
Since the age at the end of weaning in modern or ancient non-industrialized human societies was typically around 2–2.5 years (e.g. Shahar, 1990; Richards et al., 2002; White et al., 2004; Sellen, 2001), the M1 and M3 teeth collected at Trondheim were likely formed respec-tively during and after the breastfeeding period. Human milk contains about 87% water (Jenness, 1999), and is isotopically heavier than envi-ronmental water (Roberts et al., 1988). Weaning is a gradual process. Breast-fed children generally do not have other sources of water than their mother's milk at the beginning of their life. Fresh water and solid food are progressively incorporated in the diet until the end of weaning. Theδ18O values of teeth enamel are set by equilibrium fractionation
with the bodyfluids, which themselves derive from the water ingested. Therefore, the M1 teeth can record the effect of milk consumption (as the milk water is heavier than the environmental water), whereas the M3 teeth compositions may reflect the ingestion of environmental water solely. In agreement with this statement, in archaeological re-mains, M1 teeth are generally isotopically heavier than M3 (byb1‰; Evans et al., 2006b; White et al., 2005; Wright and Schwarcz, 1999; Wright and Schwarcz, 1998). In the interpretation of the enamelδ18O
of the M1 and M3 teeth collected in Trondheim, possible breastfeeding effects are to be taken into account.
2.3.3. Analyses
As there is a consistent offset between the oxygen isotopic composi-tion of the carbonate and phosphate components of enamel hydroxyap-atite, both components are suitable for oxygen analysis. Most studies of human oxygen isotope compositions have focused on phosphates, which are less susceptible to isotopic exchange. However, the oxygen signal was also shown to be well preserved in the carbonate component of archaeological human tooth enamel (Chenery et al., 2011) Here we chose to analyseδ18O
Crather thanδ18OP.
One hundred milligrams of enamel was obtained from each M1 and M3 using a Dremel 8100 multi tool with a circular blade which was changed between each sample. A piece of the enamel was cut off the crown and care was taken to keep the enamel sample in one piece, which was wrapped in tin foil and sealed in separate containers sent to the laboratory for preparation and analysis. Each sample was taken as a slice from the side of the tooth; no samples were taken from the oc-clusal surface.
The enamel was sonicated and ground to afine powder. An aliquot was weighted out and kept in a 120 °C oven for 24 h. The oxygen isoto-pic analyses were performed at the GNS Science's stable Isotope Labora-tory. No pre-treatment of the enamel was carried out. CO2was obtained
by acid hydrolysis using phosphoric acid at 50 °C and collected by cryo-genic distillation. Isotopic ratios were measured on a dual inlet ratio GVI
Table 1 δ18
OWin monthly precipitation in Trondheim, precipitation amount and mean
tempera-ture at Voll meteorological station, 3 km south-east of Trondheim (Norwegian Meteoro-logical Institute data) in 2013. Theδ18
OWvalue for January is an estimate (average of
December and February values). Month δ18
OW/VSMOV2 (‰) Precipitation (mm) Mean temperature (°C)
January −10.72 42.3 −3.8 February −10.79 44.4 −2.6 March −9.73 91.8 −2.7 April −8.10 37.1 3.6 May −7.68 40.8 11.9 June −7.27 100.1 12.5 July −6.85 78.1 14.2 August −8.62 85.8 13.8 September −8.89 58.3 11.0 October −9.14 88.2 5.9 November −8.08 116.5 2.5 December −10.64 84.1 2.5 Yearly mean −8.77a a
Isoprime mass spectrometer. One must note that our data may not be fully comparable to values measured on enamel samples which have been subjected to pre-treatments intended to remove any secondary carbonates (Koch et al., 1997; Grimes and Pellegrini, 2013).
All results are reported as per mil (‰) normalised to the PDB scale using an in-house carbonate reference material (GNS Marble; reported value of−6.4‰ for δ18O) calibrated against NBS19 certified reference
material. The external precision for these measurements are better than 0.2‰.
The values were then converted into the SMOW scale usingCoplen's (1988)equation (δ18
OC/SMOW= 1.03091 ×δ18OC/PDB+ 30.91).
2.4. Sampling sites 2.4.1. Folkebibliotekstomten
Twenty seven individuals come from this graveyard. It has tradition-ally been believed that the church at this site was the church of St. Olav, but this has been challenged (Christophersen, 1994; Nordeide, 1997) and at present there is no agreement as to the name of this church. What is known, however, is that this church dates back to the early 12th century and that it became part of the Franciscan monastery in the late 13th century (Christophersen, 1994). From this it can be as-sumed that this was not a monastic church before this point and that
during the period dealt with in this project it is likely to have been a par-ish church. A parpar-ish church graveyard, as opposed to graveyards belong-ing to cathedrals and monasteries, would have accepted burials from all layers and fractions of the population within the parish and, thus it can be argued that people buried here would have been representative of the general public. It may not, however, be representative of the town population as a whole due to differences that may exist between popu-lations belonging to different churches. The inclusion of individuals from different graveyards, whenever possible, would increase the likeli-hood of putting together a representative sample and should be recommended.
Anderson and Göthberg (1986)also concluded that this was a parish church based on the age composition in the sample. Thus, there is no reason to assume that the people buried in this cemetery are not repre-sentative of the general population in the parish, and possibly also Trondheim at the time. However, considering the distribution of these 27 skeletons in the graveyard, one could suggest that this sample may be largely void of the most affluent members of society. It has been shown that an individual's placement in the graveyard was determined by the person's social status; the upper classes being buried close to the church while members of the lower classes were buried closer to the graveyard fence (Hamre, 2011). Only 4 of the 27 individuals in this sam-ple were buried in relatively close proximity to the church, while those
Fig. 3. Difference between theδ18
OCof the M1 adjusted for weaning (with offsets ranging from 0.2‰ to 1‰) and the δ18OCof the M3 of the individuals excavated at Trondheim. The shaded
area corresponds to ±0.6‰ accepted range of variation, that is, to individuals who have likely not migrated during childhood. The red bars correspond to the individuals who may have migrated during childhood. SG: Søndregate; FBT: Folkebibliotekstomten; VFK: Vår frue kirke; VFP: Vestfrontplassen; SB: Servicebygget.
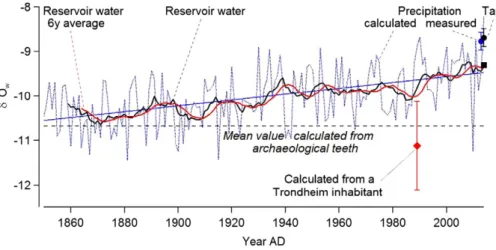
Fig. 2. Oxygen isotopic composition of water. Blue dotted and straight lines: precipitation composition calculated from yearly temperature usingDansgaard's (1964)equation and trend. Black line: reservoir composition calculated by averaging the precipitation over 10 years, time of residence of the water in the reservoir. Red line: reservoir water average over 6 years, the time of mineralisation of the M3 teeth. Black square: present-day calculated value of the reservoir water. Blue circle: mean value of yearly weighted precipitation sampled along 2013. Black circle: Tap water collected in 2014 and 2015 in Trondheim. Black dotted line: Mean value of theδ18
OCof the archaeological teeth converted toδ18OWusingChenery et al.'s
(2012)equation. Red diamond:δ18
OCof the M3 tooth of an inhabitant of Trondheim converted inδ18OWrepresenting the mean tap water composition over ~1975–1989. The error
remaining were buried in the middle and outer parts of the graveyard. Therefore, it is unlikely that high status individuals are a significant part of this sample.
All the individuals included from this excavation used in the study have been determined to have been buried between 1175 and 1275 (Christophersen and Nordeide, 1994).
2.4.2. Søndregate
The church ruins and parts of the cemetery excavated at Søndregate are believed to be the remnants of the church of St. Olav, which was in use from the middle of the 12th century (Ramstad, 2002:100) until it burned down during the 16th century, most likely in afire in 1531 (Ramstad, 2002:202). The exact use of the church during thefirst part of its existence is somewhat uncertain, but it became a parish church around the middle of the 13th century, which makes it reasonable to as-sume that this church was accessible to the general public, at least dur-ing most of the time it was in use. Thirteen individuals from this excavation were included in this study.
2.4.3. Vår frue kirke
The material from this site only consists of four individuals, all of which can be dated to the post-medieval period (Ian Reed, pers. com.). No accurate dating exists for these skeletons, but a time of burial between the 16th century and the mid-19th century is likely, based on these burials' stratigraphic relation to known expansions of the church. During this period, Vår Frue Kirke was the main church in Trondheim and on the basis of this, one could suggest that the individuals buried here came from the more affluent layers of society. Most of the inhuma-tions excavated from this site were coffin burials and many had wrought iron handles which also suggests wealth (Ian Reed, pers. com.). 2.4.4. Vestfrontplassen
Twenty-two individuals come from the excavations at Vestfrontplassen which is part of the graveyard connected to the Nidaros Cathedral. This part of the graveyard was in use from 1585, when the cathedral became a parish church, until the closure of the graveyard in 1897 (Reed et al., 1998). This part of the graveyard seems to have had a very particular use. In 1663, an attempt was made to create social order within the graveyard by dividing it into dif-ferent price zones and it is stated that cavalry and soldiers who died within the parish could be buried free of charge in an area matching the Vestfrontplassen excavation (Reed et al., 1998). Thus, the individ-uals exhumed from this area may not be representative of the general population but rather of a military population. This is also one of the least prestigious areas of the graveyard. Therefore, people buried here without a connection to the military are likely to have come from the lower layers of society.
2.4.5. Servicebygget
Twenty-eight skeletons come from this excavation. It uncovered an-other part of the graveyard of Nidaros Cathedral and the individuals ex-humed during this excavation would have been buried during the same approximate period as skeletons excavated at Vestfrontplassen. This area of the graveyard was, however, not used particularly for members of the military. Similarly to Vestfrontplassen, the area uncovered during the Servicebygget excavation was also among the cheapest zones of the graveyard and one has to expect that the people buried here would have come from the lower strata of society (Yilmaz and Sellevold, 2006).
Fig. 5. Deviation of theδ18O
Wfrom−9‰ (the yearly weighted precipitation in Trondheim
in 2013 = ~−8.8‰; the mean temperature in 2004–2014 converted to δ18
OW= ~
−9.3‰) based on a compilation by C. Chenery. British Geological Survey (based on
Darling et al. (2003)andLecolle (1985)).
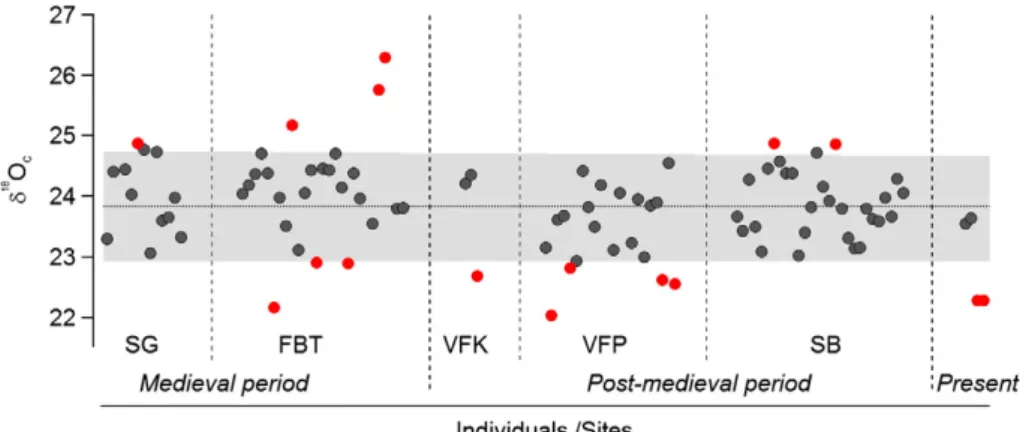
Fig. 4. Oxygen isotopic composition of the M3 teeth of the individuals excavated at Trondheim (column 6,Table 2). The shaded area corresponds to an intra-populational variability of 0.9‰. The red dots correspond to the individuals who may have migrated to Trondheim after the age of 14 years old. SG: Søndregate; FBT: Folkebibliotekstomten; VFK: Vår frue kirke; VFP: Vestfrontplassen; SB: Servicebygget.
Table 2
Oxygen isotopic composition of the carbonate offirst and third molars (M1 and M3 resp.) tooth enamel of human beings buried in Trondheim, Norway (δ18O
C, in‰ versus VSMOW;
col-umns 5 and 6) at Søndregate (SG), Folkebibliotekstomten (FBT), Vår Frue Kirke (VFK), Vestfrontplassen (VFP), Servicebygget (SB). Environmental water derived from the M3 teeth isotopic composition (δ18
OW; calculated usingChenery et al.'s (2012)equation and expressed in‰ versus VSMOW; column 7).
Migrations: Symbols in Migr. child and Migr. adult columns (8 and 9) designate individuals whose M1 and/or M3 isotopic compositions are consistent with migration during childhood and adulthood respectively;Δ/∇: immigration induces an increase/decrease of the δ18
OWof the imbibed water.
Δ δ18
OWchild: gradient of isotopic composition of environment water crossed between childhood and teenage (between ~3 and ~14) by migrants. The two values correspond to the
in-clusion of uncertainties regarding the effect of breastfeeding on the isotopic composition of the M1 teeth in the calculation. Δ δ18O
Wadult: gradient of isotopic composition of environment water crossed during adulthood by migrants.
1 2 3 4 5 6 7 8 9 10 11
Site Age of burial Sex Age at death M1 δ18 OC M3 δ18 OC M3 δ18 OW Migr. child Δ δ18
OWchild Migr. adult Δ δ18OWadult
SG ~1150–1531 M 18–30 23.57 23.31 −11.57 SG ~1150–1531 F 30–50 24.38 24.41 −9.82 SG ~1150–1531 ? 12–18 24.29 SG ~1150–1531 M 30–50 24.46 −9.74 SG ~1150–1531 M 50+ 24.04 −10.41 SG ~1150–1531 F 30–50 24.01 24.88 −9.07 Δ 1.7–3.0 ∇ −1.7 SG ~1150–1531 M 18–30 25.36 24.78 −9.23 SG ~1150–1531 M 12–18 23.96 23.07 −11.95 SG ~1150–1531 F 30–50 24.76 24.74 −9.30 SG ~1150–1531 F 30–50 23.61 −11.09 SG ~1150–1531 M 30–50 23.66 −11.01 SG ~1150–1531 M 50+ 23.99 −10.49 SG ~1150–1531 M 50+ 23.33 −11.54 FBT 1175–1275 M 18–30 24.38 24.05 −10.39 FBT 1175–1275 F 18–30 24.76 24.19 −10.17 FBT 1175–1275 F 30–50 23.51 24.38 −9.87 Δ 1.7–3.0 FBT 1175–1275 F 18–30 21.13 24.72 −9.33 Δ 6.0–7.3 FBT 1175–1275 F 18–30 23.87 24.39 −9.85 Δ 1.2–2.4 FBT 1175–1275 F 30–50 22.51 22.17 −13.38 Δ 2.7 FBT 1175–1275 F 18–30 23.51 23.98 −10.51 Δ 1.1–2.3 FBT 1175–1275 F 18–30 22.46 23.52 −11.24 Δ 2.0–3.3 FBT 1175–1275 F 18–30 23.71 25.18 −8.60 Δ 2.7–4.0 ∇ −2.2 FBT 1175–1275 M 18–30 24.02 23.13 −11.86 FBT 1175–1275 F 18–30 23.05 24.07 −10.36 Δ 2.0–3.2 FBT 1175–1275 F 18–30 24.42 24.44 −9.77 FBT 1175–1275 F 30–50 22.92 −12.19 FBT 1175–1275 M 30–50 24.78 24.47 −9.73 FBT 1175–1275 M 18–30 23.73 24.44 −9.77 Δ 1.4–2.7 FBT 1175–1275 F 18–30 25.02 24.72 −9.33 FBT 1175–1275 F 30–50 23.21 24.15 −10.24 Δ 1.8–3.1 FBT 1175–1275 F 30–50 22.91 −12.21 FBT 1175–1275 M 30–50 20.38 24.39 −9.85 Δ 6.7–8.0 FBT 1175–1275 M 30–50 23.88 23.97 −10.52 FBT 1175–1275 F 18–30 23.81 FBT 1175–1275 F 30–50 21.66 23.55 −11.19 Δ 3.3–4.6 FBT 1175–1275 F 18–30 24.97 25.77 −7.66 Δ 1.6–2.9 ∇ −3.1 FBT 1175–1275 F 18–30 26.14 26.30 −6.82 ∇ −4.0 FBT 1175–1275 M 30–50 23.24 FBT 1175–1275 F 30–50 23.92 23.81 −10.78 FBT 1175–1275 M 30–50 23.39 23.82 −10.76 Δ 1.0–2.3 VFK ~1500–~1850 F 30–50 24.22 −10.12 VFK ~1500–~1850 M 50+ 24.57 24.36 −9.90 VFK ~1500–~1850 F 30–50 22.69 −12.55 Δ 1.8 VFK ~1500–~1850 F 12–18 24.93 VFP 1585–1897 M 30–50 23.99 23.17 −11.79 VFP 1585–1897 M 50+ 22.04 −13.59 Δ 2.9 VFP 1585–1897 M 18–30 24.11 23.62 −11.08 VFP 1585–1897 M 30–50 22.77 23.69 −10.97 Δ 1.8–3.1 VFP 1585–1897 ? 30–50 23.02 22.83 −12.33 Δ 1.6 VFP 1585–1897 M 30–50 23.01 22.95 −12.14 VFP 1585–1897 M 30–50 24.94 24.43 −9.79 VFP 1585–1897 F 30–50 24.15 23.83 −10.74 VFP 1585–1897 M 50+ 24.17 23.50 −11.27 VFP 1585–1897 M 30–50 24.79 24.20 −10.16 VFP 1585–1897 M 30–50 24.12 VFP 1585–1897 M 18–30 24.56 23.13 −11.86 VFP 1585–1897 M 30–50 24.02 24.06 −10.38 VFP 1585–1897 F 30–50 23.00 VFP 1585–1897 F 18–30 23.55 23.24 −11.68 VFP 1585–1897 M 30–50 23.61 23.96 −10.54 VFP 1585–1897 M 30–50 23.01 −12.05 VFP 1585–1897 M 12–18 23.77 23.86 −10.70 VFP 1585–1897 F 18–30 23.36 23.91 −10.62 Δ 1.2–2.5 VFP 1585–1897 M 30–50 22.63 −12.65 Δ 1.9
3. Results
Our aim was to determine if the individuals buried in Trondheim originated from the town and grew up there. By comparing the oxygen isotopic composition of M1 and M3 teeth and by performing a statistical analysis of the M3 data we can document possible moves during and after childhood. By comparing these values to the one of the enamel in equilibrium with the environmental water at the time of death, we can also gain insights into migrations which may have occurred during the individuals' teenage years or adulthood. However, the variability of the isotopic compositions of teeth in a population is not only due to the integration of migrants. Indeed, the change of beverage (milk/water) during early childhood and variability of dietary habits in a population can induce respective inter-tooth (M1 vs M3) and inter-individual dif-ferences of isotopic compositions. Spatial and temporal climate varia-tions can also induce changes ofδ18
OCthrough the modification of the
δ18O
W. Taking into account the possible impacts of nutritional and
cli-matic changes on the isotopic composition of their tooth enamel, we have identified the likely migrants in the Trondheim burial sites. 3.1. Present day composition of environmental water
The monthly values of theδ18O
Wof precipitation sampled in
Trond-heim in 2013 are presented inTable 1. The data for January was estimat-ed because the measurestimat-ed value, equal to−19.86‰, was not plausible. Indeed, such a value, corresponds to Arctic environments (for instance, values as low as this one are measured, although seldom, further north in NY-Alesund in Svalbard, Norway; GNIP data). The extreme depletion of this sample may be attributable to the small amount of precipitation this month (44 mm), which was composed mainly of two days of snow-fall (Bjørn Frengstad, pers. com.), and is not likely to represent a com-plete sample. The yearly weighted δ18
OW of the precipitation in
Trondheim in 2013 is−8.77‰. The oxygen isotopic composition of the Trondheim tap waters sampled in October 2014 and September
2015 are −8.77 ± 0.2‰ and −8.61 ± 0.2‰ respectively (mean ~−8.7‰).
A series of yearly meanδ18
OWextending from 1850 to the present
was calculated from the temperature CRUTEM4 (Osborn and Jones, 2014; Jones et al., 2012) usingDansgaard's (1964)equation. It shows a ~1‰ increase from the second half of the 19th century, at the incep-tion of the warming trend, to now. We calculated the 10-year running mean to take into account the buffering effect of water residing in nat-ural reservoirs (10 years in Lake Jonsvatnet).
The mean temperature in Trondheim in 2014 and the average values of 2004–2014 (taking into account the buffering effect of water residing about 10 years in the reservoir), are both equal to ~ 6 °C which corre-sponds toδ18
OW= ~−9.3‰. This value is close to that of the tap
water. Though it should be confirmed, in particular with additional δ18O
Wmeasurements, the consistency of the measured and calculated
values supports usingDansgaard's (1964)equation for derivingδ18
OW
from temperature in the study area. Theδ18O
Cof an M3 tooth from an adult male, presently living in
Trondheim, was analysed. He has always lived in Trondheim and is now 40 years-old (which means that his M3 was completed ca. 1989). Theδ18O
Wcalculated from the M3 is ~−11‰ in 1989, while at the
same time the composition of the reservoir water averaged over 1983–1989, the approximate time of mineralisation of the M3, is about−10‰. This 1‰ discrepancy may be due to the combination of analytical and model errors, and could perhaps also be due to the con-sumption of non-local drinks between ~8 and 14 years (Fig. 2). 3.2. Migration during childhood
As stated inSection 2.3., the oxygen isotopic compositions of the M1 and M3 teeth of an individual can be different because of the change of beverage from milk to water during early childhood. This effect can in-duce a bias in the interpretation of isotopic differences between M1 and M3 in terms of migration. We therefore sought to quantify and
Table 2 (continued)
1 2 3 4 5 6 7 8 9 10 11
Site Age of burial Sex Age at death M1 δ18 OC M3 δ18 OC M3 δ18 OW Migr. child Δ δ18
OWchild Migr. adult Δ δ18OWadult
VFP 1585–1897 F 30–50 24.56 −9.58 VFP 1585–1897 M 18–30 23.38 22.57 −12.75 Δ 2.0 SB 1585–1897 M 18–30 23.68 23.67 −11.00 SB 1585–1897 M 30–50 23.44 −11.36 SB 1585–1897 M 30–50 24.41 24.29 −10.01 SB 1585–1897 M 30–50 24.00 23.50 −11.27 SB 1585–1897 M 30–50 23.70 23.10 −11.91 SB 1585–1897 M 18–30 24.72 24.47 −9.73 SB 1585–1897 M 18–30 24.70 24.89 −9.06 ∇ −1.7 SB 1585–1897 M 30–50 24.33 24.59 −9.54 SB 1585–1897 M 12–18 25.55 24.39 −9.85 SB 1585–1897 ? 30–50 25.55 24.39 −9.85 SB 1585–1897 M 30–50 23.05 23.04 −12.00 SB 1585–1897 M 30–50 23.90 23.41 −11.41 SB 1585–1897 F 30–50 24.98 23.83 −10.74 SB 1585–1897 ? 30–50 24.73 −9.31 SB 1585–1897 M 18–30 25.40 24.17 −10.20 SB 1585–1897 M 30–50 24.26 23.93 −10.59 SB 1585–1897 M 30–50 25.73 24.87 −9.09 ∇ −1.7 SB 1585–1897 M 30–50 23.61 23.80 −10.79 SB 1585–1897 M 18–30 23.84 23.32 −11.56 SB 1585–1897 M 30–50 23.63 23.15 −11.83 SB 1585–1897 F 30–50 23.22 23.16 −11.81 SB 1585–1897 F 30–50 23.81 −10.78 SB 1585–1897 M 30–50 23.82 23.63 −11.06 SB 1585–1897 F 18–30 24.33 23.59 −11.13 SB 1585–1897 F 30–50 23.98 −10.51 SB 1585–1897 M 18–30 24.69 23.67 −11.00 SB 1585–1897 ? 18–30 25.28 24.30 −10.00 SB 1585–1897 M 18–30 24.93 24.06 −10.38 Present M 40 23.60
eliminate the breastfeeding effect from the Trondheim teeth database prior to interpreting the differences between the M1 and M3 teeth com-positions. We then evaluated if the isotopic composition of the drinking water, ingested by nursing mothers or by the individuals themselves, could vary in response to differences in mean temperatures during the times of formation of the two teeth.
As already mentioned, the mean enrichment of M1 teeth with re-spect to M3 is generallyb1‰. Moreover, within a population the inter-individual variability of the enrichment is frequently several tenths of a per mil (Evans et al., 2006b; White et al., 2005; Wright and Schwarcz, 1999; Wright and Schwarcz, 1998). To take this possible var-iability into account, we have calculated adjustments of the isotopic composition of the M1 of the present database to compensate for offsets ranging from 0.2‰ to 1‰.
The M1 and M3 are formed at two different periods of life (0–3 and ~ 8–14 years), during which the mean temperature may be different. We tested this assumption using the Trondheim temperature series provided by CRUTEM4 for the period 1970–2014. UsingDansgaard's (1964)equation, we transformed it into aδ18O
Wseries with which we
calculated the 10-year running mean (δ18O
W-10) to take into account a
10-year residence time in the reservoir. Then, we calculated the differ-ences betweenδ18
OW-10averaged over packs of 3 years (time for M1
mineralisation) and packs of 6 years (time for M3 mineralisation). These differences are contained in a ± 0.30‰ interval (±1σ). Such dis-persion translates into a ±0.13‰ possible difference between the δ18
OC
of the M1 and of M3. In the past, water may have resided for shorter times in smaller reservoirs. Our calculation yields an isotopic difference of 0.2‰ if the residence time is only 3 years.
We considered that if the isotopic composition of the M1 (adjusted for weaning) and M3 differed byN0.6‰ (2 analytical uncertainties +0.2‰ possible effect of temperature change), then migration during childhood was likely. This value is rather conservative as there is no compensation for errors in the calculation.
The compositions of M3 teeth are not statistically different from those of adjusted M1 (atα = 0.05%). However, they differ by N0.6‰ in 16 out of the 70 individuals (whatever the value of the adjustment; Fig. 3). This indicates that in these cases, the difference between the M1 and M3δ18
OCis neither attributable to breast-feeding nor to climate,
but may be ascribed to a migration of the individuals between 3 years old and early teenage years. Most of the possible migrants were buried at the Folkebibliotekstomten site (13 out of 17), three at Vestfrontplassen and one at Søndregate. Three quarters of these (11/ 17) were females. At the Folkebibliotekstomten site, more than half of the individuals are potentially migrants. For all the 17 likely migrants, δ18
OCincreased from M1 (adjusted value) to M3.
3.3. Migration after early teens
The periods during which the various cemeteries were in use are known, but not the precise dates of each burial. Therefore, at each site the excavated individuals may not be contemporaries. The time of mineralisation of all the teeth analysed at a site may thus correspond to different temperature conditions. To estimate the incidence of these conditions on the distribution of the isotopic values, we calculated a the-oretical standard deviation (SD) of the M3δ18O
Cover the 1900–2014
period using the CRUTEM4 temperature and assumed that the individ-uals drank water derived from the reservoir. The obtained range of M3 is ± 0.2‰. The published values of intra-populational variability are generally larger. Indeed,White and Spence (1998)report SD ranging from ± 0.3‰ to ±0.8‰ in Mexico,Fricke et al. (1995) between ± 0.1‰ and ±0.9‰ in Greenland, while ±0.8 to 0.9‰ have been re-ported in other populations (e.g.Daux et al., 2005). In addition to tem-perature changes, other effects, such as different diets (e.g.Daux et al., 2008), may cause variations of theδ18
OC. In order to identify migrants,
we defined extreme values of δ18O
Cof the M3 as those above/below
the average of all the data (23.88‰) plus/minus a conservative possible
intra-populational variability of 0.9‰ (Fig. 4). Among the M3 teeth of the 88 buried individuals, 12 may be ascribable to individuals having migrated during adulthood (after ~ 14 years). Three of them had moved during childhood (between M1 and M3 completions). The isoto-pic compositions of their M1 are close to the averageδ18O
Cof the M1
teeth of the whole population (23.99‰), while those of their M3 are sig-nificantly above the average oxygen ration of the M3. These characteris-tics are compatible with an early life in Trondheim, a move after the age of 14 and a return to Trondheim a few years later.
4. Discussion: possible origin of migrants
The origin of the buried individuals cannot be determined precisely. Indeed, the uncertainty (model error) onδ18O
Wcalculated fromδ18OCis
about 1‰ (Chenery et al., 2012). Moreover, since medieval times, the study area has very likely undergone changes in mean temperature with consequential variations of the isotopic composition of the envi-ronmental water. Such changes would make the comparison between past and presentδ18O
Wirrelevant for the recognition of migrants.
How-ever, according to reconstructions of the variations of the spring-summer temperature in coastal northern (from 1548 to 1989; Kirchhefer, 2001) and western (1734–2003; Nordli et al., 2003) Norway, the largest temperature variation at the pluri-decadal scale oc-curred over the last century. Therefore, we assume that the effect of temperature onδ18
OWhas been relatively constant across the medieval
and post-medieval periods and that the spatial gradient (relative varia-tions) ofδ18O
Whas not changed through time. Under such hypotheses,
we can compare the present gradient ofδ18O
W(Fig. 5) to the calculated
variations ofδ18O
W(Table 2) that have accompanied the migrations
1) during childhood from the difference between M1 (adjusted) and M3 compositions, and 2) after 14 years from the deviation of individual δ18O
Cfrom the mean of the whole archaeological M3 set.
The 17 migrants who migrated during childhood all moved along a gradient of increasingδ18O
W.According to the present isotopic
distribu-tion, the change of 1 to 4‰ (Table 2) corresponds to migrations from more or less distant locations in Northern Norway and Sweden. They are also compatible with more eastern locations. One individual (in FBT) corresponds to a migration along a 6–7‰ gradient, consistent with a long distance migration from an Arctic location (in Siberia, Greenland or at the northern tip of Scandinavia).
Among the 12 migrants who moved after 14 years of age, six moved along a gradient of increasing values (+1.6‰ to +2.9‰), that is from 300 to 400 km North or East, the others along a gradient of decreasing values (−4‰ to −1.7‰) from the South-West (Scotland, for instance) or South (southern France or northern Italy or Spain).
Three migrants moved during childhood along a gradient of increas-ingδ18O
W, and after 14 years of age along a gradient of decreasing
com-position, the amplitude of the back and forth moves being close (+1.7‰ to 3‰ versus −1.7‰ for instance). A likely scenario is that the individ-uals lived in Trondheim during their early childhood, moved south-wards during childhood, and moved back to Trondheim between 14 years and death.
5. Conclusions
The investigations discussed in this article have provided new infor-mation about the pre-modern population in Trondheim. Age of migrat-ing individuals and directions of the migrations have been discussed, temporal changes have been shown, and suggestions have been made regarding the proportion of immigrants versus locals in the population. An unexpected high level of child mobility has been shown in the medi-eval material with 36% of all medimedi-eval individuals having moved during childhood, and as much as 57% if looking at the Folkebibliotekstomten site alone. As noteworthy as the child mobility in the medieval material is the lack of the same amongst the post-medieval individuals, as only 7% of these seem to have migrated during childhood. There are, at
least, two questions here that require further investigation:firstly, how can such a high level of medieval child mobility be explained and, sec-ondly, why is there hardly any evidence of child mobility in the early modern material? With regard to migration during adulthood, quite few migrants have been identified: 12.5% of the medieval individuals and 13% of the individuals in the post-medieval material. Thus, overall, 40% of the medieval individuals were born elsewhere from where they were buried while the same scenario only applies to 17% of the post-medieval individuals. This does, however, not necessarily mean that most people were born and grew up in Trondheim, but it rather means that the majority of the population seems to have been born in the larger region surrounding Trondheim. Due to inaccuracies in the methodology and analyses, the individuals born in areas surrounding the town will not have been distinguished from people having been born in the town. What seems to be a clear pattern, however, is the de-creased migratory activity in the post-medieval period in comparison to medieval times. Can these temporal changes be explained by changes in society as a result of the Reformation?
Although this investigation has provided new information about the migratory patterns of pre-modern population in Trondheim, it also poses several new questions, in particular questions surrounding how these results can be explained in the light of societal changes, which would have come about as a result of the Reformation. These are com-plex questions which require a closer discussion within the framework of historical and archaeological sources.
Acknowledgments
This research would not have been possible without the support of the Research Council of Norway through grant number: 220821. We would also like to acknowledge the contribution of the following peo-ple: Bjørn Frengstad at NGU for setting up the precipitation collector and collecting the monthly water samples; Jon Anders Risvåg og Birgitte Skar at the NTNU Museum of Science for granting us access to the skel-etal material; and Charles Utvik for his invaluable effort while collecting the enamel samples together with the author (S.S.H.); Nina Sivertsen at Tanngarden dental clinic in Trondheim for providing modern tooth samples from Trondheim. We would also like to thank Darren G. Mann and Helen Frances Leslie-Jacobsen for proofreading the article. References
Anderson, T., Göthberg, H., 1986.Fortiden i Trondheims bygrunn: Folkebibliotekstomten. Olavskirkens kirkegård. Human-osteologisk analyse og faseinndeling. Meddelelser. Riksantikvaren, utgravningskontoret for Trondheim, Trondheim.
Bjørgum, F., Broch, E., 1996.Underground storage and treatment of water and sewage in Trondheim. In: OZDEMIR, L. (Ed.), North American Tunneling. Balkema, Rotterdam.
Brohan, P., Kennedy, J.J., Harris, I., Tett, S.F.B., Jones, P.D., 2006.Uncertainty estimates in re-gional and global observed temperature changes: a new data set from 1850. J. Geophys. Res.-Atmos. 111, 1–21.
Bryant, j.D., Froelich, p.N., 1995.A model of oxygen isotope fractionation in body water of large mammals. Geochim. Cosmochim. Acta 59, 4523–4537.
Budd, P., Millard, A., Chenery, C., Lucy, S., Roberts, C., 2004.Investigating population movement by stable isotope analysis: a report from Britain. Antiquity 78, 127–141.
Chenery, C., Eckardt, H., Müldner, G., 2011.Cosmopolitan Catterick? Isotopic evidenece for mobility on Rome's northern frontier. J. Archaeol. Sci. 38, 1525–1536.
Chenery, C.A., Pashley, V., Lamb, A.L., Sloane, H.J., Evans, J.A., 2012.The oxygen isotope re-lationship between the phosphate and structural carbonate fractions of human bioapatite. Rapid Commun. Mass Spectrom. 26, 309–319.
Christophersen, A., 1994.Strete, havn og kirkegård. In: Christophersen, A., Nordeide, S.W. (Eds.), Kaupangen ved Nidelva. Riksantikvaren, Trondheim.
Christophersen, A., Nordeide, S.W., 1994. Kaupangen ved Nidelva. Trondheim, Riksantikvaren.
Coplen, T.B., 1988.Normalization of oxygen and hydrogen isotope data. Chem. Geol. 72, 293–297.
Dansgaard, W., 1964.Stable isotopes in precipitation. Tellus, XVI, pp. 436–468.
Darling, W.G., Bath, A.H., Talbot, J.C., 2003.The O & H stable isotopic composition of fresh waters in the British Isles. 2. Surface waters and groundwater. Hydrol. Earth Syst. Sci. 7, 183–195.
Daux, V., Lécuyer, C., Adam, F., Martineau, F., Vimeux, F., 2005.Oxygen isotope composi-tion of human teeth and the record of climate changes in France (Lorraine) during the last 1700 years. Climate Change 70, 445–464.
Daux, V., Lécuyer, C., Héran, M.A., Amiot, R., Simon, L., Fourel, F., Martineau, F., Lynnerup, N., Reychler, H., Escarguel, G., 2008.Oxygen isotope fractionation between human phosphate and water revisited. J. Hum. Evol. 55, 1138–1147.
Dupras, T.L., Schwarcz, H.P., 2001.Strangers in a strange land: stable isotope evidence for human migration in the Dakhleh Oasis, Egypt. J. Archaeol. Sci. 28, 1199–1208.
Evans, J., Stoodley, N., Chenery, C., 2006a.A strontium and oxygen isotope assessment of a possible fourth century immigrant population in a Hampshire cemetery, southern England. J. Archaeol. Sci. 33, 265–272.
Evans, J.A., Chenery, C., Fitzpatrick, A.P., 2006b.Bronze age childhood migration of individ-uals near stonehenge, revealed by strontium and oxygen isotope tooth enamel anal-ysis. Archaeometry 48, 309–321.
Fricke, H.C., O'Neil, J.R., 1999.The correlation between 18O/16O ratios of meteoric water and surface temperature: its use in investigating terrestrial climate change over geo-logic time. Earth Planet. Sci. Lett. 170, 181–196.
Fricke, H.C., O'Neil, J.R., Lynnerup, N., 1995.Oxygen isotope composition of human tooth enamel from medieval Greenland: linking climate and society. Geology 23, 869–872.
Fritz, P., Drimmie, R.J., Frape, S.K., O'Shea, K., 1987.The isotopic composition of precipita-tion and groundwater in Canada. IAEA-SM-299/17, pp. 539–550.
Grimes, V., Pellegrini, M., 2013.A comparison of pretreatment methods for the analysis of phosphate oxygen isotope ratios in bioapatite. Rapid Commun. Mass Spectrom. 27, 375–390.
Hamre, S., 2011.Burial Practices in Early Christian Norway. An Osteoarchaeological Study Into Differences and Similarities Between Four Burial Assemblages (PhD) University of Bergen.
Helle, K., 2006.Norsk byhistorie: urbanisering gjennom 1300 år. Pax, Oslo.
Hillson, S., 1996.Dental Anthropology. Cambridge University Press, Cambridge.
Ingraham, N.L., Taylor, B.E., 1991.Light stable isotope systematics of large scale hydrologic regimes in California and Nevada. Water Resour. Res. 27, 77–90.
Jenness, R., M, E.H., Keeney, M., 1999.Composition of milk. In: Jenness, R., Noble, P.W. (Eds.), Fundamentals of Dairy Chemistry. Aspen Publishers, Gaithersburg.
Jones, P.D., Lister, D.H., Osborn, T.J., Harpham, C., Salmon, M., Morice, C.P., 2012. Hemi-spheric and large-scale land-surface air temperature variations: an extensive revision and an update to 2010. J. Geophys. Res.-Atmos. 117.
Kirchhefer, A.J., 2001.Reconstruction of summer temperatures from tree-rings of Scots pine (Pinus sylvestris L.) in coastal northern Norway. The Holocene 11, 41–52.
Koch, P.L., Tuross, N., Fogel, M.L., 1997.The effects of sample treatment and diagenesis on the isotopic integrity of carbonate in biogenic hydroxylapatite. J. Archaeol. Sci. 24, 417–429.
Kohn, M.J., 1996.Predicting animalδ18O: accounting for diet and hysiological adaptation. Geochim. Cosmochim. Acta 60, 4811–4829.
Kohn, M.J., Schoeninger, M.J., Barker, W.W., 1999.Altered states: effects of diagenesis on fossil tooth chemistry. Geochim. Cosmochim. Acta 63, 2737–2747.
Kortelainen, N.M., Karhu, J.A., 2004.Regional and seasonal trends in oxygen and hydrogen isotope ratios of Finnish groundwaters: a key for mean annual precipitation. J. Hydrol. 285, 143–157.
Lecolle, P., 1985.The oxygen isotope composition of landsnailshells as a climatic indica-tor: applications to hydrogeology andpalaeoclimatology. Chemical Geology (Isotope Geoscience Section) 58, 157–181.
Levinson, A.A., Luz, B., Kolodny, Y., 1987.Variations in oxygen isotopic compositions of human teeth and urinary stones. Appl. Geochem. 2, 367–371.
Longinelli, A., 1984.Oxygen isotopes in mammal bone phosphate: a new tool for paleohydrological and paleoclimatological research? Geochim. Cosmochim. Acta 48, 385–390.
Luz, B., Kolodny, Y., Horowitz, M., 1984.Fractionation of oxygen isotopes between mam-malian bone-phosphate and environmental drinking water. Geochim. Cosmochim. Acta 48, 1689–1693.
Moseng, O.G., Opsahl, E., Pettersen, G.I., Sandmo, E., 2007.Norsk historie: 750-1537. Universitetsforlaget, Oslo.
Müller, W., Fricke, H.C., Halliday, A.N., McCulloch, M.T., Wartho, J.A., 2003.Origin and mi-gration of the Alpine Iceman. Science 302, 862–866.
Nordeide, S.W., 1997.St. Olavs by. In: Christophersen, A. (Ed.), Fra Nidarnes til Trondheim. Vandringer i et Bylandskap. NINA-NIKU, Trondheim.
Nordli, P.O., Lie, O., Nesje, A., Dahl, S.O., 2003.Spring-summer temperature reconstruction in western Norway 1734–2003: a data-synthesis approach. Int. J. Climatol. 23.
Opsahl, E., 2007.“…som jeg tusindfold infødder war”. Norsk Innvandringshistorie ca. 900-1537. Doctor Artium, University of Tromsø.
Opsahl, E., Sogner, S., 2003.Norsk innvadringshistorie. Bind 1. I kongenes tid 900-1814. Pax Forlag, Oslo.
Osborn, T.J., Jones, P.D., 2014.The CRUTEM4 land-surface air temperature data set: con-struction, previous versions and dissemination via Google Earth. Earth System Sci-ence Data 6, 61–68.
Prowse, T.L., Schwarcz, H.P., Garnsey, P., Knyf, M., Macchiarelli, R., Bondioli, L., 2007. Isoto-pic evidence for age-related immigration to Imperial Rome. Am. J. Phys. Anthropol. 132, 510–519.
Ramstad, S., 2002.Gregoriuskirka. Rekonstruksjon og funksjonell analyse. Hovedfag, Norges teknisk-naturvitenskapelige universitet.
Reed, I., Kockum, J., Hughes, K., Sandvik, P.U., 1998.Excavations Outside the West Front of Nidaros Cathedral in Trondheim. Part 1. NIKU, Trondheim.
Richards, M.P., Mays, S., Fuller, B.T., 2002.Stable carbon and nitrogen isotope values of bone and teeth reflect weaning age at the Medieval Wharram Percy site, Yorkshire, UK. Am. J. Phys. Anthropol. 119, 205–210.
Roberts, S.B., Coward, W.A., Ewing, G., Savage, J., Cole, T.J., Lucas, A., 1988.Effect of weaning on accuracy of doubly labeled water method in infants. Am. J. Physiol. 254, 622–627.
Rozanski, K., 1985.Deuterium and oxygen-18 in european groundwaters - links to atmo-spheric circulation in the past. Chem. Geol. 52, 349–363.
Rozanski, K., Araguas-Araguas, L., Gonfiantini, R., 1992.Relation between long-term trends of oxygen-18 isotope composition of precipitation and climate. Science 258, 981–985.
Rozanski, K., Araguas-Araguas, L., Gonfiantini, R., 1993.Isotopic pat terns in modern global precipitation. In: Swart, P.K., Lohmann, K.C., McKenzie, J., Savin, S. (Eds.), GeophysicalMonograph 78Climate Change in Continental Isotopic Records. American Geophysical Union.
Schour, I., Massler, M., 1940a.Studies in tooth development: the growth pattern of human teeth. Part I. J. Am. Dent. Assoc. 27, 1778–1793.
Schour, I., Massler, M., 1940b.Studies in tooth development: the growth pattern of human teeth. Part II. J. Am. Dent. Assoc. 27, 1918–1931.
Sellen, D.W., 2001.Comparison of infant feeding patterns reported for nonindustrial pop-ulations with current recommendations. J. Nutr. 131, 2707–2715.
Shahar, S., 1990.Childhood in the Middle Ages. Routledge, London.
White, C.D., Spence, M.W., 1998.Oxygen isotopes and the identification of geographical origins: the Valley of Oaxaca versus the Valley of Mexico. J. Archaeol. Sci. 25, 643–655.
White, C., Longstaffeb, F.J., Kimberley, R.L., Longstaffe, F.J., Law, K.R., 2004.Exploring the effects of environment, physiology and diet on oxygen isotope ratios in ancient Nubi-an bones Nubi-and teeth. J. Archaeol. Sci. 31, 233–250.
White, A.A., Hoskins, B.J., Roulstone, I., Staniforth, A., 2005.Consistent approximate models of the global atmosphere: shallow, deep, hydrostatic, quasi-hydrostatic and non-hydrostatic. Q. J. R. Meteorol. Soc. 131, 2081–2107.
Wright, L.E., Schwarcz, H.P., 1998.Stable carbon and oxygen isotopes in human tooth enamel: identifying breastfeeding and weaning in prehistory. Am. J. Phys. Anthropol. 106, 1–18.
Wright, L.E., Schwarcz, H.P., 1999.Correspondence between stable carbon, oxygen and ni-trogen isotopes in human tooth enamel and dentine: infant diets at Kaminaljuyú. J. Archaeol. Sci. 26, 1159–1170.
Yilmaz, U., Sellevold, B.J., 2006.Skjelettfunnene fra Nidarosdomens kirkegårds nordvestre område. NIKU, Oslo.
Yurtsever, M., Gat, J.R., 1981.Atmospheric waters. Stable isotope hydrology: deuterium and oxygen-18 in the water cycle. IAEA Technical Report Series.