HAL Id: hal-03081089
https://hal.uca.fr/hal-03081089
Submitted on 18 Dec 2020
HAL is a multi-disciplinary open access archive for the deposit and dissemination of sci-entific research documents, whether they are pub-lished or not. The documents may come from teaching and research institutions in France or abroad, or from public or private research centers.
L’archive ouverte pluridisciplinaire HAL, est destinée au dépôt et à la diffusion de documents scientifiques de niveau recherche, publiés ou non, émanant des établissements d’enseignement et de recherche français ou étrangers, des laboratoires publics ou privés.
Copyright
Experimentally induced volumetric re-equilibration of
plagioclase-hosted melt inclusions
M.J. Drignon, Laurent Arbaret, Nicolas Cluzel, R.L. Nielsen, R.J. Bodnan
To cite this version:
M.J. Drignon, Laurent Arbaret, Nicolas Cluzel, R.L. Nielsen, R.J. Bodnan. Experimentally induced volumetric re-equilibration of plagioclase-hosted melt inclusions. Geochemistry, Geophysics, Geosys-tems, AGU and the Geochemical Society, 2021, 22 (1), pp.2020GC009357. �10.1029/2020GC009357�. �hal-03081089�
Experimentally induced volumetric re-equilibration of plagioclase-hosted melt
inclusions
M. J. Drignon1†, L. Arbaret2, N. Cluzel3, R. L. Nielsen1,4, R. J. Bodnar5
1 College of Earth, Oceans and Atmospheric Science, Oregon State University, OR USA.
2 Université d’Orléans, Institut des Sciences de la Terre d’Orléans, Orléans, France.
3 Université Clermont-Auvergne, CNRS, IRD, OPGC, Laboratoire Magmas et Volcans, F-63000
Clermont-Ferrand, France.
4 Department of Geology and Geological Engineering, South Dakota School of Mines and
Technology, Rapid City, SD, USA.
5 Department of Geosciences, 4044 Derring Hall, Virginia Tech, Blacksburg, VA, USA.
Corresponding author: Mélissa J. Drignon ([email protected])
† Current Address: Asian School of the Environment, Nanyang Technological University, Singapore
Key Points:
● Plagioclase-hosted melt inclusions
● Re-equilibration
● Stress distribution
● Bubble nucleation and coalescence
Key Sentences:
• We performed heating stage experiments to understand the chemical re-equilibrations experienced by plagioclase-hosted melt inclusions with increasing experiment time.
• The melt inclusions experienced episodes of bubble nucleation while the plagioclase-hosts deformed brittlely.
• Microtomography and photographs were used to estimate the volume increase of vapor
bubbles and melt inclusions through the heating experiments.
Accepted
Article
Accepted
Article
Abstract
The application of melt inclusions (MI) to infer magmatic processes assumes the MI have remained as constant mass, constant volume systems since the time of trapping. Understanding the effects of both compositional and volumetric re-equilibration is key for the interpretation of MI data. Although the re-equilibration behavior MI in quartz and olivine has been studied in some detail, the process is less understood for other MI host phases such as plagioclase, a common phase in igneous rocks.
A MI can re-equilibrate when it experiences PT conditions that differ from formation PT conditions. During laboratory heating irreversible MI expansion may occur. As a result, the internal pressure within the MI decreases, resulting in chemical and structural changes to the MI and host. We present results of heating experiments on plagioclase-hosted MI designed to induce volumetric re-equilibration. The experiments consisted of incrementally heating the MI to temperatures above the homogenization temperatures. At ~40°C above the temperature at which the daughter minerals melted, irreversible volume expansion lowered the pressure in the MI, and
led to exsolution of CO2 into vapor bubbles. With each additional few degrees of heating,
additional episodes of CO2 exsolution, bubble nucleation and expansion of the vapor bubble
occurred. Re-equilibration of MI in plagioclase occurred through a combination of ductile and brittle deformation of the host surrounding the MI, whereas previous studies have shown that MI in olivine re-equilibrate dominantly through ductile deformation associated with movement along dislocations. This behavior is consistent with the differing rheological properties of these phases.
Plain Language Summary
During magma ascent and eruption, melt inclusions (MI), representing small pockets of melt trapped during mineral growth, experience conditions that may alter their original volume and composition. To recover conditions representative of those at the time of MI formation, heating experiments are performed to reverse changes that occur after the MI formed. Compositional and volatile analyses of MI that have been so treated reveal important and otherwise unobtainable information on the magmas stored at depth. However, depending on the temperature, experimental run time and heating rate, the MI can be irreversibly modified, sometimes without leaving obvious structural damage. To examine how MI respond to exposure to high temperature and long-duration experimental runs, we heated plagioclase-hosted MI to temperatures beyond the inferred trapping
Accepted
Article
temperature. We found that, when the internal pressure in the MI exceeds the confining pressure, the plagioclase host undergoes both ductile and brittle deformation, thus allowing the MI volume to increase, leading to a decrease in the internal pressure and exsolution of volatiles dissolved in the melt. If the temperature was raised in increments beyond ~1,270C, each new increment of overheating resulted in additional fracturing of the host, pressure decrease, vapor exsolution, bubble nucleation, migration, and coalescence.
1 Introduction
1.1 Statement of the problem
Melt inclusions (MI), pockets of melt trapped during crystal growth, have become one the primary sources of information concerning the physical and chemical characteristics of magmas at depth. Interpretation of information from MI is based on the assumption that they remain a closed, constant volume system following trapping. Any changes that occur after trapping must be reversible by calculation or by microthermometry in order to reconstruct the original PTX conditions at trapping (Roedder, 1979). Changes in temperature and pressure as a magmatic system evolves may lead to changes in the composition of the MI through a variety of post-entrapment processes. These processes include post entrapment crystallization (PEC) of host mineral on the MI walls that occurs during cooling. The MI may also become saturated in mineral phases other than the host phase and precipitate daughter minerals during cooling. In order to determine the composition of the melt that was originally trapped, the effects of both PEC and daughter mineral formation must be accounted for, and this is accomplished through heating experiments to homogenize the MI contents, or through mass balance calculations to restore host/inclusion chemical equilibrium (Danyushevsky et al., 2000; Toplis, 2005; Rapien et al., 2003; Bodnar & Student, 2006).
While PEC and formation of daughter minerals after trapping are easily recognized and may be corrected for, diffusive re-equilibration involves exchange of components between the MI and host mineral and/or the external melt that is transporting the crystals during ascent and is more difficult to recognize, and in many ways is analogous to cryptic metasomatism. Diffusive re-equilibration occurs when the MI and host crystal and/or host lava are out of equilibrium (Danyushevsky et al., 1997, 2002; Kent, 2008; Lange et al., 2013; Qin et al., 1992). Loss or gain of volatiles occurs by diffusion from the MI and is facilitated by the presence of cracks or dislocation planes in the host mineral surrounding the MI. Evidence for volatile loss includes
Accepted
Article
variations in the H isotopic composition and unrealistically low H2O, CO2 and/or S concentration
in the MI (Nielsen et al., 1998; Bodnar & Student, 2006; Gaetani et al., 2012; Drignon et al., 2018). In addition to PEC, precipitation of daughter minerals, and diffusive re-equilibration of MI, the melt in the inclusion may also become saturated in one or more volatile components and form a vapor bubble after trapping. Studies have shown that the vapor bubbles in MI may contain up to
90% of the total CO2 that was originally dissolved in the melt. The amount of CO2 (and other
volatiles) contained in the vapor bubbles must be included in the total MI volatile budget to obtain an accurate estimate of the entrapment pressure (Steele-MacInnis et al., 2011; Hartley et al., 2014; Moore et al., 2015; Wallace et al., 2015). Many of the changes that MI experience after trapping are reversible – these include elastic changes to the host crystal as a result of thermal contraction or decompression as the PT conditions change, precipitation of material on the MI walls and
formation of daughter minerals. In some cases, diffusive loss of some components, such as H2O,
is reversible and the original H2O content may be restored experimentally (Mironov et al., 2015;
Portnyagin et al., 2008). Other changes are irreversible and include the diffusive loss of most non-volatile components and inelastic volume changes. Volumetric re-equilibration as used here refers to the inelastic, irreversible change in the volume of the host phase in response to changing temperature and/or confining pressure, or deformation of the host crystal driven by expansion of the MI (Tait, 1992). Volumetric re-equilibration of olivine-hosted MI has been documented by Schiavi et al. (2016), who measured the expansion of MI with increasing experimental run duration and temperature at 0.1 MPa. They found that most deformation surrounding MI was associated with plastic deformation involving movement along dislocation planes. Dislocation planes in olivine were recognized by the presence of iron oxide phases that decorated the dislocations and revealed damage to the crystal structure. A more general and inclusive review of volumetric re-equilibration processes associated with inclusions is provided by Ferrero & Angel (2018).
In our previous work on plagioclase-hosted MI, we observed that increasing amounts of CO2
appeared to exsolve from the melt into vapor bubbles as the duration of laboratory heating experiments increased (Drignon et al., 2018, 2019). Time-series experiments performed from 30 minutes to 4 days at 1,230 ºC in a one-atmosphere vertical furnace revealed a 15% increase in the
amount of CO2 that exsolved from the melt into vapor bubbles, without modifying the overall CO2
concentrations of the MI (e.g., total CO2 content of MI did not change). The migration of CO2 into
Accepted
Article
time which, in turn, led to a decrease in CO2 solubility in the melt (Drignon et al., 2018). Increasing
experimental run time also led to an increase in the average SiO2 and MgO content of the MI,
together with a decrease in Na2O, K2O, Al2O3, and CaO contents, as a result of diffusive
re-equilibration. The non-volatile component that exhibited the largest change in concentration with increasing run time was MgO (Drignon et al., 2019). Both the generation of larger vapor bubbles by volumetric re-equilibration and the modification of MI chemistry by diffusive re-equilibration between MI and hosts are time-dependent phenomena. In this study we explore the mechanisms responsible for re-equilibration of MI in plagioclase as described in Drignon et al. (2018; 2019). We consider the mechanical behavior of plagioclase as it undergoes deformation during incremental heating using 2D and 3D imaging of the shape and size of MI before, during, and after experimentation. Finally, we compare the manner in which MI in plagioclase respond to increases in internal pressure to the behavior of MI in olivine and discuss reasons for their differing behaviors.
1.2 Background Information
The goal of heating experiments on heterogeneous MI is to return the MI to the glassy state by reversing PEC and dissolving daughter minerals and exsolved vapor back into the melt. The temperature at which daughter minerals dissolve during heating is commonly assumed to represent a minimum temperature of entrapment (Roedder, 1979). Moreover, experimental protocols followed during heating experiments are critical to successfully retrieving information concerning the characteristics of the melts at the time of trapping and, concomitantly, magmas at depth. The homogenization temperature and temperatures of dissolution of daughter minerals obtained through laboratory heating experiments depend on the heating rate, the equipment used (tube furnace versus microscope-mounted heating stage versus heating in an autoclave at elevated confining pressure), the inclusion size, the duration and the method (step-wise versus continuous heating) of heating (see Student & Bodnar, 1999, for a detailed discussion of the effect of experimental parameters on the measured homogenization temperature of MI). We also note that
heating experiments to correct for the diffusive loss of H2O (and perhaps other species) require
specialized equipment and procedures in which the MI are heated under a high confining pressure
and with an elevated and known H2O activity (or fugacity) (Mironov et al., 2015; Portnyagin et
Accepted
Article
The homogenization temperature represents the temperature at which the MI achieves a homogeneous state during heating and, thus, contains only a single phase. However, during laboratory heating at one-atmosphere, the internal pressure in the MI is lower than the pressure at the time of MI formation because the crystal structure has relaxed (expanded) owing to the lower confining pressure and, as such, volatiles in the MI usually do not dissolve at the temperature of trapping. This results in a remnant vapor phase after all daughter minerals have dissolved (Wallace et al., 2015). In this case, the temperature at which all the solids in the MI have dissolved back into the melt is commonly reported as the homogenization temperature. Heating beyond the temperature at which the solids melt in an attempt to dissolve the vapor bubble often leads to leakage or decrepitation of the MI. As such, most workers quench the MI from a temperature that is at or just above the temperature at which all of the solids have melted (see Figure 3 in Fedele et al., 2003) – if a vapor bubble remains in the MI, any volatiles contained in the bubble are taken into account by measuring the volatile contents of the bubble and reconstructing the volatile content of the trapped melt using mass balance approaches (Hartley et al., 2014; Moore et al., 2015; Wallace et al., 2015).
The rate at which a MI is heated during the homogenization experiment is important in order to avoid overheating the MI, resulting in a melt composition in the MI that is different from that of the trapped melt (Danyushevsky et al., 2002; Student & Bodnar, 1999). Specifically, if the MI is heated too quickly, it is possible to “overshoot” the homogenization (trapping) temperature. Conversely, if the MI is heated too slowly, the melt may re-equilibrate and change composition through the diffusion of components out of (or into) the MI. The MI should thus be heated as quickly as possible to allow all the solids in the MI to melt under equilibrium conditions. Danyushevsky et al. (1997) noted that when plagioclase-hosted MI from boninites were heated slowly, the homogenization temperature was higher compared to results obtained when the MI
were heated at a faster rate, and they attributed the increase in temperature to loss of H2O along
dislocations or cleavage planes. Slow heating rates in anhydrous MI may result in diffusive re-equilibration between host and melt and irreversibly modify the chemistry of the MI. Fast heating rates result in overheating, and thus overestimating the homogenization temperature and, perhaps, dissolving excess host into the melt. Both faster and slower heating rates may lead to irreversible volumetric and chemical changes within the MI and provide a homogenization temperature that is incorrect (Danyushevsky et al., 1997, 2002; Student & Bodnar, 1999). These modifications, in
Accepted
Article
turn, affect our ability to accurately constrain the compositions and temperatures of magmas at depth.
Danyushevsky et al. (2002) suggested that MI should be heated at a rate of about 100 ºC/min to within ~50 ºC of the expected entrapment temperature. The heating rate should then be decreased to 2-5 ºC/min until all the solids have dissolved back into the melt. Once the solids have dissolved, the samples should be quenched to ambient temperature to avoid compositional re-equilibration (Danyushevsky et al., 2002). In order to minimize changes in the composition of the melt, the MI heating experiment should not last more than 1h, with best results obtained when the duration of the experiment is between 10 and 30 min (Danyushevsky et al., 2002; Kent, 2008; Wallace et al., 2015). If the heating experiments are conducted using a one-atmosphere vertical furnace (Nielsen et al., 2017; Bodnar & Student, 2006), some heating experiments in a one-atmosphere microscope-mounted heating stage should be conducted beforehand to determine the temperature at which the solid phases disappear (c.f., Esposito et al., 2012). The homogenization temperature recorded by monitoring the MI optically during heating can then be used to establish the temperature for the one-atmosphere vertical furnace experiments as the behavior of MI during heating in the one-atmosphere furnace cannot be monitored directly. Results of previous MI studies using a one-atmosphere vertical furnace have yielded results similar to those obtained with a microscope heating stage (Nielsen et al., 1995; Sours-Page et al., 1999; Student & Bodnar, 1999; Lange et al., 2013; Drignon et al., 2019).
The expected temperature of homogenization of MI can also be estimated based on phase equilibria. For example, Student & Bodnar (2004) reported petrographic evidence that MI in quartz from the Red Mountain, AZ, porphyry copper system were trapped on the quartz-feldspar cotectic. Thus, the temperature at which feldspar daughter minerals in the MI dissolved was interpreted to represent the trapping temperature, and this was also consistent with numerical simulations of melt evolution predicted by the MELTS model (Ghiorso & Sack, 1995). In this respect, we note that essentially all MOR magmas saturated with anorthitic plagioclase (such as the plagioclase studied here) are also saturated with respect to olivine (Bryan, 1983). This provides an important constraint that, when combined with phase equilibrium calculations (e.g., MELTS; Ghiorso & Sack, 1995; Sinton et al., 1993; Kohut and Nielsen 2011), can guide us in establishing the temperature at which MI and host are in equilibrium. In addition, the temperature of dissolution of olivine daughter
Accepted
Article
minerals in plagioclase-hosted MI from MOR settings should closely approximate the trapping temperature (ignoring the effects of pressure on olivine precipitation).
Prolonged and repeated exposure to elevated internal pressures that result when MI are heated to high temperatures can compromise the structural integrity of the host phase and the composition of MI. As an example, Schiavi et al. (2016) subjected olivine-hosted MI from a tholeiite and from a shoshonite to cycles of increasing and decreasing temperature, resulting in repeated episodes of over-pressuring (i.e., the internal pressure in the MI exceeds the confining pressure). The samples were heated until the vapor bubbles disappeared, then cooled until the bubbles re-appeared, and this process was repeated multiple times. The tholeiite was subjected to 1-5 heating cycles, and the shoshonite to 10-34 cycles. Their objective was to observe how the olivine-hosts and their MI adjusted to pressure-induced deformation resulting from heating to high temperatures, and the manner in which the host surrounding MI would re-equilibrate when subjected to high stress. The modeled homogenization temperatures for the tholeiite ranged from 1,216 ºC at 100 MPa to 1,230 ºC at 400 MPa. For the shoshonite the modeled homogenization temperatures ranged from 1,145
ºC and 500 MPa for MI containing 6 wt.% H2O to 1,230 ºC and 100 MPa for MI containing 1
wt.% H2O. Their experiments revealed that the MI re-equilibrated as a result of the heating
experiments based on two key observations (Schiavi et al., 2016). First, during each successive heating cycle the temperatures at which the solids dissolved, and the vapor bubble appeared and disappeared, all increased (Danyushevsky et al., 2002; Massare et al., 2002; Schiavi et al., 2016). With each successive heating cycle, the vapor bubble would disappear at temperatures ranging from 2 ºC to 69 ºC above the previous bubble disappearance temperature for the tholeiite, and at temperatures from 0 ºC to 48 ºC above the previous bubble disappearance temperature for the shoshonite. The final homogenization temperature for the tholeiite ranged from 1,328 ºC to 1,516 ºC and from 1,346 ºC to 1,483 ºC for the shoshonite. The second observation reported is the formation of dislocations at the MI/olivine interface due to inelastic (plastic) deformation of the olivine host mineral surrounding the MI (Schiavi et al., 2016). These two observations were interpreted to reflect the response of the host mineral to the elevated internal pressure in the MI that drove deformation, with the increased temperatures of bubble disappearance reflecting a
combination of irreversible plastic deformation of the host olivine and H2O loss.
In similar long-duration heating experiments on MI, Severs et al. (2007) held MI in quartz from the Bishop Tuff at 800°C and 100 MPa for periods of time ranging from 4 to 1,512 hours (63
Accepted
Article
days). They documented that an insignificant amount of H2O was lost from the MI when the
heating duration was <12 hours, but that ~75% of the H2O had been lost from the MI after 1,512
hours. These workers did not study the mechanism of H2O loss from the MI but assumed that H2O
was lost by diffusion through the quartz host.
Little is known concerning the effects of heating rate and run time on the behavior of plagioclase-hosted MI. It has previously been assumed that MI hosted in plagioclase are less reliable with respect to volatile loss compared to those hosted in quartz and olivine because, unlike quartz and olivine, plagioclase contains two cleavage planes. However, recent studies have demonstrated that plagioclase-hosted MI trapped in the upper mantle can retain their volatile content through ascent and eruption (Neave et al., 2017; Drignon et al. 2018; Bennet et al., 2019). Owing to the common presence of plagioclase in many igneous rocks, confirmation that plagioclase is a reliable host for MI provides an additional phase in which to study MI to obtain information on the petrogenesis of the rocks. Furthermore, in certain settings such as mid-ocean ridges, plagioclase-hosted MI can be more primitive (higher Mg#) than olivine-hosted MI in the same sample, therefore providing information on the more primitive mantle melt chemistry (Nielsen, 2011; Lange et al., 2013; Neave et al., 2013).
The results presented here are based on in-situ observations in which plagioclase-hosted MI were heated to high temperatures at 0.1 MPa, following the experimental protocol of Schiavi et al. (2016). We measured changes in volumes of both MI and vapor bubbles as a function of temperature and recorded other evidence of re-equilibration, such as formation of fractures around MI that had re-equilibrated.
2 Materials and Methods
2.1 Sample provenance
The sample chosen for this study (A91-1R) is a plagioclase ultraphyric basalt (PUB) from the Blanco Transform Fault (BTF). The BTF is a 350 km long right-lateral transform fault located off the coast of Oregon (USA), separating the Juan de Fuca Plate to the north from the Pacific Plate to the south. The BTF dissects a mid-ocean ridge, with the Juan de Fuca Ridge to the NE and the Gorda Ridge to the SW (Embley & Wilson, 1992). Sample A91-1R was retrieved at 44°N 12’55”, 129°W 37’93”2.2, at 3200 m below sea level (Sprtel 1997). We selected this sample because it
Accepted
Article
compositions that are similar to their host, and the plagioclase-hosted MI are relatively homogeneous compared to other PUBs, suggesting a narrow range of homogenization temperatures estimated at 1,230 ºC ± 5 ºC (Nielsen et al., 2000; Nielsen, 2011; Lange et al., 2013). Based on phase equilibria constraints, the melt was interpreted to haven trapped at the olivine +
plagioclase → liquid + spinel invariant point (Osborn and Tait, 1952).
The plagioclase crystals studied measured up to ~0.5 cm in diameter. The samples were doubly polished using alumina powder to produce flat, polished wafers for experiments in the heating stage. At room temperature (before the heating experiment), the MI appear to be dark (opaque) owing to the presence of numerous tiny daughter crystals that refract the light from the microscope (Figure 1a).
2.2 3-D image acquisition and processing
Micro-computed tomography (microCT) analyses were performed at the Institut des Sciences de la Terre d’Orléans (Orléans, France) on a Nanotom 180NF Phoenix X-Ray. We used an accelerating voltage of 180 kV, a filament current of 170 nA, and an operating voltage of 120 V. The plagioclase crystals were individually mounted on a 5 mm-wide carbon-fiber rod using Crystalbond and placed on a rotating sensor inside the Nanotom microCT. During acquisition, the sample rotates 360°, allowing the instrument to acquire images covering all angles. After an analysis, the stack of 2D images is processed to construct a volume in 3D. The resolution for each analysis was set to 1.5 µ m in order to resolve objects a few micrometers in diameter. The analysis produced between 1200 and 1800 images of each crystal, depending on its size, requiring 90 to 150 minutes per cycle. Each crystal was analyzed twice (once before experimentation and once after) to quantify changes in volumes of both MI and vapor bubbles.
The volumes were manually extracted using the software VG-Studio Max 1.2. A non-linear diffusion filter was applied to obtain homogeneous and clear images. The volumes of the vapor bubbles and the MI were extracted with the segmentation tool. The software gave volumes in voxels, which were multiplied by 1.5 (the resolution of the analyses) to convert the volumes to
µm3, corresponding to the resolution used during the microCT analyses. These volumes, in turn,
were converted to volumes in cm3 in Table 1 to have the same units as volumes obtained from 2D
(photographs taken on the heating stage) measurements presented in Table 2. The errors on the volumes were also provided directly by the VGStudioMax 1.2 software.
Accepted
Article
2.3 Experimental procedure
Following the experimental procedure described in Schiavi et al. (2016), the plagioclase-hosts were heated in a Vernadsky-type heating stage at the Laboratoire Magmas et Volcans (LMV, Université Clermont-Auvergne, France) (Schiano, 2003). The objective was to observe the behavior of the MI and vapor bubbles during incremental heating. The initial plan was to heat the samples until the vapor bubbles disappeared (as described by Schiavi et al., 2016) and then decrease the temperature until the vapor bubbles re-appeared and repeat this process multiple times and note the temperatures of bubble appearance and disappearance as described by Schiavi et al. (2016). Changes in the vapor bubble homogenization temperature are interpreted to represent
inelastic volume changes of the MI as a result of heating and/or diffusive loss of H2O from the MI.
We performed 9 experiments (Table 2; Exp #1-9). In the first two experiments, the samples were heated in air. However, the remaining seven experiments were conducted by flowing He into the heating stage to minimize heat conduction and facilitate temperature control. The experimental temperatures were calibrated against the melting temperature of a piece of Au (1,064 °C) placed next to the crystal and monitored as the stage was heated. The observed melting temperature of gold was 1,038 ºC, representing a temperature offset of 26 ºC, which was used to correct the measured run temperatures (Table 2; Dataset S1). During the experiments, the temperature was increased at 100 °C/min to ~1,200°C. From there, the samples were heated at a rate of 10°C/min until all of the solids (daughter minerals) melted at ~1,230 ºC (Nielsen, 2011; Drignon et al., 2018, 2019). Starting from room temperature, heating the sample until all the solids melted at ~1,230°C took ~20-40 min. Once all of the crystals had dissolved, the samples were heated further at a rate of 10°C/min in an attempt to homogenize the vapor bubble. A complete experiment took up to 2h (Dataset S1).
Changes within the sample were documented by photographing the MI before, during and after the heating experiments. From these images, we estimated the length of the long and short axes of MI and vapor bubbles using the microscope software that is calibrated for a specific microscope objective. These volumes estimated from photographs (2D) complemented the volumes obtained by microCT (3D). Following Moore et al. (2015), we assumed the MI to be oblate (ellipsoidal) and the vapor bubbles to be spherical. Each axis measurement was assumed to be accurate to ±0.5 µm, based on the manual measurement precision achieved with the software at high magnification. The uncertainty was propagated through the volume calculations to obtain the errors associated
Accepted
Article
with volume estimates (Moore et al., 2015). The volume of the vapor bubbles was first measured at the temperature at which the last crystal melted – at this temperature, the vapor bubbles were easily recognized (Figure 1c, Supplementary Figure S1). The second volume estimates were made upon completion of the experiment and quenching to room temperature. We then compared the difference between the two volume estimates for the same feature to estimate the volume change during the experiment. The change in volume of the melt/glass during cooling from the temperature at the completion of the experiment (~1,300 – 1,370°C) to room temperature was negligible compared to the change in volume of the vapor bubble during the experiment and was ignored.
4 Results
4.1 Bubble nucleation episodes during heating experiments
The MI “as found” in plagioclase were completely crystallized, and vapor bubbles could not be distinguished from the solids in the MI before the heating experiments began (Figure 1a, Supporting Figure S1). During heating, the crystals began to melt, and by ~1,200°C a significant portion of the solids (daughter crystals) had dissolved back into the melt, and vapor bubbles became recognizable and could be distinguished from the solids (Figure 1b, Supporting Figure S1). Between 1,225°C and 1,240°C, all solids had melted, and one or more vapor bubbles remained (Figure 1c, Supporting Figure S1). The vapor bubbles tended to become smaller during heating to the temperature at which the last daughter crystals melted, but the vapor bubbles never completely dissolved back into the melt. With continued heating to a temperature that was ~40°C higher than that at which the last crystals melted, an episode of nucleation of multiple, small bubbles occurred at the MI/host interface. We emphasize here that, unlike the vapor bubbles in the olivine-hosted MI reported by Schiavi et al. (2016), the original vapor bubbles in plagioclase-hosted MI did not disappear. The reasons for the difference in behavior is described in section 5.1.
In a second series of experiments (Exp #3-9), images were collected continuously during heating above 1,230°C to document the episodes of bubble nucleation. Accordingly, we heated the samples at 100 °C/min until all of the solids melted (Table 2). From this temperature, the samples were heated at <5°C/min to record all bubble nucleation episodes that occurred. During heating, each sample experienced 2 to 5 episodes of bubble nucleation, with an average of 3. It is notable that the larger MI (≥ 40 µm) experienced an episode of bubble nucleation at around 1,250ºC, while
Accepted
Article
smaller MI (20-30 µm) experienced the first episode of bubble nucleation at around 1,270 ºC. We also tested whether a long-duration isothermal experiment would result in additional episodes of bubble nucleation. In Exp #4, the sample was heated until some MI experienced an episode of bubble nucleation, which occurred at 1,256 ºC for the largest MI (≥ 40 µm). We then maintained the temperature at 1,256 ºC for 5 hours and monitored the MI for any additional episodes of bubble nucleation in the smaller MI. No additional episodes of bubble nucleation or bubble disappearance occurred. In addition, the size of the existing vapor bubbles did not change with time.
Two videos (Movies S1 and S2) were compiled from images captured during an episode of bubble nucleation to illustrate the behavior of MI during bubble nucleation events. Movie S1 documents an episode of bubble nucleation in MI 6_1 and MI 6_2 (Figure 1; Table 2), two average sized (30-40 µm in diameter) MI in our sample. Movie S2 shows an episode of bubble nucleation at 1,240ºC in a large pear-shaped MI. Bubble nucleation occurs at the MI/host interface and the newly formed bubbles migrate towards and join with the original vapor bubble(s) to produce a single, larger vapor bubble (t= 0:02 seconds on Movie S1 and t= 0:04 seconds in Movie S2). With each new episode of bubble nucleation, the newly formed vapor bubbles always nucleate at the same locations on the walls of the MI, rather than at random locations. The spacing of the bubble nucleation sites does not appear to be systematic. The newly formed bubbles coalesce quickly with the preexisting vapor bubble, which appears to be located near the center of the MI (beginning from t= 0:19 seconds on Movie S1 and from t= 0:15 seconds on Movie S2). We emphasize that the MI are three-dimensional objects, and we are viewing them in two-dimensions under the microscope. As such, bubbles that appear to be located in the volumetric center of the MI are actually located at the highest point (top) within the 3-dimensional MI owing to the buoyancy differences between the vapor phase and the melt phase. The fact that the vapor bubble is located near the highest point in the MI can be confirmed by focusing on the Z-(vertical) direction and observing that the bubble image is sharpest when the objective is focused near the top (closest to the crystal surface) of the MI. Bubble coalescence occurs quickly, with most of the newly formed bubbles coalescing with the original vapor bubble(s) in 30-40 seconds. The few remaining smaller bubbles can take up to 2 hours to merge with the larger bubbles. Episodes of bubble nucleation can be repeated at each temperature increment without breaching the MI until a temperature threshold is reached, beyond which no further bubbles form, and/or plagioclase host is observed to melt within the heating stage.
Accepted
Article
The phenomena described above whereby bubbles consistently nucleate at the same location within the inclusion, and smaller bubbles coalesce with the larger bubble, are well known in the fluid inclusion community (Bodnar, 2003). Bubbles tend to nucleate at imperfections on the inclusion walls or, if the inclusion contains multiple phases, on the same particular phase every time. Similarly, the coalescence of multiple smaller bubbles to form one larger bubble is referred to as Ostwald ripening and serves to minimize the surface free energy of the system – i.e., one large phase (bubble) has a smaller surface area compared to multiple smaller phases having the same total volume as the one larger phase. The rate at which the phases coalesce is a function of the diffusivity of that phase within the fluid, and the diffusion rate tends to decrease as the equilibrium radius (volume) is approached, and is described according to:
(1)
where R and Rinitial are the average radius of the bubble at time t and the initial average radius,
respectively,
γ
is the vapor bubble surface free energy, c is the solubility of the vapor (CO2) in themelt,
υ
is the molar volume of CO2, D is the diffusion coefficient for CO2 in the melt, Rg is the gasconstant, T is absolute temperature. According to equation (1), the vapor bubble radius (R)
increases in proportion to t1/3 and thus the rate of bubble growth slows down as the final
equilibrium radius of the single bubble is approached. The relationship between particle (bubble) size, fluid properties, and bubble growth rate is summarized by Finsy (2004).
4.2 Temperature of bubble nucleation episodes
The inferred temperature of entrapment for the MI studied here (~1,230 C) is based on a combination of incremental heating experiments (as per Sinton et al., 1993), phase equilibria calculations (MELTS; Ghiorso and Sack, 1995) using the composition of MI observed for each heating increment, and agreement between compositions of MI with the associated suite of lavas (which lie on the olivine/plagioclase cotectic; Nielsen, 2011). The heating stage experiments described above (section 4.1) support this estimate. Solids in all MI homogenized at 1,232 ± 5 ºC (1σ; Table 2). After all of the solids had melted, the first episode of bubble nucleation occurred at 1,270 ± 16 ºC (1σ; Table 2). In general, the largest MI tended to show bubble nucleation before (at a lower temperature) smaller MI in the same sample (Table 2). The highest temperature at
R3−Rinitial3 = 8
γ
cυ
2D
Accepted
Article
which bubble nucleation occurred was 1,335 ± 32 ºC (1σ; Table 2), which is ~100 ºC higher than the temperature at which the last solid melted. The maximum temperature to which the MI were heated corresponded either to the temperature at which the plagioclase host began to melt in the heating stage (all experiments but Exp #7), or the temperature beyond which it was assumed that no new episodes of bubble nucleation would occur (Exp #7; MI 7_1 and 7_2) based on the absence of nucleation during several tens of degrees of heating beyond the previous temperature of bubble nucleation.
4.3 Change in size of MI and vapor bubble volumes during heating
Prior to experimentation, it was possible to extract the volume of the crystallized portion of the MI by microCT using VGStudioMax 1.2 because of the large density contrast between the plagioclase-host and the crystallized MI (Figure 1a). We note, however, that the volume occupied by the daughter crystals and vapor bubble(s) in the MI before the experiments does NOT represent the volume of the MI because it ignores the portion of the original melt that crystallized on the MI walls during cooling and is now part of the host phase. As reported by Steele-MacInnis et al. (2011), PEC in MI can represent >30 volume percent of the original melt volume that was trapped at elevated PT conditions. The volumes of MI determined before the experiments are reported here, but we emphasize that these values should not be interpreted to represent the volume of the originally trapped melt.
After the heating experiments, the MI contained a homogeneous glass phase (+ vapor bubbles), and the density contrast between the glass in the MI and the plagioclase hosts was insufficient to determine MI volumes using VGStudioMax 1.2 software. As such, the MI volumes at 1,230°C and after the experiment are based on examination of photomicrographs (2D) and invoking various assumptions concerning the MI shape.
Volumes of vapor bubbles were segmented prior to and post experimentation, except those that were < 5µm in diameter, which is the detection limit of VGStudioMax 1.2. for a voxel size of 1.5
µm3. Segmentation consists of selecting an object to retrieve its properties, such as its volume. The
volumes presented here are of two types: 1) volumes of MI calculated from 2D images taken throughout the experiments following the methodology of Moore et al. (2015); 2) 3D volumes extracted from the microCT data for vapor bubbles (Figure 2). It is important to note here that due to the large number of MI within each crystal (n > 50), it was not possible to identify specific MI
Accepted
Article
to analyze both in 2D and 3D. Therefore, the MI analyzed in 2D form a separate dataset from the MI analyzed in 3D.
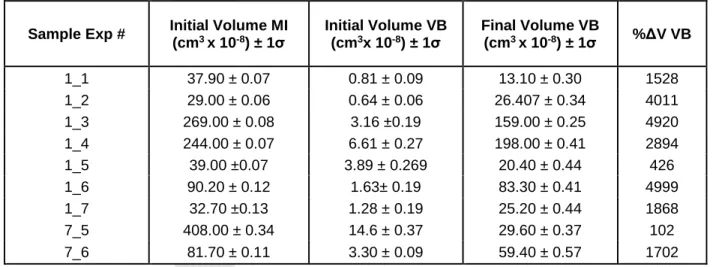
Both the volumes of MI and the vapor bubbles increased progressively during heating beyond the temperature at which all the solids melted. Volume increases were determined by calculating the difference (in %) between the final volume of an object at quench time and either that same volume before the experiment started (for the volumes estimated from 3D microCT analyses), or with that same volume measured after all of the solids had melted (for the volumes estimated from 2D photographs). We note that the total change in volume of the MI could not be determined with confidence when analyzed at room temperature, owing to uncertainties associated with crystallization of melt on the MI walls and poor density contrast between MI and host when analyzed after the experiment, as described in section 4.1. Therefore, the MI volume increase (Table 2) only accounts for the volume increase that occurred between the temperature at which the last solid (daughter mineral) melted and after quenching. From the photographs taken at the temperature at which the last solid melted and after quenching, we calculated an average MI volume increase of 34% (range from 6 to 88%; Table 2). Based on 2D and 3D measurements, volumes of vapor bubbles increased on average by over 1,000% (range from 62 to ~5,000 %; Tables 1 and 2). Volumes determined by measuring the vapor bubbles based on 2D optical appearance (non-microCT volumes) were estimated after the solid phases had dissolved because the vapor bubbles were not easily recognized while the MI were filled with crystals (Figure 1a). The initial volumes thus represent the volume after all the solids have dissolved back into the melt and the final volumes were estimated after quenching to room temperature.
5 Discussion
5.1 Rheological differences between plagioclase, olivine, and other phases
The manner in which plagioclase-hosted MI responded to overpressures generated during heating in this study differs from that reported for olivine-hosted MI (Wallace et al., 2015; Schiavi et al., 2016). As reported by Tullis & Yund (1977), the predominant deformation mechanism of plagioclase at low pressures (<150 MPa) is through the development of micro-fractures, whereas at higher confining pressures dislocation creep becomes the dominant deformation mechanism. In our experiments at 0.1 MPa confining pressure, the pressure at the MI/plagioclase interface equals the internal pressure within the MI (~450 MPa, Drignon et al., 2018), suggesting that plagioclase
Accepted
Article
at the interface is likely to deform plastically through dislocation creep. The pressure (stress) experienced by plagioclase at greater distances from the MI decreases rapidly with increasing distance from the MI and approaches the confining pressure of 0.1 MPa. As such, at distances from the MI where the pressure is <150 MPa, the plagioclase will deform brittlely. In contrast, Schiavi et al. (2016) reported that all irreversible volume changes to MI in olivine were associated with plastic deformation via movement along dislocations.
As noted above, the pressure (stress) in the host mineral surrounding an inclusion with an elevated internal pressure decreases rapidly with distance from the source of the stress (pressure), i.e., the MI. Ferrero & Angel (2018) provide a detailed summary of inclusion-host systematics related to these pressure difference. The distribution of the pressure decreases with distance from the MI, as well as the “stress halo” around the MI is a function of many factors. These include the MI shape and size as well as the rheological properties of the host phase (isotropic versus anisotropic). In all cases, however, a heterogeneous stress environment is established in the host phase when the pressure in the MI is greater than the confining pressure on the host. Pukánszky & Vörös (1996) developed a simplified quantitative model to describe stress distribution around inclusions within a homogeneous matrix. They report that elevated stresses are only experienced in the host in the immediate vicinity of the inclusion, and that the stress decays with distance from the inclusion such that, at a distance equal to the radius of the inclusion away from the inclusion, the stress is equal to the background stress (confining pressure). Following this logic, we have developed a schematic representation of the stress environment within a crystal containing MI of various sizes and shapes (Figure 3). As shown, the size of the stress halo around MI varies in proportion to the size (radius) of the MI and that, when two MI are separated by a distance that is less than the average radius of the two MI, their stress haloes overlap. This heterogeneity in the stress environment, in turn, facilitates deformation of the host phase. We emphasize that the stress distribution shown in Figure 3 is schematic and is included simply to highlight the complexity of the stress distribution patterns that may develop in a crystal in which there are numerous inclusions of varying shape, size, and proximity to each other.
In all cases, the manner in which a given host mineral deforms in response to an increase in the internal pressure of a melt or fluid inclusion is related to the rheology and crystal chemistry of the host mineral. Bodnar (2003) reports that the manner and ease with which fluid inclusions re-equilibrate correlates with, among other factors, the Mohs hardness of the host phase. In this case,
Accepted
Article
the Mohs hardness of anorthite (~6- 6.5) is not significantly different from that for forsterite (~6.5-7), so hardness is not likely to be the main reason for the differing deformational mechanisms observed in this study compared to that reported by Schiavi et al. (2016). However, other rheological and crystal chemical properties of these two phases do show significant differences that likely control the deformation behavior. Among these, olivine is an orthorhombic mineral with a relatively simple crystal structure and bonding environment, whereas anorthite is a triclinic phase with a more complex structure. In addition, olivine shows only poor cleavage whereas anorthite shows perfect cleavage in two orthogonal directions, and Bodnar (2003) reports that minerals exhibiting perfect cleavage, such as fluorite and calcite, tend to re-equilibrate more easily compared to minerals with no or poor cleavage, such as quartz. Perhaps more importantly, the
linear coefficients of thermal expansion of forsterite (a = 11.2 × 10⁻⁶ K-1; b = 16.7 × 10⁻⁶ K-1; c =
14.6 × 10⁻⁶ K-1) are fairly similar, indicating that thermal expansion is nearly isotropic in forsterite
and introduces little stress on the crystal lattice as expansion occurs (Smyth et al., 2000). Conversely, the linear coefficients of thermal expansion of anorthite show large differences and vary with composition and temperature, resulting in significant anisotropy during thermal expansion, with the phase expanding in two crystallographic directions and contracting in the third direction (Tribaudino et al., 2010; Tribaudino et al., 2011). According to Tribaudino et al. (2010)
“The thermal expansion ellipsoid is very anisotropic in all plagioclase, with the direction of maximum thermal expansion (e3) accounting for 70% or more of the total volume expansion”.
As a result of these various rheological and crystal chemical differences, we would expect olivine to deform through plastic deformation associated with movement of dislocations, whereas plagioclase would deform plastically near MI where the pressure (stress) gradient is large, and deform brittlely away from MI where the stress environment is controlled by the anisotropy in thermal expansion behavior (see Table S1 for a summary of the physical properties of minerals that affect re-equilibration behavior of fluid and melt inclusions). These differing deformational behaviors agree with our observations and those reported by Schiavi et al. (2016).
We may extend these principles to predict the manner in which melt (and fluid) inclusions in other minerals might respond to high internal pressures generated during heating experiments. We might expect garnet, which is a hard (6.5-7.5), isometric phase with no cleavage to respond to high internal pressures in FI and MI by deforming plastically by movement along dislocations. Zircon might be expected to behave in a similar manner (H = 6.5-7.5; tetragonal; imperfect cleavage),
Accepted
Article
although zircon does show a coefficient of thermal expansion in the c-direction that is about twice as large as that in the a-direction (Table S1). Conversely, pyroxenes are slightly softer (H = ~5-6.5), have good cleavage in one direction, and show moderate anisotropy in thermal expansion as a function of crystallographic direction. As such, we might expect MI and FI in pyroxene to behave in a manner similar to that observed for plagioclase. Alpha-quartz is a hard (H = 7), hexagonal phase with no cleavage and might be expected to behave in a manner similar to that of olivine or garnet (Table S1). However, many (most?) MI in quartz would have been trapped in the
beta-quartz stability field and would have crossed the α/β transition during cooling to ambient
conditions, and again during heating to homogenization. In the alpha-quartz field, the coefficients of thermal expansion in the a- and c-directions are similar and change in a similar manner with
temperature (Table S1). However, at the α/β transition the thermal expansion coefficients decrease
significantly and remain constant with increasing temperature in the beta-quartz field. While little attention has been focused on the potential impact of the phase transition on the behavior of MI in
quartz, Bodnar et al. (1989) reported that essentially all FI in quartz decrepitated at the α/β
transition during heating.
5.2 Mechanisms of bubble nucleation
Episodes of bubble nucleation coincide with episodes of deformation of the host plagioclase to increase the MI volume, and relieve the stress exerted on the inclusion walls, thus resulting in a pressure decrease in the MI. This episodic stress reduction is accomplished through a combination of two related inelastic, irreversible deformation processes, one involving plastic (ductile) deformation of the plagioclase host and the other involving brittle deformation of the host. The manner in which bubble nucleation occurred, with bubbles first nucleating after ~40°C of heating above the temperature at which the daughter minerals dissolved, followed by additional episodes of bubble nucleation, suggests that the host plagioclase surrounding the MI is initially deforming plastically as the internal pressure increases slowly but continuously. With continued heating beyond the temperature at which the solids dissolve, the host plagioclase continues to deform plastically as the internal pressure increases until a fracture develops in the plagioclase, resulting in an instantaneous and relatively large volume increase and concomitant significant decrease in internal pressure, leading to an episode of bubble nucleation. With continued heating beyond the temperature of the first nucleation event, the internal pressure in the MI again increases and causes
Accepted
Article
the original fracture to propagate and increase the volume further after only a few degrees of additional heating.
The fractures develop in the host plagioclase immediately surrounding the MI, driven by increases in the internal pressure in the inclusion during heating. If some portion of the inclusion contents is lost (separated from) the inclusion during fracturing, this process is referred to as leakage, or partial or total decrepitation in the fluid and melt inclusion literature (depending on how much fluid is lost from the inclusion) and represents one endmember in the overall re-equilibration process (Bodnar, 2003; Nielsen et al., 1998). Leakage and decrepitation result in changes in the composition and/or volume of the remaining fluid in the inclusion. In the present study, although fractures develop in the plagioclase surrounding the MI, the fractures appear to end within a few micrometers of the original MI/host interface (see yellow arrows in Figure 4 and Nielsen et al., 1998). As such, no material is lost (separated) from the MI as a result of fracturing and the melt that enters the newly formed fractures remains in contact with, and is contiguous with, the original melt. The fracturing events observed in this study thus represent an isochemical process whereby the volume of the MI increases without loss of material or change in composition. Note that this does not preclude the possible loss of components via diffusive exchange between the melt and host or external environment, which could not be monitored in this study. Owing to the increased volume and concomitant decreased pressure in the inclusion associated with fracture development, episodes of bubble nucleation are temporally associated with fracturing events. Fracturing of the host is usually initiated at heterogeneities such as pre-existing microcracks, cleavage planes and MI/host interfaces (Tullis & Yund, 1977; Tait, 1992; Mayer & Mayer, 2016), and, in general, larger MI are more likely to decrepitate compared to smaller inclusions at similar conditions (Zhang, 1998; Bodnar, 2003). Note in Figure 4c that two well-developed fractures occur at 180° from each other and appear to be crystallographically controlled, as is often observed with fractures associated with fluid and melt inclusions in quartz that have experienced re-equilibration (Figure 1 of Vityk et al., 1996).
In addition to deformation of the host plagioclase adjacent to the MI, fractures also develop in the host plagioclase at some distance from MI. These fractures, which are oriented in two different orthogonal directions that are consistent with the cleavage directions in plagioclase, are unrelated to the MI and are interpreted to be associated with heterogeneous stress accumulation in the mineral during heating, consistent with the thermal expansion anisotropy of plagioclase. As noted
Accepted
Article
by Tribaudino et al. (2010), anorthitic plagioclase exhibits extreme anisotropy in its thermal expansion properties, and this would lead to the development of significant differential stress within crystals during heating and cause fractures to develop along planes of weakness such as cleavage planes. These fractures are unrelated to the MI re-equilibration unless they occur in close proximity to and intersect a MI.
The third type of fracture observed are those that occur mostly in the glass phase within the MI. These are the ubiquitous “quench cracks” that form when any molten or liquid material,
including silicate melts, molten steel, and other materials, including H2O, are quenched quickly.
The fractures form because stresses generated within the material owing to thermal contraction can no longer relax because the material becomes too viscous to flow (Tait, 1992; Zhang, 1998). Such fractures develop at or slightly below the glass transition temperature during quenching and may extend into the surrounding host phase (see green arrows in Figure 4c). Quench cracks generally start at some discontinuity in materials properties, such as at the interface between the void that was formerly occupied by the vapor bubble or from the MI/host interface. As such, many fractures in the glass appear to extend radially from the void space that formerly contained the vapor bubble (Figure 5b; Supplementary Figure S2).
5.4 Increase in volume of vapor bubble as a result of re-equilibration
If we assume that the MI represent a closed system such that the volume available to the melt + vapor bubble(s) increases during the experiments, but no material is lost, as suggested from observations of the MI during and post-experiments, the expected volume changes may be
calculated based on PVTX data for an H2O-CO2-melt system. As the volume of the MI increases,
the internal pressure in the MI decreases. This, in turn, causes more CO2 to exsolve from the melt
because CO2 solubility is strongly pressure dependent. This model assumes that the volume of the
void space in the plagioclase that is available for the MI to occupy increases as a result of plastic and brittle deformation of the host, and that the mass of the melt phase remains essentially constant during this process. As such, all the volume increase is accommodated by the vapor bubble. We therefore estimate the increase in volume of the MI during re-equilibration and then add this to the original volume of the vapor bubble to estimate the volume percent increase in the size of the bubble as a result of re-equilibration.
Accepted
Article
At 1,230°C and 450 MPa, the solubility of CO2 in an H2O-free basaltic melt is ~2,460 ppm
(Newman and Lowenstern, 2002). We recognize that more recent and detailed models for the
solubility of CO2 in silicate melts are available. However, for this simple example we are only
concerned with the relative changes in CO2 solubility with pressure. As the pressure in the MI
decreases, so too does the solubility of CO2 in the melt. Thus, at 400 MPa and 1,230°C, the
solubility of CO2 in the melt decreases from the initial 2,460 ppm to 2,136 ppm. This difference
represents the amount of CO2 that will exsolve from the melt into the vapor bubble. At these new
PT conditions (1,230°C and 400 MPa), the density of CO2 equals 0.637 g/cm3. Following a mass
and volume balance approach and assuming an initial volume of 100 cm3 (because this is a mass
and volume balance calculation, the volume chosen does not affect the result) and a CO2-saturated
melt with a density of 2.7 g/cm3, the vapor bubble would contain 0.0883 g CO2, and the vapor
bubble volume would be 0.139 cm3. As a first approximation, we assume that the volume of the
melt phase remains constant as the pressure decreases from 450 to 400 MPa and 0.0883 g of CO2
are transferred from the melt into the vapor bubble. As such, the volume of the vapor bubble necessarily equals the increase in volume of the MI required to accommodate the vapor bubble
and melt phase. For this example, the MI volume increases from the initial volume of 100 cm3 to
the new volume of 100.14 cm3, representing a volume increase of 0.14 volume percent. This same
approach was applied to determine the increase in volume of the MI at various other pressures between 450 and 50 MPa, and the estimated increase in the volume of the MI ranges from 0 at 450 MPa to 3.7 volume percent increase at 50 MPa.
As noted in section 4.1, during heating of MI in plagioclase, the vapor bubble did not dissolve back into the melt. Thus, at 1,230°C, the temperature at which all of the daughter minerals and PEC have dissolved back into the melt, the MI still contained a vapor bubble. Based on the results presented above, we have calculated the percent increase in the volume of the vapor bubble for three difference scenarios, assuming that the vapor bubble at 1,230°C represents 1, 2 and 5 volume percent of the MI volume. Accordingly, the vapor bubble that fills 1 volume percent of the MI volume at 1,230°C increases by 184 % as the pressure decreases from 450 to 100 MPa. Similarly, the vapor bubbles that originally occupied 2 and 5 volume percent of the MI at 450 MPa increase by 92 and 37 volume percent, respectively, over this same pressure range. These calculated values are at the lower end of the range in volume percent vapor bubble increase estimated from 2-D and 3-D observations of the MI before and after the experiments (Figure 6). This is because they are
Accepted
Article
based only on the vapor bubble size required to contain the calculated amount of CO2 with the
known CO2 density at the various PT conditions and do not take into account the additional volume
increase associated with deformation of the host plagioclase. 5.5 PTt History of MI Following Entrapment
At the time of entrapment, we can assume that the pressure in the MI (internal pressure) is the same as the confining pressure on the host phase. We estimate this pressure to be ~ 450 MPa based
on CO2 concentrations in the MI (Drignon et al., 2018). Decreasing temperature and pressure
during magma ascent to the seafloor leads to modifications within the MI. Vapor bubbles form through volatile exsolution from the melt, likely due to PEC formation as well as from cooling and depressurization during magma ascent. The sample studied here erupted and quenched on the seafloor at 32 MPa (Sprtel, 1997), which represents the confining pressure at which the MI were naturally quenched. As the confining pressure decreased from 450 MPa to 32 MPa, relaxation (elastic volume changes) would have occurred as the PT conditions changed during ascent. The volume of the host and its contained MI would then change by some amount that reflects the combination of volume decrease owing to the decreased temperature and volume increase resulting from the decreasing confining pressure. In general, the volumes of the host and MI would decrease during ascent because volume changes associated with thermal expansion are typically about an order of magnitude larger than volume changes associated with pressure fluctuations over reasonable ranges of P and T in the crust and upper mantle. Once retrieved from the seafloor and brought to the laboratory, the confining pressure of the quenched plagioclases became 0.1 MPa.
During experimentation at 0.1 MPa, we submitted hosts and MI to overheating for various amounts of time. At ~1,230 ºC, all solid phases dissolved but the vapor bubbles remained. At ~1,270 ºC, microcracks began to develop along cleavage planes as the host plagioclase began to deform brittlely owing to the thermal expansion anisotropy of the host combined with the stress heterogeneity within the plagioclase crystal. Fracturing in the vicinity of MI leads to an increase
in MI volume and concomitant decrease in pressure followed by CO2 exsolution and bubble
nucleation (Figure 7a).
As the temperature was increased above ~ 1,270ºC, additional increments of fracturing and expansion occurred, leading to a decrease in the internal pressure in the MI. This in turn, led to additional episodes of bubble nucleation, migration, and coalescence (Figure 7b). Once a nucleation site appeared, bubbles nucleated at this same location each time that new bubbles
Accepted
Article
formed. Newly nucleated bubbles coalesced quickly with the original vapor bubble and resulted in an increase in the vapor bubble volume (Movies S1 and S2). Based on isochemical behavior
calculations, the vapor bubbles should only increase in volume by a ~101 to 102 volume percent.
Our volume estimates indicate vapor bubble volume increases ranging from 62% to >1,000% (Figure 6b) due to plagioclase deformation. The MI volume also increased throughout the experiments. The calculations made in section 5.4 revealed that MI volume increases should be on the order of ~3 to >40 volume %. These calculated values are in general agreement with the percent volume increase shown in Figure 6a, most of which are ≤40 volume percent. The calculated and observed increases in MI volume shown on Figure 6a are thus in reasonable agreement, given the uncertainties associated with measurements of the MI and vapor bubble before and after the experiment, combined with additional unknown uncertainties associated with the assumption that
the vapor bubble contains pure CO2.
6. Broader Implications
As the application of MI to study magmatic processes has increased in recent years, researchers have begun to study MI in a wider range of host phases. Previously, most studies of mafic systems have focused on MI in olivine (Wallace et al., 2021), and studies of more felsic systems have focused mostly on MI in quartz (Bodnar and Student, 2006). During the past few decades, studies of MI in zircon (Thomas et al., 2003), orthopyroxene and clinopyroxene (Severs et al., 2009), plagioclase (Nielsen 2017; Drignon et al., 2018), nepheline (Fedele et al., 2003), and other host phases have become more common. And, while the re-equilibration behavior of MI in olivine (Danyushevsky et al., 2000) and in quartz (Severs et al., 2007) are reasonably well understood, less is known about the integrity and re-equilibration behavior of MI in other phases. Here, we document the mechanisms associated with re-equilibration of MI in plagioclase and show that the re-equilibration behavior is related to the crystal chemical and rheological properties of the host phase. As such, the results of this study, combined with available data for the crystal chemical and rheological properties of other phases, brings us step closer to understanding how MI in these other phases might respond to increased internal pressures generated during microthermometric experiments. However, additional studies of suites of well-characterized MI in these other host phases are needed to better understand the mechanisms associated with re-equilibration and, more
Accepted
Article
importantly, chemical, and physical features that might be examined to determine if, and to what extent, the MI have re-equilibrated.
7. Conclusions
We conducted experiments on plagioclase-hosted MI in order to understand the re-equilibration behavior of MI during laboratory heating. During laboratory heating the internal pressure in the MI increases. To reduce the pressure in the MI, plagioclase host surrounding the MI undergoes both ductile and brittle deformation to increase the volume of the MI. The decreased pressure in the MI, in turn, leads to volatile exsolution from the melt. With each heating increment above the temperature at which the daughter minerals dissolve, the pressure increases, leading to additional deformation (volume expansion) and an associated decrease in the internal pressure, and further exsolution of volatiles from the melt. Episodes of bubble nucleation start at ~40°C above the MI entrapment temperature (assumed to be equal to the temperature at which the last daughter mineral dissolves) and the MI volume increase is manifest as a larger vapor bubble after each increment of overheating because, to a first approximation, all of the system volume expansion is accommodated by the bubble volume.
The manner in which the host surrounding an inclusion responds to increased pressure is a function of the rheological properties of the host phase. Olivine responds to the increased pressure by undergoing dominantly plastic deformation associated with movement along dislocations, reflecting the fact that olivine is a hard mineral with only poor cleavage and relatively uniform thermal expansion behavior in all directions. Conversely, anorthitic plagioclase is softer than olivine, exhibits two perfect cleavage directions and shows significant thermal expansion anisotropy. As a result, a heterogeneous stress environment develops around pressurized MI in plagioclase, and the crystal responds through a combination of brittle and plastic deformation to increase the MI volume and reduce the pressure (stress) differential between the MI and host.
Acknowledgments, Samples, and Data
This material is based in part on work supported by the National Science Foundation under grant numbers grants OCE-1634206 and OCE-1634211. We are grateful to Federica Schiavi (LMV) for constructive discussions on her experimental procedure as well as on this study. Discussions and comments from Adam Kent and David Graham (OSU) were appreciated. This manuscript was greatly improved as a result of review comments of David Neave, Maxim Portnyagin, and an anonymous reviewer. We also thank Marie Edmonds and Chris Micucci for editorial handling of