HAL Id: hal-00295419
https://hal.archives-ouvertes.fr/hal-00295419
Submitted on 8 Apr 2004
HAL is a multi-disciplinary open access
archive for the deposit and dissemination of
sci-entific research documents, whether they are
pub-lished or not. The documents may come from
teaching and research institutions in France or
abroad, or from public or private research centers.
L’archive ouverte pluridisciplinaire HAL, est
destinée au dépôt et à la diffusion de documents
scientifiques de niveau recherche, publiés ou non,
émanant des établissements d’enseignement et de
recherche français ou étrangers, des laboratoires
publics ou privés.
fluorescence instrument for the measurement of OH
radicals in the atmosphere
W. J. Bloss, J. D. Lee, C. Bloss, D. E. Heard, M. J. Pilling, K. Wirtz, M.
Martin-Reviejo, M. Siese
To cite this version:
W. J. Bloss, J. D. Lee, C. Bloss, D. E. Heard, M. J. Pilling, et al.. Validation of the calibration
of a laser-induced fluorescence instrument for the measurement of OH radicals in the atmosphere.
Atmospheric Chemistry and Physics, European Geosciences Union, 2004, 4 (2), pp.571-583.
�hal-00295419�
www.atmos-chem-phys.org/acp/4/571/
SRef-ID: 1680-7324/acp/2004-4-571
Chemistry
and Physics
Validation of the calibration of a laser-induced fluorescence
instrument for the measurement of OH radicals in the atmosphere
W. J. Bloss1, J. D. Lee1, C. Bloss1, D. E. Heard1, M. J. Pilling1, K. Wirtz2, M. Martin-Reviejo2, and M. Siese3
1Department of Chemistry, University of Leeds, Woodhouse Lane, Leeds, LS2 9JT, UK
2Fundaci´on CEAM, EUPHORE Laboratories, C/ Charles Darwin 14, Parque Technol´ogico, 46980 Paterna, Valencia, Spain 3Institut f¨ur Chemie und Dynamik der Geosph¨are, Institut II: Troposph¨are, Forschungszentrum J¨ulich, D-52425 J¨ulich,
Germany
Received: 28 October 2003 – Published in Atmos. Chem. Phys. Discuss.: 28 November 2003 Revised: 27 February 2004 – Accepted: 9 March 2004 – Published: 8 April 2004
Abstract. An assessment of the accuracy of OH
concen-trations measured in a smog chamber by a calibrated laser-induced fluorescence (LIF) instrument has been made, in the course of 9 experiments performed to study the photo-oxidation of benzene, toluene, 1,3,5-trimethylbenzene, para-xylene, ortho-cresol and ethene at the European Photoreactor facility (EUPHORE). The LIF system was calibrated via the water photolysis / ozone actinometry approach. OH concen-trations were inferred from the instantaneous rate of removal of each hydrocarbon species (measured by FTIR or HPLC) via the appropriate rate coefficient for their reaction with OH, and compared with those obtained from the LIF sys-tem. Good agreement between the two approaches was found for all species with the exception of 1,3,5-trimethylbenzene, for which OH concentrations inferred from hydrocarbon re-moval were a factor of 3 lower than those measured by the LIF system. From the remaining 8 experiments, an over-all value of 1.15±0.13 (±1σ ) was obtained for [OH]LIF
/ [OH]HydrocarbonDecay, compared with the estimated
uncer-tainty in the accuracy of the water photolysis / ozone acti-nometry OH calibration technique of 26% (1σ ).
1 Introduction
Accurate measurements of trace gas concentrations are es-sential to study the chemistry of the Earth’s atmosphere. Hy-droxyl radicals (OH) are the principal oxidising species in the troposphere, and dominate the daytime removal of most volatile organic compounds (VOCs). Reaction with OH thus governs the atmospheric lifetime of many species, and hence their potential to contribute to (for example) global warming and ozone depletion. The OH-initiated oxidation of hydro-carbons and CO in the presence of oxides of nitrogen also Correspondence to: W. J. Bloss
leads to the generation of ozone, a constituent of photochem-ical smog. As the reactivity of OH is high, its concentra-tion is low (of the order of 0.04–0.2 pptv in the sunlit tro-posphere) and chemical lifetime is short (0.1–1 s); OH con-centrations are therefore determined by local chemical pro-cesses rather than transport, and their in situ measurement can be used to validate numerical models of tropospheric chemistry. Accurate measurement of atmospheric hydroxyl radical concentrations has been a goal of atmospheric scien-tists for three decades, following recognition of the central importance of OH radicals in tropospheric oxidation chem-istry (Levy, 1971).
In-situ measurements of OH concentrations have been per-formed using radiometric, wet chemical and spin trapping techniques, however most recent measurements have been performed by the techniques of DOAS (Differential Opti-cal Absorption Spectroscopy), LIF (Laser Induced Fluores-cence) and CIMS (Chemical Ionisation Mass Spectrometry) (Heard and Pilling, 2003). CIMS and LIF are not absolute measurement techniques, and so require determination of the instrument response factor using an OH calibration source. The production of a well-known concentration of OH radi-cals at the instrument inlet under ambient atmospheric condi-tions presents a considerable challenge, and is critical to the accuracy of the current generation of LIF- and CIMS-based ambient OH measurement systems.
A series of photosmog experiments has recently been per-formed at the European Photoreactor Facility (EUPHORE), in Valencia, Spain, to study the oxidation of selected aro-matic (and related) hydrocarbon species under polluted con-ditions. Instrumentation deployed included FTIR and HPLC for monitoring of hydrocarbon concentrations, and LIF for direct in situ measurement of OH concentrations. Under the conditions of the experiments, the dominant chemical re-moval route for the primary (initial) hydrocarbon species was by reaction with OH; thus OH concentrations could be cal-culated throughout each experiment, from the instantaneous
rate of hydrocarbon decay via the relevant rate coefficient for reaction with OH, and compared with those obtained from the LIF instrument. In this way the accuracy of the LIF in-strument measurements may be assessed.
The water photolysis/ozone actinometry approach used to calibrate the EUPHORE LIF system is commonly used in the calibration of field instruments for the measurement of am-bient OH by LIF (Bloss et al., 2003; Holland et al., 2003; Kanaya et al., 2001). In this paper we present an assess-ment of the accuracy of this calibration based upon hydrocar-bon decays measured in 9 photo-oxidation studies performed upon benzene, toluene, 1,3,5-trimethylbenzene, ethene, para-xylene and ortho-cresol.
2 The OH LIF system: description
The LIF system installed at the EUPHORE facility has been described in detail previously (Becker, 1999; Siese et al., 2001), therefore only a brief description of the instrument is given here. OH concentrations are measured by laser induced fluorescence at low pressure – the Fluorescence Assay by Gas Expansion (FAGE) technique (Hard et al., 1984): Am-bient air is drawn through a small orifice into a fluorescence chamber, maintained at low pressure. A pulsed laser beam is directed through the gas expansion, leading to excitation of OH radicals through the (0,0) band of the (A26+←X25i) transition near 308 nm. On-resonance (308 nm) fluorescence accompanying the subsequent relaxation of the OH (A26+)
is detected orthogonally to the gas expansion and excita-tion beam. Use of the low pressure chamber extends the OH fluorescence lifetime beyond the duration of the laser pulse, thus retrieval of scattered laser light can be minimised through temporal gating of the detection system. A high pulse-repetition-frequency (PRF), low pulse energy excita-tion beam is used to avoid optical saturaexcita-tion effects and minimise photolytic generation of OH from other chemical species. Excitation at 308 nm with on-resonance fluores-cence monitoring is used rather than the alternative diagonal (1,0) fluorescence scheme with excitation near 282 nm in or-der to minimise generation of OH through the photolysis of ozone and subsequent reaction of O(1D) atoms with water vapour (Chan et al., 1990).
The EUPHORE LIF system uses a copper vapour laser pumped dye laser system (Oxford Lasers ACL 35/Lambda Physik FL3001) to generate 308 nm radiation at a PRF of 8.5 kHz. The laser power entering the fluorescence cell is typically 10–15 mW. A 0.38 mm diameter conically shaped nozzle is used to sample air from the EUPHORE chamber into the fluorescence cell, comprising a 100 mm aluminium cube maintained at a pressure of 1.6 mbar. Fluorescence is collimated through 75 mm optics and directed onto a micro-channel plate photomultiplier tube detector through a 308 nm bandpass interference filter and an additional solar-blind fil-ter. A concave mirror positioned opposite the detection axis
approximately doubles the solid angle of fluorescence col-lected. Photon counting is used to monitor the amplified signal from the PMT, which is subsequently normalised by measured excitation laser power.
Contributions to the measured signal arise from OH LIF, and also from scattered laser and solar light, and detector dark current. Contributions from the latter sources are sub-tracted: Scattered laser light is measured by performing al-ternating measurements on- and off- the OH line; the latter containing no contribution from OH LIF. Scattered solar ra-diation is measured during a second photon counting win-dow, several microseconds after each excitation laser pulse, at which time all OH LIF has decayed away - the contribution to the total signal from scattered sunlight is subtracted in this way, rather than through the off-line point, to avoid errors arising from changes in sunlight during the acquisition cy-cle. The on-line off-line cycle, yielding a single OH concen-tration measurement, typically takes 60–90 s, with variability between cycles being less than 5%.
3 The OH LIF system: calibration
LIF is not an absolute technique, thus calibration of the in-strument response factor is required. The LIF signal per unit time (S) is proportional to the OH concentration and excita-tion laser power (Pwr), with the constant of proportionality or calibration constant C dependent upon factors such as the Einstein coefficients for the particular OH transition in ques-tion, rotational populaques-tion, the overlap of the OH Doppler and laser spectral line widths and fluorescence collection ef-ficiency:
S = C × Pwr× [OH] (i) While the value of C is in principle calculable (Stevens et al., 1994; Holland et al., 1995), in practice calibration with a known concentration of OH is required for accurate measure-ments. As noted above, during ambient measurements the total signal recorded contains contributions from scattered solar and laser light and detector dark current; S in Eq. (i) refers solely to the contribution from OH LIF.
The response of the EUPHORE LIF system was calibrated by the water photolysis – ozone actinometry method (As-chmutat et al., 1994). The calibration source consists of a 20 mm internal diameter by 600 mm length quartz tube, through which 20 slm (standard litres per minute) of humidi-fied air was flowed, under approximately laminar conditions. The 184.9 nm radiation from a mercury pen-ray lamp was used to photolyse the water and oxygen within the tube, lead-ing to the generation of OH, HO2and O3according to
reac-tions (1)–(4), below:
H2O + hν → OH + H (1)
O2+hν → O + O (3)
2 × O + O2+M → O3+M (4)
After passing the photolysis region the calibration flow im-pinges upon the nozzle of the LIF system, and a fraction of the total flow (ca. 1 slm) is drawn into the instrument. The remainder of the flow is directed to an ozone monitor and subsequently vented. As the humidity of the air entering the flow reactor is known (measured using a chilled-mirror dew-point hygrometer) the concentration of OH or HO2radicals
formed can be calculated from the measured ozone concen-tration and the relevant cross sections and quantum yields.
A complication arises due to the radial distribution of the axial flow velocity within the laminar flow tube: Air in the centre of the tube travels faster than air at the edges, and so spends less time in the photolysis region, and thus has lower OH, HO2and O3 concentrations. The LIF nozzle samples
from the centre of the flow tube, while the ozone concen-tration measured is the average of the remaining flow – a correction (the profile factor, P ) must therefore be applied. For perfect laminar flow, with a parabolic velocity profile, and zero sample withdrawal by the LIF nozzle, the correction would be a factor of 2; for the EUPHORE calibration system a value of P =(1.85+/−0.09) has been measured (Siese et al., 2001).
The OH (or HO2) concentration present at the LIF system
sampling nozzle can then be calculated via Eq. (ii):
[OH]=[O3] × [H2O] × σH2O×8OH P × [O2] ×σO2×8O3
(ii)
where 8OH and 8O3, the quantum yields for production of
OH and (ultimately) O3 from water and oxygen
photoly-sis at 184.9 nm, have values of 1 (Sander et al., 2003) and 2 (Washida et al., 1971), respectively, P is the profile fac-tor referred to above, and σ (H2O) and σ (O2) are
absorp-tion cross secabsorp-tions for water and oxygen (respectively) at 184.9 nm. A value of (7.1±0.2)×10−20 molecule−1cm2 is used for σ (H2O), being the mean of the determinations
of Cantrell et al. (1997), Hofzumahaus et al. (1997) and Creasey et al. (2000). The emission spectrum of the 184.9 nm band from mercury pen-ray lamps overlaps with several features in the Schumann-Runge band of the O2 spectrum
(Lanzendorf et al., 1997). Under typical oxygen column densities employed for LIF calibration (ca. (0.5–1)×1019 molecule cm−2), some absorption features within the lamp
spectrum are saturated while others are not; thus the ap-propriate value of σ (O2)for calculation of O2photolysis in
Eq. (ii) is dependent upon the actual oxygen column used. Moreover, the emission spectrum varies from lamp to lamp, and is dependent upon operating conditions (e.g. tempera-ture, power) (Lanzendorf et al., 1997; Creasey et al., 2000). For the pen-ray lamp used in the EUPHORE LIF system, a value of σ (O2)=(1.23±0.05)×10−20molecule−1cm2was
determined under the actual operating conditions of oxygen
column, lamp current and cooling flow employed in the cali-bration system.
Care is taken to work with sufficiently low photolysis flux that reactions between hydroxyl or hydroperoxy radicals and ozone (5–8, below) do not significantly alter their concen-trations after generation and prior to sampling into the LIF cell:
OH + HO2→H2O + O2 (5)
OH + O3→HO2+O2 (6)
OH + OH → H2O + O/H2O2 (7)
HO2+O3→OH + 2O2 (8)
Typical OH/HO2 and O3 concentrations generated were
7×10⁸molecule cm−3and 7×10¹⁰molecule cm−3, respec-tively, with a flow tube residence time of less than 65 ms (between the photolysis region and sampling nozzle). Un-der these conditions, the fraction of OH lost through reac-tions (5), (6) and (7), and formed through reaction (8), is calculated to be equivalent to 0.5, 0.04, 0.02 and 0.001% (re-spectively) of the initial OH concentration.
The OH LIF signal is expected to decrease with increasing humidity in the sampled air, as H2O is an extremely efficient
quencher of electronically excited OH radicals: Relative val-ues of k for the reaction
OH(A26+,v0=0) + X → OH(X25i,v00) +X (9) where X=N2, O2, H2O are 1:4:20 at 294 K (Bailey et al.,
1997, 1999), which equates to a calculated reduction in the total OH fluorescence quantum yield of approximately 7% from a totally dry atmosphere to one with 10 000 ppmv (1%) water vapour (typical of continental boundary layer air). However, the sensitivity of OH LIF systems has in some cases been observed to decrease with increasing humidity to a greater extent than can be explained by OH quench-ing alone (Holland et al., 1995; Hofzumahaus et al., 1996; Creasey et al., 1997a). The reduction in sensitivity (of up to 50% between 1000 ppmv (0.1%) and 10 000 ppmv (1%) H2O) has been attributed to the formation of water clusters in
the supersonic gas expansion, which scavenge OH and HO2
(Holland et al., 1995): Temperatures in the supersonic expan-sion, which extends for a few tens of mm from the sampling nozzle into the fluorescence chamber, briefly dip to ca. 25 K; however the air rapidly warms – the OH rotational temper-ature at the point of LIF excitation is ca. 220 K (Creasey et al., 1997b). The humidity effect can be accounted for in the case of most tropospheric measurements by performing cali-brations at ambient water vapour concentrations. In the EU-PHORE chambers, absolute humidity is usually maintained at levels between 100 and 200 ppmv, much lower than ambi-ent boundary layer values, in order to minimise interference in the FTIR spectra. Calibrations performed at this humidity are noisy (due to the low [OH] formed; Eq. ii), so routine
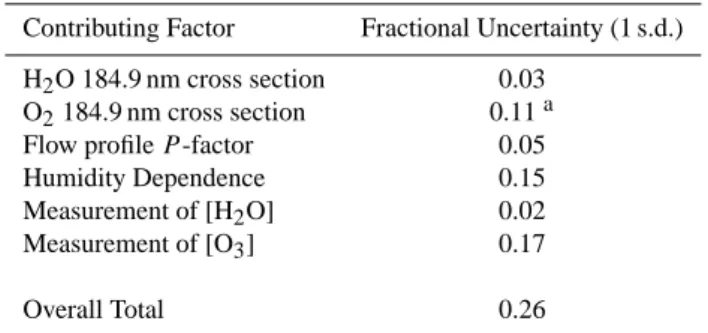
Table 1. Contributions to overall uncertainty in the OH calibration.
Contributing Factor Fractional Uncertainty (1 s.d.) H2O 184.9 nm cross section 0.03
O2184.9 nm cross section 0.11a
Flow profile P -factor 0.05 Humidity Dependence 0.15 Measurement of [H2O] 0.02
Measurement of [O3] 0.17 Overall Total 0.26
Notes a: Combined statistical uncertainty in the measurement of
σ(O2)for the particular lamp used (4%), and estimated accuracy
of the cross-section measurement procedure (10%) from Siese et al. (2001) and Creasey et al. (2000).
calibrations performed between photosmog experiments to check upon instrument performance were conducted at ca. 900 ppmv H2O. In separate experiments the calibration
con-stant was measured at water mixing ratios between 150 and 900 ppmv, and was found to be constant to within ±15%. Holland et al. (2003) report that nozzle design and diame-ter appear to be critical factors in dediame-termining the anoma-lous humidity dependence to the instrument calibration; us-ing a shaped nozzle similar to that employed at EUPHORE (0.4 mm diameter) they observed a humidity dependence to the calibration constant consistent with the H2O quenching
mechanism alone.
The overall uncertainty in the calculated OH concentra-tion (Eq. ii) and hence the instrument calibraconcentra-tion arises from the various factors described above, and is summarised in Table 1. Addition of the various contributions in quadra-ture yields an overall uncertainty (1σ ) in the calculated [OH] from the calibration source of 26%, with the dominant fac-tor being the uncertainty in the measurement of ozone con-centration, in particular noise in the zero measurement of the ozone instrument (Ansyco GmbH model 41 M) which at typ-ical values of ±0.5 ppbv is significant compared to the sured ozone mixing ratios of 3–4 ppbv. Individual OH mea-surements will have a greater uncertainty, as their precision will be reduced by factors such as corrections for scattered solar and laser light, and the repeatability of excitation laser wavelength selection between on-line and off-line measure-ments – typically better than 5%.
4 Experimental
Measurements were performed in the course of the EX-ACT (Effects of the Atmospheric Oxidation of Aromatic Compounds in the Troposphere) programme at the Euro-pean Photoreactor facility (EUPHORE) situated in Valen-cia, Spain during September 2001 and July 2002. The
EX-ACT campaign and EUPHORE facility are detailed fully in Pilling (2003) and Becker (1997)/Klotz et al. (1998), re-spectively; only a brief overview and description of per-tinent instrumentation is given here. The EXACT project aimed to elucidate the oxidation mechanisms for benzene, toluene, the xylenes and 1,3,5-trimethylbenzene, in the light of estimates that aromatic species could account for up to 30% of the total anthropogenic hydrocarbon oxi-dation initiated ozone production under European condi-tions (Derwent et al., 1996). The project combined lab-oratory studies and theoretical work to generate oxida-tion mechanisms for the target species within the Master Chemical Mechanism (MCM, http://www.chem.leeds.ac.uk/ Atmospheric/MCM/mcmproj.html), with subsequent smog chamber experiments to test and refine the mechanisms. The data reported in this paper were acquired in the course of these validation experiments.
The EUPHORE chambers consist of two 195 m3volume hemi-spherical bags formed from FEP-teflon foil (with trans-mission greater than 80% between 280 and 640 nm) illu-minated by natural sunlight. Hydraulically actuated steel housings exclude sunlight and protect the chambers from inclement weather when not in use. Chamber pressure is maintained at 100–200 Pa above ambient, and a floor cool-ing system is used to counteract solar heatcool-ing durcool-ing experi-ments. The chamber temperature is registered and approx-imately follows the ambient temperature (typically main-tained at 25–35◦C). The chambers are filled with ambient air, which is treated by an air purification and drying sys-tem to remove NOy(<1 ppbv), H2O (<200 ppmv) and
non-methane hydrocarbons (<0.2 ppbv). Chamber mixing time is 2 min (fan assisted). Chamber A, used for all the experi-ments reported in this study, was equipped with the LIF sys-tem for OH radical measurement, a long-path FTIR inter-ferometer system (Nicolet Magna 550, 326.8 m absorption path length; 1 cm−1 resolution) and off-line RP-HPLC sys-tem (HP 1050 series isocratic pump with diode array detector (HP 1100) and fluorescence detector HP1046A). Sampling of the polar ring retaining compounds for subsequent anal-ysis by HPLC was performed using a double coil stripping system directly connected to the chamber. Additional instru-mentation in chamber A included various ancillary monitors for O3, NOx, J (NO2)and meteorological parameters. For
all the experiments discussed in this paper, hydrocarbon con-centrations were monitored by FTIR; in the case of o-cresol measurements were made by HPLC also.
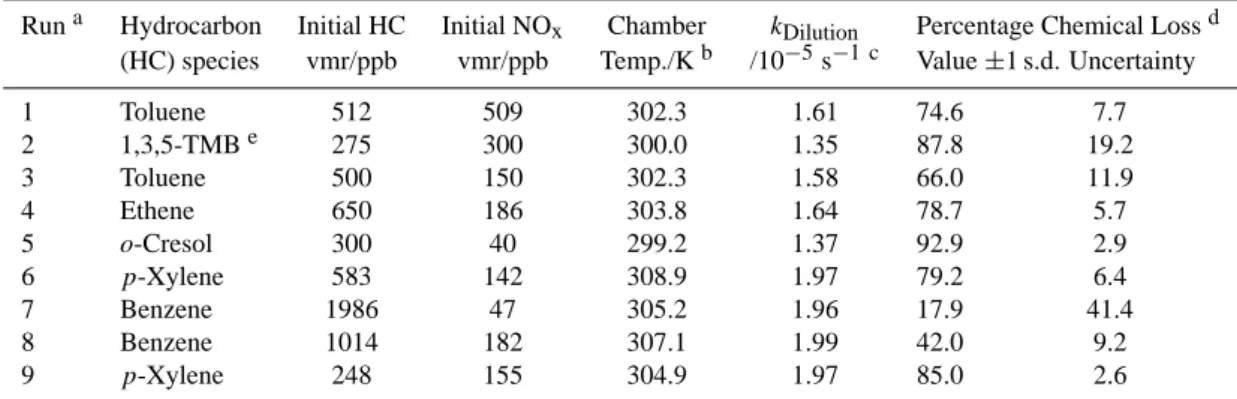
The conditions for each experiment are outlined in Table 2. Experiments were conducted by introducing the hydrocarbon species of interest together with the required concentration of NO/NO2, allowing 10 min for mixing to occur, and then
initi-ating the radical oxidation chemistry by opening the chamber covers to admit sunlight. During the experiments a certain amount of air from the chamber is lost through small leaks and withdrawal of air samples for analysis; clean air is added to compensate for this and some dilution of the reactants and
Table 2. Conditions for the photo-oxidation experiments and importance of chemical loss relative to dilution.
Runa Hydrocarbon Initial HC Initial NOx Chamber kDilution Percentage Chemical Lossd
(HC) species vmr/ppb vmr/ppb Temp./Kb /10−5s−1 c Value ±1 s.d. Uncertainty 1 Toluene 512 509 302.3 1.61 74.6 7.7 2 1,3,5-TMBe 275 300 300.0 1.35 87.8 19.2 3 Toluene 500 150 302.3 1.58 66.0 11.9 4 Ethene 650 186 303.8 1.64 78.7 5.7 5 o-Cresol 300 40 299.2 1.37 92.9 2.9 6 p-Xylene 583 142 308.9 1.97 79.2 6.4 7 Benzene 1986 47 305.2 1.96 17.9 41.4 8 Benzene 1014 182 307.1 1.99 42.0 9.2 9 p-Xylene 248 155 304.9 1.97 85.0 2.6 Notes a: Chronological order in which experiments were performed, No.’s 1–5 during campaign 1, 6–9 during campaign 2. b: Mean air temperature inside the chamber during the sunlit period.
c: Derived from SF6decay.
d: Fraction of the total hydrocarbon removal which arose from chemical reaction (balance from dilution). e: Trimethylbenzene.
Table 3. Breakdown of chemical loss for each hydrocarbon species.
Run Hydrocarbon Peak ozone/ppbb Percentage of hydrocarbon loss by reaction with species OH O3 NO3 O(3P) 1 Toluene 416 99.96 0.02 0.01 0 2 1,3,5-TMB 396 99.95 0.02 0.02 0.01 3 Toluene 255 99.97 0.02 0.02 0 4 Ethene 446 69.28 30.72 0 0 5 o-Cresol 107 12.04 0.05 87.91 0 6 p-Xylene 319 99.91 0.05 0.04 0 7 Benzene 177 99.92 0.05 0.03 0 8 Benzene 222 99.95 0.03 0.02 0 9 p-Xylene 362 99.92 0.05 0.03 0 Note a Ethene 446 83.55 16.45 0 0 Note b o-Cresol 107 98.30 0.04 1.67 0 Notes: Rate constants for ethene taken from Atkinson et al. (2002); for all other species from Calvert et al. (2002). a: Correcting for the time-dependent growth in [O3] rather than using the peak value.
b: Correcting [NO3] for effect of reaction with cresol and other oxidation products via MCM simulation; see text.
products occurs as a result. To measure the dilution rate SF6
was added to the reaction mixture as an inert tracer in each experiment and its concentration was monitored by FTIR. The average calculated loss rate of SF6 over the course of
each experiment (given in Table 2) was used as to calculate the contribution of dilution to the reduction in concentration of each hydrocarbon species.
In addition to dilution, removal of the primary hydro-carbon species (benzene, toluene, 1,3,5-trimethylbenzene, ethene, para-xylene and ortho-cresol) could in principle oc-cur via photolysis, heterogeneous uptake and chemical re-action. Photolysis is unimportant for monocyclic aromatic hydrocarbons in the troposphere as their absorption spectra
do not extend into the regions of the spectrum where signifi-cant actinic flux is encountered at low altitudes (σ <1×10⁻¹⁹ molecule−1cm2at 285 nm) and decreasing to higher wave-lengths for all aromatic species considered here (Calvert et al., 2002; Etzkorn et al., 1999). Similar comments apply to the photochemistry of ethene (Atkinson, 1990). The partic-ulate loading of the purified air used to fill the EUPHORE chambers is low (<50 particles cm−3) and aerosol yields from the monocyclic aromatic species considered are low un-der the conditions of the EXACT experiments (Pilling, 2003) thus heterogeneous losses are not expected to be a significant sink for the primary hydrocarbon species considered here; rather chemical reaction dominates their active removal.
-2 -1 0 1 2 3 4 5 10 11 12 13 14 15 16 17 Time / hrs UT [O H ] / 1 0 7 m o le c u le c m -3 0 200 400 600 800 1000 1200 1400 B e n ze n e vm r / p p b v -2 -1 0 1 2 3 4 5 10 11 12 13 14 15 16 17 Time / hrs UT [O H ] / 1 0 7 m o le c u le c m -3 0 200 400 600 800 1000 1200 1400 B e n ze n e vm r / p p b v
Fig. 1. Effect of lengthening the analysis period from successive hydrocarbon measurement points (1-point, top panel) to every fifth
hydrocar-bon measurement point (5-point, lower panel). Scatter and noise are greatly reduced in the latter instance. Data for benzene, experiment (8). Key: Benzene mixing ratio, blue diamonds; individual [OH] from LIF, small red circles; [OH] inferred from benzene decay; blue circles; average LIF [OH] over the corresponding interval between benzene measurements, black/red squares.
In the lower atmosphere, reaction with O3, OH, NO3and
O(3P) have been identified as the key processes which initi-ate the oxidation of aromatic hydrocarbons (Atkinson, 1994). Table 3 lists the percentage contribution to the removal of each hydrocarbon species for reaction with O3, OH, NO3and
O(3P), under the conditions of the experiments performed. Values were calculated to give a “worst case” value from the perspective of the importance of reaction with OH: While mean OH concentrations (as measured by LIF) were used, concentrations of O3, NO3 and O(3P) were all upper
lim-its: The peak ozone concentration for each experiment is used, while in practice the mean ozone concentration is much lower. NO3concentrations were calculated from simple
pho-tochemical steady state (formation via NO2+O3; loss via
photolysis), while in practice NO3 concentrations will be
lowered by reaction with NO, NO2, hydrocarbons etc. O(3P)
concentrations were calculated from measured [O3] and
cal-culated J (O3), assuming that all O(1D) was quenched to
0 5 10 15 20 9 10 11 12 13 14 15 16 17 0 150 300 450 600 -4 0 4 8 12 16 9 10 11 12 13 14 15 16 -80 0 80 160 240 320 0 4 8 12 16 20 9 10 11 12 13 14 15 16 0 100 200 300 400 500 0 4 8 12 9 10 11 12 13 14 15 16 0 250 500 750 0 4 8 12 10 11 12 13 14 0 125 250 375 0 4 8 12 10 11 12 13 14 0 125 250 375 0 6 12 18 24 10 11 12 13 14 15 16 17 0 150 300 450 600 -5 0 5 10 15 20 10 11 12 1 3 14 15 16 -500 0 500 100 0 150 0 200 0 0 5 10 15 20 25 10 11 12 13 14 0 60 120 180 240 300 1: Toluene #1 2: 1,3,5-TMB 3: Toluene #2 4: Ethene
5a: o-Cresol FTIR 5b: o-Cresol HPLC
6: p-Xylene #1 7: Benzene #1 8: Benzene #2 9: p-Xylene #2
Time / hrs UT
Time / hrs UT
[O
H
]
/
1
0
6m
o
le
cu
le
cm
-3H
y
d
ro
c
a
rb
o
n
vm
r
/
p
p
b
v
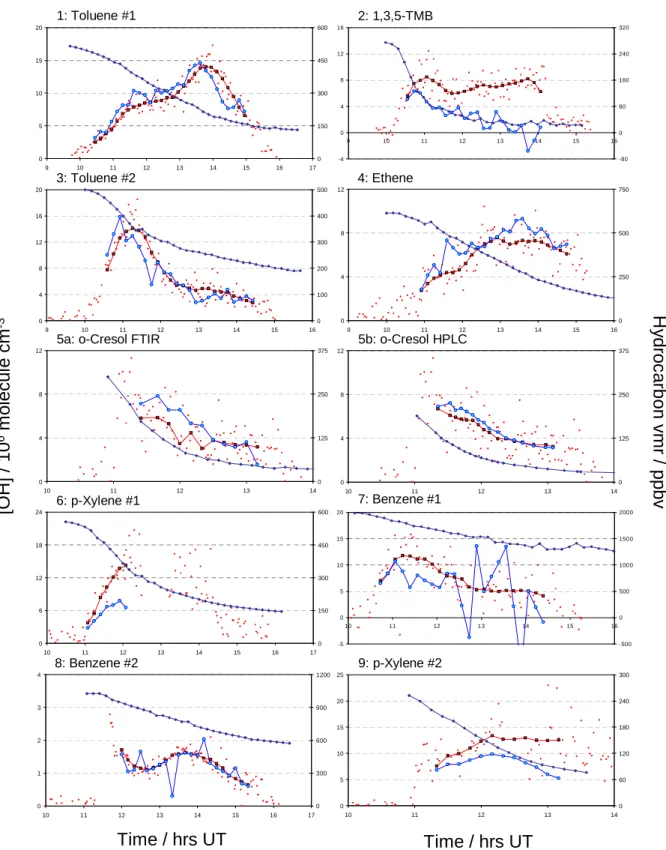
0 1 2 3 4 10 11 12 13 14 15 16 17 0 300 600 900 1200Fig. 2. Data from each experiment showing comparison between measured and inferred OH concentrations. Key: Individual [OH] from the
LIF measurements, small red circles; [OH] from LIF averaged over interval between hydrocarbon measurements used for analysis, black/red squares; [OH] inferred from hydrocarbon decay, blue circles; hydrocarbon mixing ratio, blue diamonds (right hand abscissa; vmr=volume mixing ratio).
It can be seen from Table 3 that reaction with OH accounts for more than 99.9% of the loss of each hydrocarbon species, with the exceptions of ethene and o-cresol, for which reac-tion with O3 and NO3 (respectively) is significant. In the
case of the ethene experiment (4), ozone mixing ratios in-creased from <1 ppbv to 446 ppb over the course of 5 h, thus the mean removal of ethene by ozone was rather lower than line 4 of Table 3 suggests, at 16.4%. The contribution of ozonolysis to the removal of ethene was accounted for as de-tailed in Sect. 5, below.
Considering the case of o-cresol, the NO3
concentra-tion obtained from the simple steady-state approach (in which photolysis is the only sink for NO3), ca. 1.8×10⁸
molecule cm−3, is greatly overestimated as NO3 will react
with many species present, not least o-cresol itself. Inclusion of this reaction alone as an additional NO3sink in the steady
state analysis reduces the calculated mean [NO3] to 7.3×10⁵
molecule cm−3, and reduces the significance of NO3for
re-moval of cresol to 5%. This is also an overestimate, as the primary fate of NO3was reaction with products of cresol
ox-idation – a simulation of the cresol oxox-idation system, per-formed using the MCM version 3.1 (Pilling, 2003) employ-ing all relevant reactions and initiated with measured con-centrations, determined that 28% of the loss of NO3was by
reaction with cresol, less than 0.1% by photolysis and the re-mainder by reaction with products of cresol oxidation. The same simulation determined that, after dilution, over 98% of the removal of cresol occurred through reaction with OH.
The removal of the primary hydrocarbon species is thus overwhelmingly dominated by reaction with OH (after ac-counting for dilution, and the ozonolysis reaction in the case of ethene), and the hydrocarbon decay data can be used to infer the concentration of OH radicals present.
5 Inferred OH from hydrocarbon decays: method
For each experiment, a subset of hydrocarbon and OH data was selected corresponding to the period during which the chamber was open to sunlight (typically 3–5 h). The hydro-carbon concentration-time data were analysed using the in-terval method (Guggenheim, 1926) to obtain a pseudo-first-order rate coefficient (k0) for hydrocarbon removal:
k0=ln(c1/c2)/(t2−t1) (iii)
where c1and c2were the hydrocarbon concentrations
mea-sured at times t1 and t2, respectively. The mean OH
con-centration during the time period between t1and t2was then
obtained via
[OH]HC=(k0−kdil)/kOH+HC (iv)
where kdilis a first-order rate coefficient for the effect of
di-lution and kOH+HCis the rate coefficient for the reaction
be-tween OH radicals and the hydrocarbon species in question,
at the appropriate temperature (Table 2) and atmospheric pressure.
The treatment of the ethene data (experiment 4) was an exception to the above procedure: In this system, reaction with ozone accounts for between 1 and 30% of the chem-ical loss of ethene, depending upon the time-point consid-ered. Equation (iv) were therefore modified to include a term accounting for the ozonolysis reaction, and the ethene data were analysed to return [OH]HCaccording to Eq. (v): [OH]HC=(k0−kdil−kC2H4+O3[O3])/kOH+HC (v)
A value of 1.87×10⁻¹⁸ molecule−1cm3s−1 was used for
kC2H4+O3 (Atkinson et al., 2002). Analysis of the ethene
data was otherwise identical to that for the other hydrocar-bon species, as described below.
Each inferred OH concentration was compared with the mean value for [OH] obtained by the LIF instrument, [OH]LIF, over the same time period (t1 to t2). The
over-all agreement for each species/experiment was quantified by calculating the ratio, R, of the sum of the values of [OH] ob-tained from the averaged LIF measurements to the equivalent from the hydrocarbon decay data:
R=6[OH]LIF/6[OH]HC (vi)
Thus a value of unity for R indicates perfect agreement, val-ues greater than 1 indicate that OH concentrations measured by the LIF system were greater than those inferred from the hydrocarbon decay and suggest that the calibration constant
C(Eq. i) may be too small, and values less than 1 suggest the converse.
Random noise in the hydrocarbon concentrations obtained from the FTIR data leads to a high degree of variability in the inferred OH concentrations, as can be seen in Fig. 1a, show-ing the results for benzene (experiment 8); in some cases neg-ative OH concentrations are returned. This variability can be reduced by increasing the time interval between each pair of hydrocarbon concentrations analysed. In this work a 5-hydrocarbon measurement point interval (ca. 40 min) gave a reasonable balance between reducing the noise in the inferred OH concentrations and maintaining a significant number of data points in the analysis; thus the first inferred OH con-centration was obtained from hydrocarbon concon-centrations c1
and c5, the second from c2and c6, and so forth. The OH
con-centrations obtained from the LIF system were averaged over the same time interval, i.e. t1to t5, t2to t6etc. corresponding
typically to 15–20 individual OH measurements (each taken at 90–120 s intervals) for each value of [OH]LIF. Figure 1b
shows the reduced variability in inferred OH concentration with a 5-point interval between benzene concentrations. The value of R obtained is equal (to within 1%) in each case; however the reduction in scatter accompanying adoption of the 5-point interval greatly facilitates visual comparison of the values of [OH]HCand [OH]LIF.
Rate coefficients for the reaction of OH with the vari-ous hydrocarbon species, kOH+HC, as given in Table 4, were
Table 4. Literature values for k(OH+HC) and ratio of LIF-measured to hydrocarbon-inferred OH concentrations.
Run Hydrocarbon k(OH+hydrocarbon) R=6[OH]LIF/6[OH]HC
species /10−12molecule−1cm3s−1 a Valueb+/− Uncertaintyc
1 Toluene 5.51 0.96 0.19 2 1,3,5-TMB 56.7 3.02 0.60 3 Toluene 5.51 1.06 0.21 4 Ethene 8.04d 0.87 0.21 5a o-Cresol (FTIR) 40.7 0.83 0.25 5b o-Cresol (HPLC) 40.7 0.93 0.28 6 p-Xylene 14.3 1.69 0.42 7 Benzene 1.24 1.29 0.26 8 Benzene 1.24 1.04 0.21 9 p-Xylene 14.3 1.45 0.36 Notes a: Recommended values from Calvert et al. (2002).
b: R defined as in Eq. (vi).
c: Uncertainty quoted here derived from uncertainty in k(OH+Hydrocarbon) only. d: Mean of values from Atkinson et al. (2002) and Sander et al. (2003).
taken from Calvert et al. (2002), with the exception of ethene, for which the mean of the values recommended by the IU-PAC (Atkinson et al., 2002) and NASA/JPL (Sander et al., 2003) panels was used. Uncertainty in the individual values is discussed further below.
6 Inferred OH from hydrocarbon decays: results
The hydrocarbon decay data, individual measured LIF OH concentrations, inferred OH concentrations [OH]HCand
av-eraged LIF OH concentrations [OH]LIFare shown in Fig. 2.
Table 4 lists the value of the OH+ hydrocarbon rate coeffi-cient used to evaluate each dataset, and gives the values of
R, the ratio of [OH]LIF to [OH]HC, obtained. The
uncer-tainty quoted in Table 4 reflects the unceruncer-tainty in the rate coefficient, kOH+HConly – the value of R is directly
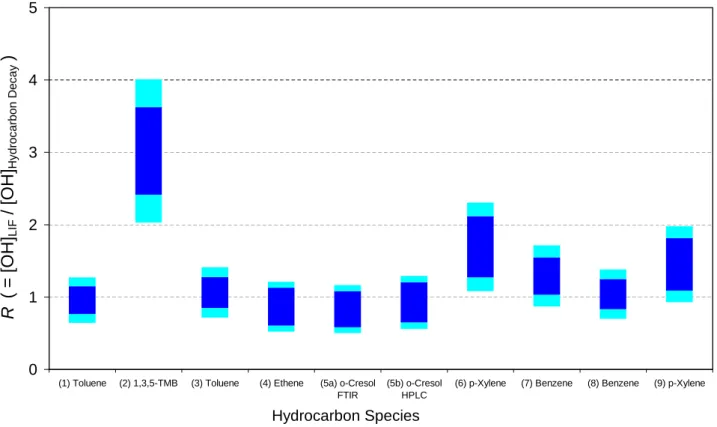
propor-tional to kOH+HCvia Eqs. (iv) and (vi). Figure 3 compares
the values of R obtained for each experiment, with two confi-dence intervals shown – the inner limits reflecting solely un-certainty in kOH+HC, as given in Table 4, and the outer limits
reflecting the propagation of this with the uncertainty (26%) in the LIF system calibration. The results for each individual species are discussed below.
6.1 Toluene
Experiments (1) and (3) show excellent agreement between the LIF and hydrocarbon-inferred (HC) values for OH, with values for R of (0.96±0.19) and (1.06±0.21) obtained, re-spectively.
6.2 1,3,5-Trimethylbenzene
The OH concentrations obtained from the LIF and HC anal-yses are not in agreement for 1,3,5-TMB (trimethylbenzene),
with the LIF data considerably higher than the hydrocarbon decay giving R=(3.0±0.6). The quality of the hydrocarbon decay data is poor (reflecting the lower 1,3,5-TMB concen-trations used in this experiment) which contributes to the variability in the [OH]HCvalues, but cannot explain the
dis-crepancy between the absolute values, possible reasons for which are discussed in Sect. 7.
6.3 Ethene
The OH concentrations inferred from the decay of ethene are in good agreement with those measured by the LIF system throughout the experiment, giving a value of R=(0.87±0.21). The correlation in the shape of the OH profiles indicates that the modified analysis to account for the ozonolysis reaction (Eq. v) is correct, as the contribution to chemical loss of ethene from this reaction ranges from 1.5% for the first point to 39.6% for the final point.
6.4 o-Cresol
The cresol experiments show good agreement between OH concentrations measured directly by LIF and inferred from the hydrocarbon decays, with values of R=(0.83±0.25) and (0.93±0.28) for the FTIR and HPLC analyses, respectively. The HPLC data are smoother than those from the FTIR, re-flected in reduced noise in the values of [OH]HC in Fig. 2f.
Differences in the [OH]LIFdata between Figs. 2e and 2f
re-flect the FTIR and HPLC data being acquired on different timescales, and thus different averaging of the individual LIF data points being applied.
6.5 para-Xylene
The data from the first p-xylene experiment (6) is limited due to a partial power failure, which interrupted OH data
acquisition at approximately 12:30 pm. While data acqui-sition resumed 90 min later, confidence in the validity of the OH calibration was low as the dye laser beam align-ment had to be completely reoptimised, and no check of the instrument calibration was possible until the next day; therefore only data acquired prior to the power failure are considered. Agreement between [OH]HC and [OH]LIF is
poor for experiment (6), R=(1.69±0.42), better for experi-ment (9), R=(1.45±0.36) considering just the uncertainty in the OH+p-xylene rate coefficient, and R=(1.45±0.52) if the uncertainty in the LIF calibration is factored in (as shown in Fig. 3). Again, possible reasons for the disagreement are considered below.
6.6 Benzene
The contribution of chemical loss (reaction with OH) to the total loss of benzene is the least of all the species consid-ered (Table 2); dilution dominates due to the low rate coef-ficient for the benzene +OH reaction. Accordingly the val-ues of [OH]HC obtained are noisier, as scatter in the FTIR
retrievals has a greater influence. The absolute agreement between the LIF and HC [OH] is good for experiment (7) (Fig. 2i) and excellent for experiment (8) (Fig. 1), with val-ues of R=(1.29±0.26) and (1.04±0.21) obtained, although inspection of the plot indicates that the confidence interval, reflecting uncertainty in k(OH+benzene), is probably under-estimated for experiment (7).
7 Conclusions
The principal factor affecting the value of R, the measure of absolute agreement between HC and LIF values for [OH], is the rate coefficient used for the hydrocarbon – hydroxyl reaction (Eq. iv). Studies of the relevant rate coefficients have been reviewed by Calvert et al. (2002), recommended values from which are used in this work; however the discrepancies observed in the cases of 135-TMB and p-xylene merit further attention.
Measurements of k(OH+1,3,5-TMB) at 298 K range from (3.78±0.52)×10−11 molecule−1cm3s−1 (Ohta and Ohyama, 1985) to (6.24±0.75)×10−11molecule−1cm3s−1 (Perry et al., 1977), with a recommended value (Calvert et al., 2002) of k(OH+1,3,5-TMB)=(5.67±1.13)×10−11 molecule−1cm3s−1. Adoption of the lowest measured
value (3.78×10⁻¹¹ molecule−1cm3s−1)would reduce the
value of R obtained from this experiment by 33%, to (2.01±0.59) (confidence interval reflects combined uncer-tainty in k and the LIF calibration). Uncertainty in the kinetic data can thus account for some, but not all, of the discrepancy between [OH]HC and [OH]LIF in the
1,3,5-TMB experiment. For p-xylene, measurements of
k(OH+p-xylene) exhibit significant scatter, ranging from (1.05±0.1)×10−11molecule−1cm3s−1(Ravishankara et al.,
1978) to (1.82± 0.22)×10−11molecule−1cm3s−1(Perry et
al., 1977) with the recommendation of Calvert et al. (2002), of (1.43±0.36)×10−11 molecule−1cm3s−1being a straight
average of a subset of the recent determinations. Were the lower measurement of 1.05×10⁻¹¹ molecule−1cm3s−1 to be adopted, the values of R for the p-xylene experiments would be reduced by 27% to (1.24 ±0.35) and (1.06±0.30) for experiments (6) and (9), respectively, in good agreement with the values from the other species considered (again, confidence interval reflects combined uncertainty in k and the LIF calibration). The results of this work therefore suggest that the true value for k(OH+p-xylene) may be somewhat lower than the value recommended by Calvert et al. (2002).
If the values for the rate constants (kOH+HC)used are cor-rect, the sense of discrepancy which might be anticipated in this work (assuming all other factors to be correct) is [OH]HC>[OH]LIF– which could arise if processes other than
dilution and reaction with OH contributed to the removal of the hydrocarbon species. Disagreement in the opposite sense (as observed for 1,3,5-TMB and p-xylene) implies ei-ther regeneration of the primary hydrocarbon (for which no mechanism can be envisaged) or a problem with the values of [OH]HCor [OH]LIF. Other sources of loss of the hydrocarbon
species have been discussed (Sect. 4); however two poten-tial systematic errors in the values of [OH]HCand [OH]LIF
are considered below: Errors in the FTIR retrievals of the hydrocarbon concentrations, and generation of artefact OH radicals, through photolysis of sampled compounds by the excitation laser pulse.
The pseudo-first order nature of the analysis leads to the inferred OH concentrations, [OH]HC, being independent of
the absolute hydrocarbon concentrations, and hence of the cross sections used to analyse the FTIR data, and stan-dards adopted to calibrate the HPLC instrument. Errors in the retrieved hydrocarbon concentrations, for example due to overlap with absorption spectra of photo-oxidation prod-ucts, could however lead to incorrect values for [OH]HC.
Such spectral contamination would be expected to vary (and worsen) over the course of the experiments, as the com-plexity of the analyte increased and the primary hydrocar-bon concentration decreased, and thus any deviation between [OH]HC and [OH]LIF would be expected to increase. This
trend is observed in the case of 1,3,5-TMB (experiment 2), and to a lesser extent in the case of p-xylene. In the case of 1,3,5-TMB however no spectral overlap occurs between the trimethybenzene and the two major photo-oxidation prod-ucts, methylglyoxal and PAN. The 1,3,5-TMB concentra-tions obtained from the FTIR analysis are in good agreement (better than 1%) with those obtained from GC-FID measure-ments performed during the same experiment, at the start of the 1,3,5-TMB decay; however when the 1,3,5-TMB mixing ratio falls below ca. 75 ppbv (25% of the initial level), the FTIR concentrations begin to exceed those from the GC-FID. The discrepancy reaches approximately 15 ppbv (equivalent to 50%) by the end of the experiment, suggesting that the
0 1 2 3 4 5
(1) Toluene (2) 1,3,5-TMB (3) Toluene (4) Ethene (5a) o-Cresol FTIR
(5b) o-Cresol HPLC
(6) p-Xylene (7) Benzene (8) Benzene (9) p-Xylene
Hydrocarbon Species
R
(
=
[O
H
]
LIF/
[O
H
]
Hy d ro c a rb o n D e c a y)
Fig. 3. Ratio (R) of OH concentrations measured by the LIF system and those obtained from hydrocarbon decay data. Outer (light blue)
confidence interval indicates combined uncertainty in FAGE calibration (26%) and k(OH+Hydrocarbon) (Table 4); inner confidence interval reflects uncertainty in k(OH+Hydrocarbon) only.
FTIR data may indeed be suffering from spectral contamina-tion, as considered above, in this experiment. The statistical uncertainty in the FTIR and HPLC data is low – estimated to be 2% and 4%, respectively – and is not included in the un-certainties calculated for R (Table 4), as while this factor will contribute to point-to-point scatter in the inferred [OH]HC, it
will not impart a systematic error to the value of R.
The photolysis of ambient ozone, generating O(1D) which could react with ambient water vapour to form OH radicals, was a problem for some early measurements of OH by LIF, in which 282 nm excitation was used (Zeng et al., 1998). Use of 308 nm excitation, combined with high PRF – low pulse energy excitation, reduces the contribution to returned [OH] from this source to less than 103molecule cm−3under condi-tions of the EUPHORE experiments ([O3], [H2O], laser
flu-ence). Hydrocarbon photolysis by the excitation laser beam could also lead to artefact OH generation; however no signif-icant levels of OH were detected (<1×10⁶molecule cm−3)
at the start of each experiment, when the hydrocarbon species had been introduced to the chamber but prior to opening of the covers to admit sunlight (Fig. 2). Photolysis of prod-ucts of the oxidation of each primary hydrocarbon could contribute to artefact OH generation; however considering the case of 1,3,5-TMB, the three principal observed prod-ucts were methyl glyoxal, PAN and HCHO. If direct produc-tion of OH radicals with unit quantum yield following 308
nm photolysis of each of these species were possible, the maximum concentrations of OH radicals produced inside the FAGE cell would be ca. 2500, 75 and 1500 molecule cm−3,
respectively (calculated for the maximum concentration of each species observed, using the measured LIF cell pressure (1.6 mbar) and typical observed OH rotational temperature (220 K)). These values can be compared to a concentration of ca. 17 000 molecule cm−3of OH within the FAGE cell which results from sampling ambient air containing [OH]=8×10⁶ molecule cm−3(typical of the levels found during the 1,3,5-TMB experiment). When the further requirements for any such OH to be generated in the correct rovibronic state, and to be both generated and excited within the same laser pulse are considered, the contribution of photolytic artefacts to the returned [OH] is clearly minimal.
Variation in the calibration of the LIF system between ex-periments could account for the discrepancies in the results for 1,3,5-TMB – calibration of the LIF system requires en-try into the EUPHORE chamber, which must be purged of experimental gases prior to calibration, and of water vapour etc. afterwards. Therefore, it was not possible to perform calibration checks between every experiment during the EX-ACT campaigns. Calibrations performed at the start and end of the first exact campaign were within 6% of each other; similarly for the second campaign, 17 individual calibrations performed on three different days at the start, middle and end
of the campaign exhibited a standard deviation of 9%. It is therefore unlikely that variation in the instrument calibration (arising for example from variations in laser linewidth due to changed oscillator alignment) can explain the large discrep-ancies obtained for 1,3,5-TMB and p-xylene. This conclu-sion is supported by the excellent agreement between the two toluene experiments, (1) and (3), performed prior and subse-quent to the 1,3,5-TMB run, and by the consistency in the result from the two p-xylene runs, which were conducted 15 days apart.
No single reason can be identified for the disagreement between values of [OH]LIFand [OH]HCin the case of
1,3,5-TMB; uncertainty in the rate constant for reaction with OH can account for some, but not all of the discrepancy. Com-parison of the GC-FID concentration measurements obtained for 1,3,5-TMB during experiment (2) with those from the FTIR system suggest that instrumental rather than chemical causes may be responsible for the discrepancy. In the case of
p-xylene, agreement (within 1 s.d. uncertainty) is achieved for experiment (9), and nearly for experiment (6) (Fig. 3); as discussed above, k(OH+p-xylene) may be somewhat smaller than that used to obtain these values. The confidence interval in the values of R listed in Table 4 reflect only the uncertainty in k(OH+hydrocarbon), and those plotted in Fig. 3 show also the combined uncertainty in the calculated [OH] from cal-ibration. The true uncertainty in these values is larger, as no contribution from data scatter is included – for example, inspection of Fig. 2 indicates clearly that the value of R ob-tained from experiment (7) will be less precise than that from experiment (1).
We discount the results from experiment (2) (1,3,5-TMB) from our final comparison between the LIF-measured and hydrocarbon-inferred OH, on the basis that the deviation in this case is much greater than indicated by the remaining studies, and is likely to be due to some other systematic factor. Averaging results from the remaining 8 experiments gives a mean value for [OH]LIF/[OH]HC of (1.15±0.13),
where the range indicates combined (1 s.d.) uncertainty in the values of k(OH+hydrocarbon) and the LIF calibration methodology. This result thus indicates that OH concentra-tions retrieved from LIF systems calibrated using the water-photolysis ozone-actinometry calibration approach are accu-rate to within the stated calibration uncertainty (±26%), but suggests a slight bias to overestimate the true ambient OH concentration. The possibility of counterbalancing errors in the various calibration factors (e.g. oxygen and water cross sections) is not precluded, so the same conclusion cannot necessarily be drawn for the analogous calibration approach in which photolysis of water vapour is quantified through measurement of the UV flux by a calibrated photodiode.
The results of this work indicate that OH concentrations measured by an LIF instrument calibrated using the water photolysis-ozone actinometry method are accurate to within the stated calibration uncertainty of ±26%, with a mean value of [OH]LIF/[OH]hydrocarbon decay of (1.15±0.13)
ob-tained. Continuing development of calibration techniques, for example via the ozonolysis of alkenes (Hard et al., 2002), and further intercomparisons of ambient OH measurements performed using different approaches and calibration niques, such as the comparison between LIF and DOAS tech-niques reported by Brauers et al. (1996), are essential to fur-ther our understanding of the accuracy and precision of the current generation of hydroxyl radical measurements.
Acknowledgements. Fundaci´on CEAM is supported by
Generali-dad Valenciana and BANCAIXA. Financial support for this work was provided through the EU programme “Effects of the Oxidation of Aromatic Compounds in the Troposphere” (EXACT), Contract #EVK2-CT-1999-00053, and Ministerio de Ciencia y Tecnolog´ıa (REN2000-3277-CE/CLI, REN2001-4600-E /CLI).
Edited by: A. Volz-Thomas
References
Aschmutat, U., Hessling, M., Holland, F., and Hofzumahaus, A.: A tunable source of hydroxyl (OH) and hydroperoxy (HO2)
radi-cals: In the range between 106and 109cm−3, Physico-Chemical Behaviour of Atmospheric Pollutants, edited by Angeletti, G. and Restelli, C., Proc. EUR 15609, 811–816, 1994.
Atkinson, R.: Gas-phase Tropospheric Chemistry of Organic Com-pounds: A review, Atmos. Environ. 24A, 1, 1–41, 1990. Atkinson, R.: Gas Phase Tropospheric Chemistry of Organic
Com-pounds, J. Phys. Chem. Ref. Data, Monograph No. 2, 1–216, 1994.
Atkinson, R., Baulch, D. L., Cox, R. A., Crowley, J. N., Hampson, R. F., Kerr, J. A., Rossi, M. J., and Troe, J.: Summary of Eval-uated Kinetic and Photochemical Data for Atmospheric Chem-istry, Web Version, http://www.iupac-kinetic.ch.cam.ac.uk,2002. Bailey, A. E., Heard, D. E., Paul, P. H., and Pilling, M. J.: Col-lisional Quenching of OH (A26+, v’=0) by N2, O2and CO2
between 204 and 294 K. Implications for atmospheric measure-ments of OH by laser-induced fluorescence, J. Chem. Soc. Fara-day Trans., 93, 16, 2915–2920, 1997.
Bailey, A. E., Heard, D. E., Henderson, D. A., and Paul, P. H.: Collisional quenching of OH(A26+, v’=0) by H2O between 211 and 294 K and the development of a unified model for quenching, Chem. Phys. Lett. 302, 132–138, 1999.
Becker, K. H.: EUPHORE: Final Report to the European Commis-sion, Contract #EV5V-CT92-0059, Bergische Universitat Wup-pertal, Germany, 1996.
Becker, K. H.: In Situ Euphore Radical Measurement (EU-PHORAM): Final Report to the European Commission, Contract #ENV4-CT95-0011, Bergische Universitat Wuppertal, Germany, 1999.
Bloss, W. J., Gravestock, T. J., Heard, D. E., Ingham, T., Johnson, G. P., and Lee, J. D.: Application of a compact all-solid-state laser system to the in situ detection of atmospheric OH, HO2,
NO and IO by laser-induced fluorescence, J. Environ. Monit. 5, 21–28, 2003.
Brauers, T., Aschmutat, U., Brandenburger, U., Dorn, H. P., Haus-mann, M., Hessling, M., Hofzumahaus, A., Holland, F., Plass-D¨ulmer, C., and Ehhalt, D. H.: Intercomparison of tropospheric
OH radical measurements by multiple folded long-path laser ab-sorption and laser-induced fluorescence, Geophys. Res. Lett. 23, 18, 2545–2548, 1996.
Cantrell, C. A., Zimmer, A., and Tyndall, G. S.: Absorption cross sections for water vapour from 183 to 193 nm, Geophys. Res. Lett. 24, 17, 2195–2198, 1997.
Calvert, J. G., Atkinson, R., Kerr, J. A., Madronich, S., Moortgat, G. K., Wallington, T. J., and Yarwood, G.: The Mechanisms of Atmospheric Oxidation of the Alkenes, OUP, New York, 2000. Calvert, J. G., Atkinson, R., Becker, K. H., Kamens, R. M.,
Se-infeld, J. H., Wallington, T. J., and Yarwood, G.: The Mech-anisms of Atmospheric Oxidation of Aromatic Hydrocarbons, OUP, New York, 2002.
Chan, C. Y., Hard, T. M., Mehrabzadeh, A. A., George, L. A., and O’Brien, R. A.: Third-Generation FAGE Instrument for Tropo-spheric Hydroxyl Radical Measurement, J. Geophys. Res. 95, D11, 18 569–18 576, 1990.
Creasey, D. J., Halford-Maw, P. A., Heard, D. E., Pilling, M. J., and Whitaker, B. J.: Implementation and initial deployment of a field instrument for the measurement of OH and HO2in the
tro-posphere by laser-induced fluorescence, J. Chem. Soc., Faraday Trans., 93, 16, 2907–2913, 1997a.
Creasey, D. J., Heard, D. E., Pilling, M. J., Whitaker, B. J., Berzins, M., and Fairlie, R.: Visualisation of a supersonic free-jet expan-sion using laser-induced fluorescence spectroscopy: Application to the measurement of rate constants at ultralow temperatures, App. Phys. B, 65, 375–391, 1997b.
Creasey, D. J., Heard, D. E., and Lee, J. D.: Absorption cross-section measurements of water vapour and oxygen at 185 nm, Implications for the calibration of field instruments to measure OH, HO2and RO2radicals, Geophys. Res. Lett., 27, 11, 1651–
1654, 2000.
Derwent, R. G., Jenkin, M. E., and Saunders, S. M.: Photochemical ozone creation potentials for a large number of reactive hydrocar-bons under European conditions, Atmos. Environ., 30, 181–199, 1996.
Etzkorn, T., Klotz, B., Sørensen, S., Patroescu, I. V., Barnes, I., Becker, K. H., and Platt, U.: Gas-phase absorption cross sections of 24 monocyclic aromatic hydrocarbons in the UV and IR spec-tral ranges, Atmos. Environ., 33, 525–540, 1999.
Guggenheim, E. A.: On the determination of the Velocity Constant of a Unimolecular Reaction, Philos. Mag., 2, 9, 538–543, 1926. Hard, T. M., O’Brien, R. J., Chan, Y. C., and Mehrabzadeh, A.
A.: Tropospheric Free Radical Determination by FAGE, Environ. Sci. Technol., 18, 768–777, 1984.
Hard, T. M., George, L. A., and O’Brien, R. J.: An Absolute Cal-ibration for Gas-Phase Hydroxyl Measurements, Environ. Sci. Tech., 36, 1783–1790, 2002.
Heard, D. E. and Pilling, M. J.: Measurement of OH and HO2in
the troposphere, Chem. Rev., 103, 5163–5198, 2003.
Hofzumahaus, A., Aschmutat, U., Heßling, M., Holland, F., and Ehhalt, D. H.: The measurement of tropospheric OH radicals by laser-induced fluorescence spectroscopy during the POPCORN field campaign, Geophys. Res. Lett., 23, 18, 2541–2544, 1996. Holland, F., Hessling, M., and Hofzumahaus, A.: In Situ
Measure-ment of Tropospheric OH Radicals by Laser-Induced Fluores-cence – A Description of the KFA Instrument, J. Atmos. Sci., 52, 19, 3393–3401, 1995.
Holland, F., Hofzumahaus, A., Sch¨afer, J., Kraus, A., and P¨atz, H.: Measurements of OH and HO2radical concentrations and
pho-tolysis frequencies during BERLIOZ, J. Geophys. Res., 108, D4, 8246, doi:10.1029/2001JD001393, 2003.
Kanaya, Y., Sadanaga, Y., Hirokawa, J., Kajii, Y., and Akimoto, H.: Development of a Ground-Based LIF Instrument for Measur-ing HOxRadicals: Instrumentation and Calibrations, J. Atmos.
Chem., 38, 1, 73–110, 2001.
Klotz, B., Sørensen, S., Barnes, I., Becker, K. H., Etzkorn, T., Volkamer, R., and Platt, U.: Atmospheric Oxidation of Toluene in a Large-Volume Outdoor Photoreactor: In Situ Determina-tion of Ring-Retaining Product Yields, J. Phys. Chem. A, 102, 10 289–10 299, 1998.
Lanzendorf, E. J., Hanisco, T. F., Donahue, N. M., and Wennberg, P. O.: Comment on “The measurement of tropospheric OH radi-cals by laser-induced fluorescence spectroscopy during the POP-CORN field campaign”, edited by Hofzumahaus, A. et al., and “Intercomparisons of tropospheric OH radical measurements by multiple folded long-path laser absorption and laser induced flu-orescence”, edited by Brauers, T. et al., Geophys. Res. Lett., 24, 23, 3037–3038, 1997.
Lee, J. D.: Development and Deployment of the FAGE instrument for measurement of HOxin the troposphere, PhD Thesis,
Uni-versity of Leeds, 2000.
Levy II, H.: Normal Atmosphere: Large Radical and Formaldehyde Concentrations Predicted, Science, 173, 141–143, 1971. Ohta, T. and Ohyama, T.: A set of rate constants for the reactions of
hydroxyl radicals with aromatic hydrocarbons, Bull. Chem. Soc. Jpn., 58, 3029–3030, 1985.
Pilling, M. J.: Effects of the Oxidation of Aromatic Compounds in the Troposphere (EXACT): Final Report to the European Com-mission, Contract #EVK2-CT-1999-00053, University of Leeds, UK, 2003.
Perry, R. A., Atkinson, R., and Pitts Jr., J. N.: Kinetics and mech-anism of the gas phase reaction of OH radicals with aromatic hydrocarbons over the temperature range 296–473 K, J. Phys. Chem., 81, 296–304, 1977.
Ravishankara, A. R., Wagner, S., Fischer, S., Smith, G., Schiff, R., Watson, R. T., Tesi, G., and Davis, D. D.: A kinetics study of the reactions of OH with several aromatic and olefinic compounds, Int. J. Chem. Kinet., 10, 783–804, 1978.
Sander, S. P., Friedl, R. R., Golden, D. M., Kurylo, M. J., Huie, R. E., Orkin, V. L., Moortgat, G. K., Ravishankara, A. R., Kolb, C. E., Molina, M. J., and Finlayson-Pitts, B. J.: Chemical Kinetics and Photochemical Data for use in Atmospheric Studies, Evalu-ation #14, NASA-JPL PublicEvalu-ation 02-25, Jet Propulsion Labora-tory, Pasadena, CA 91109, 2003.
Siese, M., Becker, K. H., Brockmann, K. J., Geiger, H., Hofzuma-haus, A., Holland, F., Mihelcic, D., and Wirtz, K.: Direct Mea-surement of OH Radicals from Ozonolysis of Selected Alkenes: A EUPHORE Simulation Chamber Study, Environ. Sci. Tech-nol., 35, 4660–4667, 2001.
Stevens, P. S., Mather, J. H., and Brune, W. H.: Measurement of tropospheric OH and HO2by laser-induced fluorescence at low
pressure, J. Geophys. Res., 99, D2, 3543–3557, 1994.
Washida, N., Mori, Y., and Tanaka, I.: Quantum Yield of Ozone Formation from Photolysis of the Oxygen molecule at 1849 and 1931 ˚A, J. Chem. Phys., 54, 1119–1122, 1971.