HAL Id: hal-02376572
https://hal.archives-ouvertes.fr/hal-02376572
Submitted on 18 Nov 2020HAL is a multi-disciplinary open access archive for the deposit and dissemination of sci-entific research documents, whether they are pub-lished or not. The documents may come from teaching and research institutions in France or abroad, or from public or private research centers.
L’archive ouverte pluridisciplinaire HAL, est destinée au dépôt et à la diffusion de documents scientifiques de niveau recherche, publiés ou non, émanant des établissements d’enseignement et de recherche français ou étrangers, des laboratoires publics ou privés.
The Permeability Evolution of Tuffisites and
Implications for Outgassing Through Dense Rhyolitic
Magma
Michael Heap, Hugh Tuffen, Fabian Wadsworth, Thierry Reuschlé, Jonathan
Castro, C. Ian Schipper
To cite this version:
Michael Heap, Hugh Tuffen, Fabian Wadsworth, Thierry Reuschlé, Jonathan Castro, et al.. The Permeability Evolution of Tuffisites and Implications for Outgassing Through Dense Rhyolitic Magma. Journal of Geophysical Research : Solid Earth, American Geophysical Union, 2019, �10.1029/2018JB017035�. �hal-02376572�
The permeability evolution of tuffisites and implications
1for outgassing through dense rhyolitic magma
23
Michael J. Heap1*, Hugh Tuffen2, Fabian B. Wadsworth3, Thierry Reuschlé1, Jonathan M.
4 Castro4, and C. Ian Schipper5 5 6 1Institut de Physique de Globe de Strasbourg, Université de Strasbourg, École et Observatoire des 7 Sciences de la Terre (UMR 7516 CNRS), 5 rue René Descartes, 67084 Strasbourg, France 8 2Lancaster Environment Centre, Lancaster University, Lancaster LA1 4YQ, UK 9 3Department of Earth Sciences, Durham University, Durham, UK 10
4Institute of Geosciences, Johannes Gutenberg University Mainz, J.-J.-Becher-Weg 21, D-55128
11 Mainz, Germany 12 5School of Geography, Environment and Earth Sciences, Victoria University of Wellington, Kelburn 13 Parade, Wellington 6012, New Zealand 14 15 Corresponding author: M.J. Heap ([email protected]) 16 ORCID ID of corresponding author: https://orcid.org/0000-0002-4748-735X 17 18 Key points: 19 20 1. Permeability of variably sintered tuffisites from Chaitén and Cordón Caulle is between 21 10-16 and 10-15 m2. 22 2. Surface tension and compaction-driven sintering timescales are between 2 min and 13.6 23 h and between 3.5 s and 5 min, respectively. 24
3. Inferred timescales of sintering-driven tuffisite compaction coincide with observed vent 25 pulsations during hybrid rhyolitic activity 26 27 Abstract 28 There is growing evidence that outgassing through transient fracture networks exerts an 29 important control on conduit processes and explosive-effusive activity during silicic eruptions. 30
Indeed, the first modern observations of rhyolitic eruptions have revealed that degassed lava 31 effusion may depend upon outgassing during simultaneous pyroclastic venting. The outgassing is 32 thought to occur as gas and pyroclastic debris are discharged through shallow fracture networks 33 within otherwise low-permeability, conduit-plugging lava domes. However, this discharge is only 34
transient, as these fractures become clogged and eventually blocked by the accumulation and 35 sintering of hot, melt-rich pyroclastic debris, drastically reducing their permeability and creating 36 particle-filled tuffisites. In this study we present the first published permeability measurements 37 for rhyolitic tuffisites, using samples from the recent rhyolitic eruptions at Chaitén (2008-2009) 38 and Cordón Caulle (2011-2012) in Chile. To place constraints on tuffisite permeability evolution, 39
we combine (1) laboratory measurements of the porosity and permeability of tuffisites that 40
preserve different degrees of sintering, (2) theoretical estimates on grainsize- and temperature-41
dependent sintering timescales, and (3) H2O diffusion constraints on pressure-time paths. The
42
inferred timescales of sintering-driven tuffisite compaction and permeability loss, spanning 43 seconds (in the case of compaction-driven sintering) to hours (surface tension-driven sintering), 44 coincide with timescales of diffusive degassing into tuffisites, observed vent pulsations during 45 hybrid rhyolitic activity (extrusive behaviour coincident with intermittent explosions) and, more 46 broadly, timescales of pressurisation accompanying silicic lava dome extrusion. We discuss herein 47
the complex feedbacks between fracture opening, closing, and sintering, and their role in 48 outgassing rhyolite lavas and mediating hybrid explosive-effusive activity. 49 50 Keywords: lava dome; rhyolite; permeability; tuffisite; sintering; H2O diffusion 51
52
1 Introduction 53
Unprecedented observations of recent subaerial rhyolite eruptions in Chile have 54
demonstrated that effusive extrusion of rhyolitic lava can be coincident with intermittent 55
explosions of ash, lapilli, and bombs (Castro et al., 2014; Lara, 2009; Schipper et al., 2013). Such 56
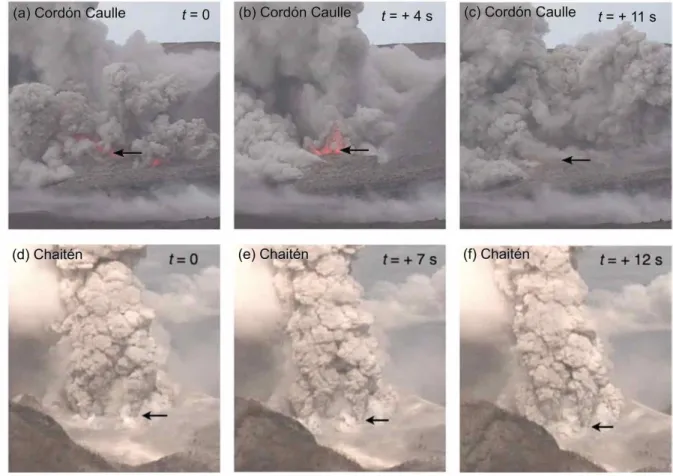
hybrid activity demands reappraisal of existing paradigms of eruptive style transitions 57 (Eichelberger et al., 1986) and highlights that outgassing mechanisms are of critical importance 58 (e.g., Chevalier et al., 2017; Collinson & Neuberg, 2012; Farquharson et al., 2017; Gonnerman and 59 Manga, 2003; Kushnir et al., 2017; Ryan et al., 2019). Chaitén volcano (Chile) exhibited prolonged 60 hybrid activity in 2008 (Castro et al., 2014), whereas longer-lived hybrid (nine months) activity 61 occurred at Cordón Caulle (also in Chile) during 2011-2012 (Schipper et al., 2013). In both cases 62 pulsatory pyroclastic discharge occurred from fractures in vent-filling lava (Figure 1), a process 63 now believed to have accompanied ancient silicic lava dome eruptions in other localities (e.g., 64 Black et al., 2016). For example, the photograph taken during the January 10th 2012 activity at 65 Cordón Caulle (t = + 4 s) shows that localised outgassing occurred via pathways with fracture (i.e. 66 plane) geometries (Figure 1a), rather than outgassing through permeable foam (e.g., Eichelberger 67 et al., 1986). Indeed, recent experimental work by Ryan et al. (2019) has shown that it is difficult 68
to create permeability in initially impermeable, high-porosity foams, describing them as 69
“persistently impermeable”. Dense obsidian bombs emitted during hybrid activity 70
characteristically hosted tuffisites, which are centimetric fractures infilled with pyroclastic 71
material (Castro et al., 2012; Heiken et al., 1988; Saubin et al., 2016; Stasiuk et al., 1996; Tuffen et 72
al., 2003; Figure 2a). Tuffisites have been interpreted to record the transient opening and 73 occlusion of the permeable pathways that provide fleeting escape routes for pressurised gas prior 74 to eventual blockage and violent ejection (Saubin et al., 2016). H2O concentration gradients at the 75 tuffisite-host rock interface (Castro et al., 2012; Berlo et al., 2013) and within fracture-filling clasts 76 (Saubin et al., 2016) provide constraints on tuffisite depths (hundreds of meters), timescales of 77
fracture opening (tens of minutes to several hours), and gas pressure changes associated with 78
fracture opening (reductions of up to several MPa). 79
Modelling approaches (e.g., Diller et al., 1996; Collinson & Neuberg, 2012) and field 80
measurements (e.g., Stix et al., 1993) have shown a low-permeability magmatic plug in the upper 81
conduit can render outgassing ineffective, promoting gas accumulation and pressurisation (a 82
“closed system”). More recent modelling by Chevalier et al. (2017) has shown that, although the 83
dome can increase the pressure on the system and reduce gas loss at the conduit walls, the 84
permeability of the conduit walls is of greater importance that the permeability of the dome in 85
controlling gas loss and pressurisation. In the case of a “closed system”, the initially highly 86 permeable fracture networks, thought to be ultimately recorded as tuffisites, must play a key role 87 in mediating gas release and pressurisation cycles. Recent modelling by Farquharson et al. (2017), 88 focused on the time-dependent permeability evolution of compacting fractured volcanic systems, 89 defined three regimes: (1) an “outgassing” regime, where pore pressure does not increase during 90
compaction; (2) a “diffusive relaxation” regime, where the ongoing reduction in porosity is 91
compensated by the molecular diffusion of water and; (3) a “pore pressure increase” regime, 92
where Darcian or diffusive processes cannot compensate for the porosity reduction and pore 93
pressure builds. As improved modelling of conduit dynamics requires better constraints on the 94
temporal evolution of tuffisite permeability, recent work has addressed the porosity and 95
permeability of variably sintered pyroclastic material (Gardner et al., 2018; Heap et al., 2014, 96
2015; Kendrick et al., 2016; Kolzenburg & Russell, 2014; Okumura & Sasaki, 2014; Ryan et al., 97
2018a, 2018b; Vasseur et al., 2013) and provided models of compaction and viscous sintering (i.e. 98
the agglutination of glassy particles held at or above their corresponding glass transition 99 temperature; Farquharson et al., 2017; Russell and Quane, 2005; Wadsworth et al., 2014, 2016a, 100 2016b, 2017a). These recent data and modelling provide a blueprint for placing firmer constraints 101 on permeability evolution within volcanic conduits. 102 We present herein porosity and permeability measurements for tuffisites hosted within 103 dense obsidian bombs ejected from recent rhyolitic eruptions at Chaitén (2008-2009) and Cordón 104
Caulle (2011-2012). These data, which represent the first permeability measurements of rhyolite-105
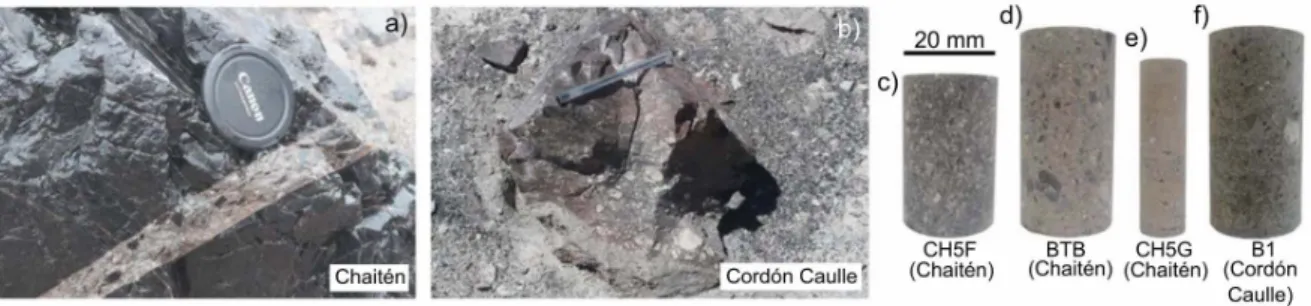
hosted tuffisites, are combined with models for viscous sintering and pressure-timescale 106 constraints from H2O diffusion gradients to provide a detailed description of tuffisite permeability 107 evolution, and thus explore the role of fracture-assisted outgassing within shallow silicic conduits. 108 109 2 Anatomy of a tuffisite 110 Three rhyolitic tuffisites (CH5F, BTB, and CH5G) hosted within decametric dense obsidian 111 bombs that were ejected during hybrid activity in May 2008 at Chaitén volcano (an example is 112 provided as Figure 2a) and found within the pyroclastic density current deposits about 800 m 113 from the 2008-2009 vent were selected for this study. Several field campaigns at Chaitén volcano 114 have highlighted that bombs on the crater rim and flanks commonly host tuffisites. The width of 115 these tuffisites typically ranged from a couple of millimetres up to a few tens of millimetres. The 116 tuffisites within these bombs comprise poorly sorted and variably sintered angular fragments of 117 dense obsidian, pumice, and lithics within a fine ash-grade matrix (Figure 2a). The three samples 118
chosen for this study were selected because of visible differences in density/porosity 119 (photographs of core samples prepared from these three tuffisites are provided as Figures 2c, 2d, 120 and 2e), suggesting underlying differences in their degree of sintering. As a result, we consider 121 that these samples provide snapshots in time of the viscous sintering process. We complement 122 these samples with a tuffisitic bomb fragment from Cordón Caulle, part of a decametric breadcrust 123 bomb found 1.5 km NW of the vent (Figure 2b). The bomb was ejected between June 7th and 15th 124 2011, as the vent constricted prior to and during the onset of lava effusion and thus hybrid activity. 125
It comprises glassy, tuffisitic material that has partly vesiculated after fragmentation, with 126
inflation of the largest, most volatile-rich clasts (Figures 2b and 2f). 127
Backscattered scanning electron microscope (SEM) images of the four tuffisites were 128 collected using a Tescan Vega 2 XMU system, and representative tuffisite textures are shown in 129 Figures 3 and 4. The tuffisites comprise a similar population of ash- and lapilli-sized juvenile and 130 lithic fragments (Figures 3 and 4). The juvenile fragments within the tuffisites are glassy and often 131
angular, but their edges can be rounded or diffuse, depending on the degree of viscous sintering. 132
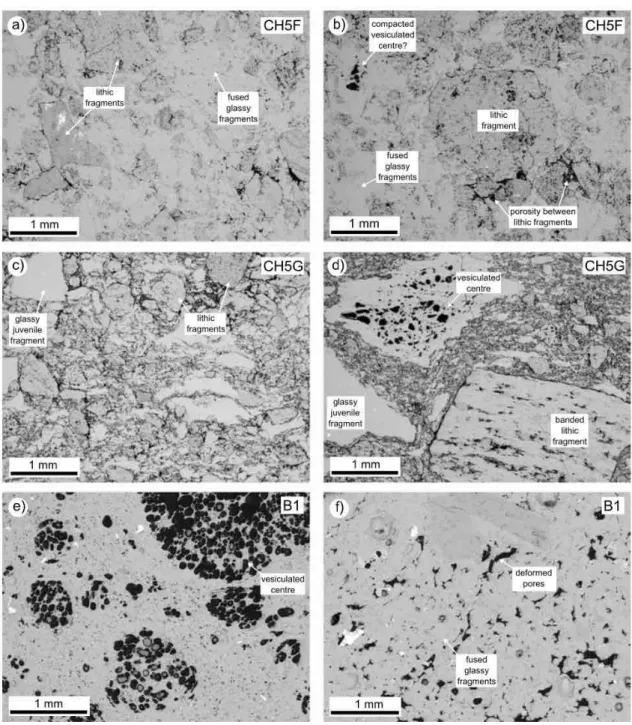
For example, the sintering of juvenile clasts in sample CH5F is sufficiently advanced that it is 133
difficult to distinguish individual fragments (Figures 4a and 4b), with remaining porosity 134
preferentially located at the margins of lithic clasts (Figure 4b). Viscous sintering is least well 135
developed in sample CH5G, with individual glassy juvenile fragments often easily identifiable 136
(Figure 4c and 4d). Indeed, the matrix porosity is noticeably higher in the CH5G sample than the 137
other three samples and is not restricted to lithic clast margins (Figure 4c and 4d). Individual 138
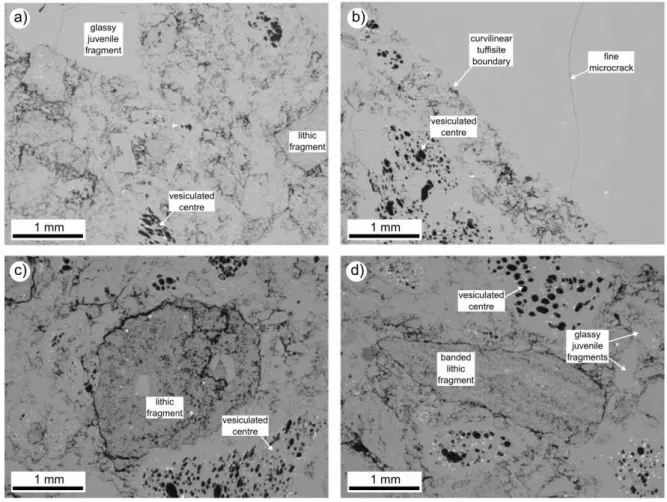
glassy particles in sample B1 appear rounded and are only distinguishable because of the 139 interstitial pore space, which has been compacted and deformed (Figure 4f). 140 Some juvenile clasts in the BTB (Figure 3), CH5G (Figure 4d), and B1 (Figures 4e and 4f) 141 samples have vesiculated centres leading to a frothed appearance. Quantification of vesicle size 142 distributions and H2O concentrations in sample BTB (Saubin et al., 2016) has facilitated a detailed 143 reconstruction of the relative timing of clast vesiculation and fracture opening, together with the 144
evolution of gas pressure in the system. Results show that, for sample BTB, the strongly 145 vesiculated clasts had vesiculated prior to their incorporation into the fracture by pressurised gas 146 from deeper in the conduit. However, it is likely that the common vesiculated juvenile clasts in 147 sample B1 (Figure 4e) have predominantly vesiculated after bomb ejection. Vesiculated juvenile 148 clasts are rare in sample CH5F (Figure 4a and 4b). 149 Lithic fragments in these tuffisites can be angular, but they are often sub-rounded (Figures 150 3 and 4). Most lithics are rhyolite fragments that are banded and microporous with cristobalite 151 and minor plagioclase phases protruding into pore spaces (Figures 3 and 4). Finally, we highlight 152 that the boundary between the tuffisite and the obsidian host rock is curvilinear on the microscale 153 (Figure 3b). Further details on the clast population within the BTB tuffisite, including grainsize 154 distribution and componentry, and the relationship between the timing of fracture opening and 155 clast vesiculation, can be found in Saubin et al. (2016). 156 157 3 Experimental methods 158
Cylindrical samples (either 20 or 10 mm diameter) of the tuffisitic material were cored 159 from each bomb. Samples were cored such that their axis is parallel to the fracture plane, so as to 160 maximise the number of samples extracted from each of the blocks collected (see inset on Figure 161 2a). Samples from the Cordón Caulle bomb were prepared to avoid large vesiculated fragments 162
and the ~decametre-spaced cooling contraction fractures associated with breadcrusting (see 163
Figure 2b). We also prepared a 20 mm-diameter sample of the dense obsidian host rock from the 164
BTB bomb. These samples were precision-ground to lengths of 30-40 mm (for the 20 mm-165 diameter samples) or 20-40 mm (for the 10 mm-diameter samples) and dried for a minimum of 166 48 h inside a vacuum oven at 40 °C. All samples were prepared such that their length-diameter 167 ratio is greater than one. Recent experiments by Heap (2019) highlighted that reliable laboratory 168 measurements of permeability are possible on small cores (e.g., 10 mm-diameter cores) as long 169 as the pore/grain size is small with respect to the core dimensions. 170 The connected porosity and permeability was then measured for each cylindrical sample. 171
The connected porosity of each sample was calculated using the bulk volume of the sample 172
(calculated using the sample dimensions) and the skeletal (i.e. connected) volume given by a 173
Micromeritics AccuPyc II 1340 helium pycnometer. The total porosity of each sample was 174 determined using the solid density of each block (measured using a hand-powdered aliquot of 175 each sample and the helium pycnometer) and the bulk sample density of each cylindrical sample 176 (calculated using the mass and dimensions of each sample). The isolated porosity of each sample 177
could then be determined by subtracting the connected porosity from the total porosity. 178 Permeability was measured using a gas (argon or nitrogen) permeameter following the operating 179 procedure given in Farquharson et al. (2016) and Heap and Kennedy (2016). Permeability was 180 measured under a confining pressure of 1 MPa (a confining pressure is needed to ensure that the 181 gas travels through the sample, rather than between the jacket and the sample edge) using the 182 steady-state method. The permeability of a sample of BTB was also measured under confining 183
pressures up to 10 MPa to cover the range of pressures inferred during tuffisite formation 184
(equivalent to 400-500 m lithostatic; Castro et al., 2014; Saubin et al., 2016) and using the same 185
procedure described above. 186
To measure permeability, the volumetric flow rate, 𝑄" (in m3/s) was measured using a gas
187
flowmeter for several different pressure differentials, ∆𝑃 (we define ∆𝑃 as the upstream pore fluid 188
pressure, 𝑃% (in Pa), minus the downstream pore fluid pressure, 𝑃& (in Pa)). In our permeameter 189
setup, 𝑃& is the atmospheric pressure (assumed to be 101325 Pa). The Darcian permeability, 𝑘( 190 (in m2), was then determined for each of the pressure differentials using the following relationship 191 for compressible gas: 192 193 𝑘(= 𝑄" 𝑃*∆𝑃 𝜇𝐿𝑃& 𝐴 . (1) 194 195 Where 𝜇 is the pore fluid viscosity (viscosity of argon and nitrogen at 20 °C was taken as 2.22 × 196 10-5 and 1.76 × 10⁻⁵ Pa s, respectively; values taken from the National Institute of Standards and 197 Technology, https://www.nist.gov/), 𝐴 (in m2) and 𝐿 (in m) are the sample cross sectional area 198
and the sample length, respectively, and 𝑃* is the mean pore fluid pressure (i.e. (𝑃%+ 𝑃&)/2). We
199 calculate 𝑘( for a range of different pressure differentials (typically six) to assess whether fluid 200 flow departs from Darican flow (i.e. Equation 1). We assume a constant pore fluid density and 201 viscosity for our measurements, a valid assumption for the very low pressure differentials used 202 in this study (the pressure differential never exceeded 0.5 MPa). Fluid flow can be complicated by 203 gas slippage (the Klinkenberg effect; Klinkenberg, 1941) and/or by turbulence (the Forchheimer 204 effect; Forchheimer, 1901). We first check whether a Forchheimer correction is needed. To do so, 205
we plot 1/𝑘( for each pressure differential, ∆𝑃, as a function of 𝑄". If these data can be well 206
described by a positive linear slope, the Forchheimer-corrected permeability 𝑘6789: is the inverse 207
of the y-intercept of the best-fit linear regression of this relationship. If the Forchheimer 208 correction is needed, it is then necessary to check whether the Klinkenberg correction is needed. 209 To check whether the Klinkenberg correction is needed, we calculate 𝑘6789: for each pressure 210 differential, ∆𝑃, using the following relation: 211
212 1 𝑘(= 𝜉𝑄"+ 1 𝑘6789:. (2) 213 214
Where the slope of the plot of 1/𝑘( as a function of 𝑄" is given by 𝜉. The Klinkenberg correction 215
is needed if the data on a plot of 𝑘6789: as a function of 1/𝑃* can be well described by a positive
216 linear slope. If this is true, the permeability is the y-intercept of the best-fit linear regression of 217 these data. If the data cannot be well described by a positive linear relationship, the permeability 218 is the inverse of the y-intercept of the best-fit linear regression on the plot of 1/𝑘( as a function of 219
𝑄" (i.e. 𝑘6789:). If the Forchheimer correction is not needed, we assess the need for the
220
Klinkenberg correction by plotting 𝑘( as a function of 1/𝑃*. If the data can well described by a 221
positive linear slope, a Klinkenberg correction is required and the permeability is the y-intercept 222
of the best-fit linear regression on the graph of 𝑘( as a function of 1/𝑃*. If no corrections are
223
needed, the permeability is taken as the positive slope of the plot of 𝑄" as a function the mean 224
pore fluid pressure 𝑃* multiplied by ∆𝑃. These ancillary corrections were implemented on a case-225
by-case basis (we refer the reader to Heap et al. (2018a) for examples). The values of the 226 coefficient of determination (𝑅=) for the best-fit regressions, when applied, were between 0.98 227 and 0.99, where a value of unity represents perfect agreement. A more detailed description of our 228 permeability data analysis technique can be found in Heap et al. (2017). 229
To assess the size of the smallest pore apertures of a tuffisite, we performed mercury 230
injection porosimetry on a piece (4.7 g) of the BTB sample using a Micromeritics Autopore IV 231
9500. The mercury equilibration time and filling pressure were 10 s and ~3585 Pa, respectively. 232
The evacuation time and evacuation pressure were 5 min and 50 μmHg, respectively. The 233 pressure range was ~690 Pa up to ~414 MPa. Data from a mercury injection test were used to 234 calculate the pore throat size distribution of the sample (ASTM D4404-10, 2010). We corrected 235 the mercury injection data for the “low pressure correction”, as recommended by the American 236 Society for Testing and Materials (ASTM D4404-10, 2010). 237
The dissolved H2O concentration was measured along a profile from the boundary of the
238
tuffisite in the CH5G sample (position of the profile is shown on an inset in Figure 6c) using 239
synchrotron-source Fourier Transform infrared spectroscopy (SFTIR) at the Diamond Light 240
Source (UK) MIRIAM beamline. A Hyperion 3000 microscope with a broadband MCT detector was 241
coupled to a Bruker Vertex 80V FTIR interferometer with KBr beamsplitter. A 10 μm square 242
aperture was used and 128 spectra were collected in transmission mode at 8 cm−1 spectral
243
resolution between 4000-1000 cm−1. Wafer thickness (average thickness of 90 μm) was measured
244
using either a digital micrometer (precision ±3 μm) or by the reflection fringe method (von Aulock 245
et al., 2014). Peak heights at 3550 cm−1 (H2Ot) and 1630 cm−1 (H2Om
) were determined using 18-246 point linear baseline corrections. Using the Beer-Lambert Law, a glass density of 2281 kg m−3 247 (Saubin et al., 2016), and absorption coefficients of 80 l mol−1 cm−1 (3550 cm−1; Ihinger et al., 1994) 248 and 55 l mol−1 cm−1 (1630 cm−1; Newman et al., 1986; Okumura et al., 2003), we converted these 249 data to species concentrations. The combined uncertainty of this method, which depends on the 250 wafer thickness and density and the choice of molar absorption coefficient, is typically <10% (von 251
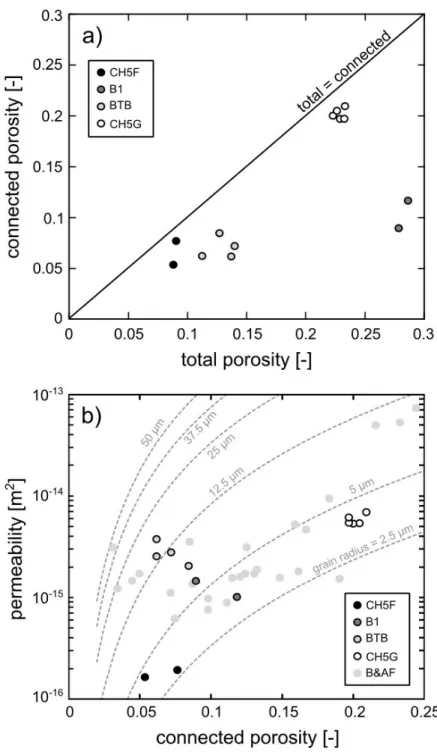
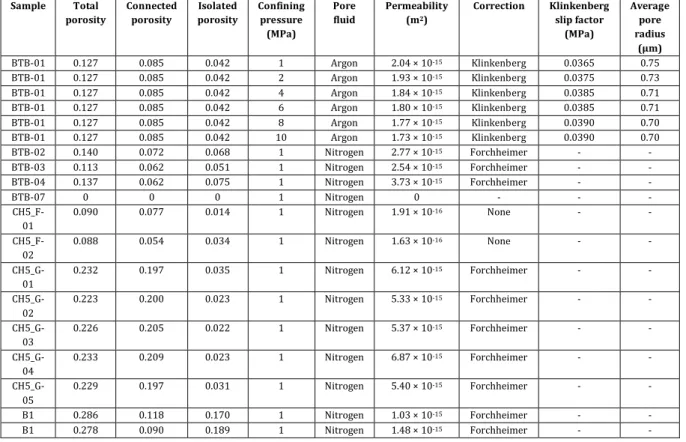
Aulock et al., 2014). We compare these data with those already collected for the BTB sample 252 (presented in Saubin et al., 2016) using the same technique. 253 254 4 Results 255 Connected porosity as a function of total porosity is shown in Figure 5a (data available in 256 Table 1). The connected porosity of these tuffisites varies from ~0.05 to ~0.2 (Figure 5a; Table 1). 257 All of the measured tuffisites contain isolated porosity. The three samples from Chaitén contain 258
isolated porosities between ~0.01 and ~0.075, whereas the B1 sample from Cordón Caulle 259 contains a very high isolated porosity of ~0.17-0.19 (Figure 5a; Table 1). 260 Permeability as a function of connected porosity is shown in Figure 5b (data available in 261 Table 1). CH5G contains the largest connected porosity (~0.2) and has the largest permeability 262 (~6 ´ 10-15 m2). Although BTB and CH5F contain similar connected porosities (~0.07), BTB is 263 approximately an order of magnitude more permeable (~3 ´ 10-15 m2 compared to ~6 ´ 10-16 m2; 264
Figure 5b; Table 1). The connected porosity of B1 is larger (up to ~0.12) than both CH5G and BTB, 265
but has a permeability close to that of BTB (Figure 5b; Table 1). The porosity and permeability of 266
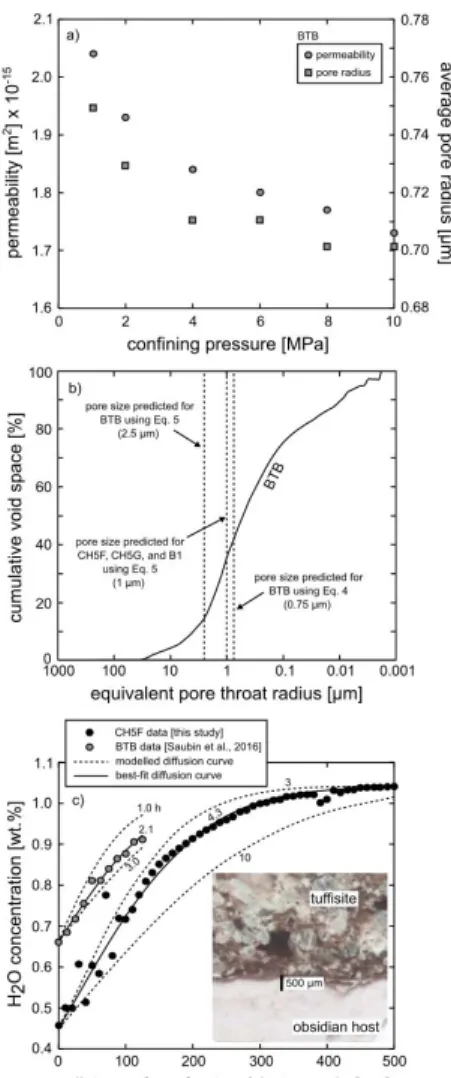
the obsidian host were found to be within error of zero (Table 1). Data at elevated confining 267 pressure show that tuffisite permeability does not change significantly up to 10 MPa (Figure 6a). 268 The permeability of the BTB sample was reduced from 2.04 ´ 10-15 m2 at a confining pressure of 269 1 MPa to 1.73 ´ 10-15 m2 at a confining pressure of 10 MPa (Figure 6a; Table 1). 270 The data from the mercury injection experiment (Figure 6b) indicate that about 8% of the 271
connected void volume is connected by pore throats that are >5 µm in radius, 72% of the 272 connected void volume is connected by pore throats between 0.05 and 5 µm in radius, and 20% 273 of the connected void volume is connected by pore throats <0.05 µm in radius. 274 In sample CH5F, the H2O concentration is 0.46 wt.% at the tuffisite boundary and reaches 275 a constant value of 1.04 wt.% at ~400 µm from the boundary (black symbols on Figure 6c). The 276
H2O concentration in the BTB sample (data from Saubin et al., 2016) is ~0.65 wt.% at the
277 boundary of a vesicular clast and increases to ~0.9 wt.% at a distance of ~100 µm (grey symbols 278 on Figure 6c). 279 280 5 Discussion 281 282 5.1 Isolated porosity within the tuffisites 283 Our data show that the all of the measured tuffisites contain isolated porosity (Figure 5a; 284 Table 1). The high isolated porosity of these samples is due to the presence of vesiculated juvenile 285
clasts, which typically contain glassy rim with a porosity and therefore permeability of zero 286 (Figures 3 and 4). Sample B1, from Cordón Caulle, contains abundant vesiculated juvenile clasts 287 (Figures 4e and 4f) and, as a result, contains the largest isolated porosity of ~0.17-0.19 (Figure 288 5a; Table 1). Since the porosity in these clasts is isolated (encapsulated within a zero porosity 289 glassy rim; Figures 3 and 4), it does not therefore contribute to the permeability of the samples. 290 291
5.2 Permeability modelling: pore and grainsize analyses 292
The collected porosity and permeability data can be interrogated to better understand (1) 293
the average pore radius used by the gas molecules to travel through the tuffisite, and (2) the 294 particle size that likely controls the efficiency of viscous sintering. 295 First, we estimate of the average radius of the pores used by the gas molecules using the 296 Klinkenberg slip factor, 𝑏 (a calculation only possible for the data that required a Klinkenberg 297 correction, see Table 1). Since the mean free path is inversely proportional to the mean pore fluid 298 pressure, Poiseuille’s law for gas flow in a cylindrical tube and Darcy’s law for flow in a porous 299 medium provide the following relation: 300 301 𝑘?@AB? = 𝑘(C1 + 𝑏 𝑃*D. (3) 302 303
Where 𝑘?@AB? is gas permeability corrected by the Klinkenberg correction (see the methods 304
section for details). Assuming a cylindrical pore shape, the average pore radius 𝑎 used by the gas 305
molecules can then be estimated using the following relationship (Civan, 2010; Firouzi et al., 306 2014): 307 308 𝑎 = 4 𝑏𝜂I 𝜋𝑅K𝑇 2𝑀N . (4) 309 310 Where 𝑇 is the temperature (293 K for room-temperature laboratory conditions), 𝑀N is the molar 311
mass of the argon pore fluid (0.03995 kg mol-1), and 𝑅K is the ideal gas constant (8.31 J mol-1 K-1).
312
This method has been used to estimate the average pore radius of the flow path in shales, (e.g., 313
Firouzi et al., 2014; Heller et al., 2014; Letham and Bustin, 2015), volcanic rocks (Heap et al., 314 2018a), and limestones (Heap et al., 2018b). We find an average pore radius of 0.75 µm for the 315 BTB sample at a confining pressure of 1 MPa (Figure 6a). The average pore radius estimated using 316 Equation (4) is reduced only slightly (to 0.70 µm) when the confining pressure is increased to 10 317
MPa (Figure 6a). The average pore radius estimated using the Klinkenberg slip factor highlights 318 the complexity of the flow path within the BTB tuffisite. For example, although 40% of the void 319 space within the tuffisite is connected by pore throats with a radius greater than 1 µm (Figure 6b), 320
the gas travels through narrow microstructural elements (with a radius < 1 µm). Because the 321 permeability and the average pore radius used by the gas do not vary considerably with pressure 322 (Figure 6a), it is likely that these narrow microstructural elements are the tortuous inter-granular 323 pores characteristic of sintering systems (microcracks are easily closed as confining pressure is 324 increased; e.g., Nara et al., 2011). These data therefore highlight that our measurements at 1 MPa 325 are relevant for in-situ tuffisites and that their compressibility is low even under relevant upper 326 conduit pressures. 327
Wadsworth et al. (2016a) provide a model for predicting first the characteristic 328
lengthscale of the pore network, 1/𝑠, and second the permeability, 𝑘(, of sintered granular 329 materials for which the inter-grain spaces are the pore network. The modelled permeability is 330 given by (Wadsworth et al., 2016a): 331 332 𝑘(=2[1 − (𝜙 − 𝜙9)] 𝑠= (𝜙 − 𝜙9)T̅, (5) 333 where 𝑠 is the specific surface area, i.e. the ratio of pore surface area within the sample to the 334 sample volume (in m-1), 𝜙 9 is the porosity of the percolation threshold at which the permeability 335 can be considered zero, and 𝑒̅ is a percolation exponent. As noted by Wadsworth et al. (2016a), 336 this model has the appealing features that the permeability falls to zero as 𝜙 → 𝜙9, and for all 𝜙 337 above 𝜙9, it has a power-law dependence on 𝜙, for which the exponent is 𝑒̅, similar to theoretical 338 constraints (Feng et al., 1987). Feng et al. (1987) constrained 𝑒̅ = 4.4 based on theoretical scaling, 339 while empirical fits to a large range of data collected for variably welded granular rocks yield 𝑒̅ = 340
4.2 ± 0.3 (Wadsworth et al., 2016a). 𝜙9 is typically around 0.03 for initially granular systems 341
(Rintoul et al., 2000; Wadsworth et al., 2016b). The specific surface area is then related to the pore 342
radius via 𝑠 = 3(1 − 𝜙) ln(1 − 𝜙) /𝑎 assuming that the pore network can be approximated as a 343
pack of overlapping spherical pores (see Torquato, 2013). Finally, the pore radius 𝑎 is predicted 344
at the initial packing porosity (𝜙A = 0.5) from the grainsize distribution, using the mean of the 345
distribution 〈𝑅〉 and the porosity after Torquato and Avellaneda (1991), with the full solution 346
provided in Wadsworth et al. (2016a). We then compare the modelled permeability curves (using 347
Equation 5), solved for a range of mean grainsize 〈𝑅〉, with our porosity and permeability 348
measurements for the tuffisite samples (Figure 5b). The measured porosity and permeability data 349
are consistent with initial grain radii of 2.5 < 〈𝑅〉 < 15 µm (Figure 5). Although these inferred 350
radii are small compared to the fragments readily identifiable in our microstructural work 351
(Figures 3 and 4), they are consistent with previous measurements of the fine fraction that 352 dominates the matrix in the BTB sample (Saubin et al., 2016). This range of predicted grainsizes 353 is therefore likely to represent the grainsize that controls the efficiency of viscous sintering—a 354 result of the inverse grainsize dependence of the sintering rate (Wadsworth et al., 2014). The 355
grainsizes predicted using this approach are similar to those predicted for similar variably 356 sintered, granular volcanic material (welded block-and-ash flow deposits, BAF, from Mt. Meager 357 in Canada; data taken from Heap et al., 2015), shown as light grey-coloured circles in Figure 5b. 358 Next we use an empirical fitting procedure to predict the pore radii for each tuffisite. We 359 assume that Equation (5) is a valid description of the permeability as a function of the porosity, 360
and that 𝑒̅ = 4.2 and 𝜙9 = 0.03. We use the Excel Solver tool to minimise for a single controlling 361 value of 𝑠 for each sample and to assess the uncertainties that result using the method outlined in 362 Kemmer and Keller (2010). This yields a fitted 𝑠 that can be converted to a mean pore radius 363 characteristic of flow through the sample using the above 𝑠(𝑎, 𝜙) result. The output is 𝑎 = 2.5 ± 364
0.9 µm for the BTB sample, and 𝑎 = 1.0 ± 0.4 µm for the CH5F, CH5G, and B1 samples. This 365
provides a natural method to normalise the permeability by 𝑘𝑠=/(2[1 − (𝜙 − 𝜙
9)]). In Figure 7
366
we demonstrate that this method results in a collapse of the data to a single permeability 367
description that is consistent with both 4.2 < 𝑒̅ < 4.4, as predicted by theory (Feng, 1987; 368
Wadsworth et al., 2016a, 2017b). We also plot the welded block-and-ash flow data from Heap et 369
al. (2015) and the data for tuffisites found on the dome of Volcán de Colima, an andesitic 370
stratovolcano in Mexico (permeability measured using the TinyPerm II field permeameter; 371
Kendrick et al., 2016). These data also collapse on our permeability description (Figure 7). 372 Additionally, the pore radii resulting from this method (1-2.5 µm) are within a factor of 2 of those 373 calculated from the Klinkenberg factor (0.7-0.75 µm) and within the range measured by mercury 374 injection porosimetry (Figure 6b). 375 The above approach provides several methods for predicting the controlling lengthscales 376 for fluid flow through samples of this type, including direct measurements. We have shown that 377
use of Equation (5) results in good collapse of the data (and data for other welded volcanic 378 materials and tuffisites from Mt. Meager and Volcán de Colima, respectively; Figure 7) to a single 379 dimensionless description, which lends confidence to the generality of this model. We propose 380 that this may be a useful tool for predicting the permeability decay of evolving tuffisites as they 381 sinter and heal in silicic volcanoes. 382 383 5.3 H2O diffusion modelling 384 Modelling the depletion in H2O adjacent from the tuffisite-host rock boundary, or from the 385 boundary of a vesicular clast within the tuffisite, provides an estimate of the time between fracture 386 filling and final quenching (e.g., Castro et al., 2012). Our modelling of the H2O diffusion profiles 387
employed an error-function solution to Fick’s general diffusion equation cast in 1D Cartesian 388 coordinates for a constant diffusivity (after Crank, 1979): 389 390 𝑐e− 𝑐f 𝑐g− 𝑐f = 1 − erf k 𝑥 2√𝐷𝑡p. (6) 391 392
Where cx denotes the concentration of H2O (in wt.%) at a distance of x from the fracture/clast
393
boundary (m), cb is the H2O concentration of the far-field in the host obsidian (in wt.%), c0 is the
394
(lower) H2O concentration within the tuffisite defining the limit at the tuffisite wall (in wt.%), 𝑡 is
395
time (s), and the H2O diffusivity (m2 s−1) is given by 𝐷. H2O molecules were assumed to be the only
396
species diffusing (e.g., Behrens & Nowak, 1997) and the magmatic temperature was assumed to 397
be constant at 825 °C (a value constrained by the petrological experiments of Castro & Dingwell, 398
2009). Boundary conditions were fixed at the far-field H2O concentration c0, as defined from
399
diffusion profiles, and the lowest H2O concentration cb as measured at the fracture/clast
400
boundary. The H2O diffusivity was calculated using the concentration- and
temperature-401 dependent model for rhyolitic melt of Zhang (1999): 402 403 𝐷rstu = C𝑐 𝑐8D exp k−16.83 − 10992 𝑇 p, (7) 404 405
where 𝑐 is the local H2O concentration (in wt.%), cr is a reference H2O concentration of 1 wt.% (see
406
Figure 6c and Zhang (1999)), and 𝑇 is the temperature (K). As the error function diffusion solution 407
assumes a constant diffusivity, which we take to be the diffusivity calculated using Equation 7 for 408
a value of 𝑐 = 0.75 wt.%, which is the arithmetic mean of the measured c0 and cb (yielding 𝐷rstu =
409
1.6 ´ 10-12 m2s-1). Because the difference between diffusivities at c0 and cb is modest (1 ´ 10-12 m2s
-410
1 at 0.46 wt.% H2O, and 2.3 ´ 10-12 m2s-1 at 1.04 wt.% H2O), using this mean value provides a
411
reasonable approximation of the diffusivity over the whole profile. We note that taking the mean 412
of the two end-member diffusivities additionally assumes that the non-linearity of 𝐷rstu(𝐻=𝑂|) is 413
negligible. Using this method and fitting the diffusion model to the measured H2O depletion
414
adjacent to the fracture/clast boundary of the CH5F and BTB tuffisites with the time as an 415
adjustable parameter (and fitting using a least squares minimisation method described above) 416
yields times of ~4 and ~2 h, respectively, for the time between fracture opening and final 417 quenching (Figure 6c). It is important to highlight these timescales are minima, and they depend 418 heavily on the model assumptions, such as the temperature. For example, Castro et al. (2012) 419 showed that reducing the temperature by 200 °C increased this timescale from minutes to several 420 tens of hours. Nevertheless, these predicted timescales compare well with other estimates of the 421 lifetimes of tuffisites from Chaitén volcano (Castro et al., 2012). 422 423
5.4 The lifespan of a tuffisite 424 In the general conceptual scheme explored here, we envisage conduit-filling rhyolite lava 425 that is periodically fractured by high-pressure gas and ash from below (e.g., Schipper et al., 2013). 426 These processes involve the opening of the fracture, the transport of gas and ash, the clogging of 427
the fracture, and a slower, time-dependent sintering of the fracture infill. In concert then, the 428 outgassing time available for removing pressurised gas through the fractures is therefore the sum 429 of the time from opening to clogging with pyroclastic debris, 𝜆~, and the time for sintering once 430 the tuffisite is formed and welds shut, 𝜆. The time 𝜆~ from video footage of fractures opening and 431 closing appears to be on the order of tens of seconds (Figure 1). The mass of gas and ash removed 432 during this time, which could be used to compute the pressure decrease, is difficult to assess. But 433 it is clear from the video footage (Figure 1; Schipper et al., 2013) that the outgassing continues, 434 albeit more slowly, during the post-clogging sintering of the fracture infill, with the emission of 435 vapour only (i.e. without the ash phase). 436 Once the fracture has become clogged with pyroclastic debris, the process of sintering will 437 act to reduce porosity and permeability towards zero. It is the timescale of sintering that is the 438
key quantity in determining the efficacy of tuffisites as outgassing pathways after the open 439 fracture is clogged with particles. In the absence of applied force on the sides of the fracture, the 440 characteristic timescale associated with this process is the sintering timescale 𝜆 = 〈𝑅〉𝜇/𝛤, where 441 𝜇 is the viscosity of the melt and 𝛤 is the melt-vapour surface tension. 〈𝑅〉, the mean grainsize, has 442 been shown to capture sintering dynamics even in highly polydisperse distributions (Wadsworth 443
et al., 2017a). In other words, although estimates of 〈𝑅〉 are small compared to the larger 444 fragments readily identifiable in our microstructural work (Figures 3 and 4), it is the finer particle 445 fraction that dictates the efficiency of viscous sintering—a result of the grainsize dependence of 446 the sintering time (Gardner et al., 2018; Wadsworth et al., 2014; 2016b). When a force is applied 447 to the fracture walls (such as a lithostatic pressure or the stress imparted by a recently opened 448 adjacent fracture), however, 𝜆 will not be the controlling timescale, and the system is more likely 449 to close over a compaction timescale 𝜆= ≈ 𝜇/(𝜎𝛼), where 𝜎 is the applied stress (in Pa) on the 450
fracture walls, and 𝛼 is an empirical factor (Farquharson et al., 2017; Quane et al., 2005) that was 451 calibrated for sintering polydisperse particles similar to the tuffisites studied here (the block-and-452 ash flow deposits from Mt. Meager; Figure 5) to be 𝛼 ≈ 2 (Heap et al., 2014). This is broadly similar 453 to other compaction timescale approximations (Kennedy et al., 2016; McKenzie, 2011). If surface 454 tension stress 2𝛤/〈𝑅〉 dominates over the stress applied to the fracture walls 𝜎, then 𝜆 should be 455 used. If instead the opposite is true, and the fracture wall stress dominates the surface tension 456
stress, then 𝜆= should be used. In each respective case, the total outgassing time is 𝜆~+ 𝜆 or 𝜆~+
457 𝜆=. 458
To illustrate how 𝜆 and 𝜆= vary, we take 𝛤 = 0.3 N/m for moderately dry rhyolites 459 (Gardner & Ketcham, 2011). We note that 𝛤 is significantly lower in rhyolites with up to ~4 wt.% 460 dissolved water, but there are no measurements in the intermediate range of water contents, and 461 these rhyolites are erupted close to the dry limit (Castro et al., 2014; Saubin et al., 2016). The melt 462 viscosity of tuffisites from Chaitén (samples BTB and CH5F) and Cordón Caulle (sample B1) can 463 be estimated using a multicomponent viscosity model (Giordano et al., 2008), using major element 464 composition (using the compositions provided in Castro and Dingwell (2009) for Chaitén and in 465 Alloway et al. (2015) for Cordón Caulle), an inferred eruptive temperature of 825 °C for Chaitén 466 (Castro & Dingwell, 2009) and 890 °C for Cordón Caulle (Castro et al., 2013; Alloway et al., 2015), 467
and measured H2O concentrations. H2O concentrations of 0.74 and 0.34 wt.% were taken for,
468 respectively, the host obsidian and tuffisite in the BTB sample (Saubin et al. (2016), and 1.04 and 469 0.46 wt.% were taken for the host obsidian and tuffisite in the CH5F sample (see Figure 6c)). For 470 the B1 sample, measurements on eruptive products from the 2012-2013 Cordón Caulle eruption 471 provided a range of H2O concentration between 0.1 and 0.5 wt.% (Militzer, 2013). The resulting 472 viscosity range estimations were calculated to be 10„.g… < 𝜇 < 10†.g‡ Pa s for the BTB sample, 473 10‡.ˆ‰ < 𝜇 < 10„.ˆ… Pa s for the CH5F sample, and 10‡.~… < 𝜇 < 10„.=Š Pa s for the B1 sample. 474 We assume, given the relationship between sintering timescale and grainsize (Wadsworth 475
et al., 2014), that the viscosity of the fine-grained matrix controls viscous sintering. For the 476
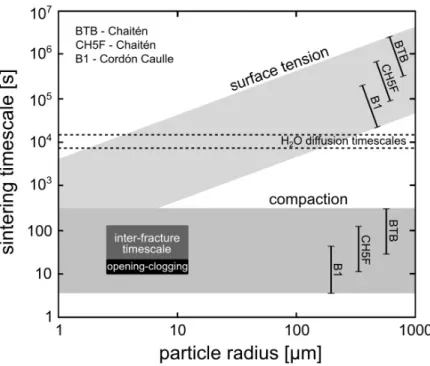
variability in 〈𝑅〉 predicted here (2.5 < 〈𝑅〉 < 15 µm; Figure 5b), sintering times in the absence of 477
applied forces 𝜆 are between 6 min and 5 h, between 16 min and 13.6 h, and between 2 min and 478 2.4 h for CH5F, BTB, and B1 respectively (Figure 8). To compute 𝜆=, as a first-order estimate we 479 take 𝜎 = 2 MPa, which is computed by matching the solubility of water (assuming 100% of the 480 pressure is water vapour pressure) based on Liu et al. (2005), to the value measured at the tuffisite 481
wall 𝑐g. This yields values of 𝜆= (for the variability in 〈𝑅〉 predicted here) between 11 s and 2 min, 482 between 28 s and 5 min, and between 3.5 s and 42 s for CH5F, BTB, and B1 respectively (Figure 483 8). We again highlight that these timescales depend on the model input parameters: differences 484 in viscosity (resulting from changes to the eruptive temperature and/or the water content, for 485 example) can significantly modify these predictions. We also plot on Figure 8 an estimated range 486 for the time from fracture opening to clogging with pyroclastic debris, 𝜆~ (10-20 s, estimated using 487 available video footage form Cordón Caulle; Figure 1; Schipper et al., 2013) and the inter-fracture 488
timescale (𝜆~+ 𝜆 or 𝜆~+ 𝜆=) (20-120 s; Schipper et al., 2013). These observed timescales are 489 faster than the timescales solely predicted from surface tension and are much more consistent 490 with the estimated range of compaction timescales (Figure 8), suggesting that compaction driven 491 by the overburden (lithostatic) stress plays a key role in governing the lifetimes of these tuffisites. 492 Although depth estimations for tuffisites at Cordón Caulle are shallower (depth of about 50 m; 493 Schipper et al., 2013) than those estimated for Chaitén, we note that a reduction in 𝜎 from 2 to 1 494 MPa only doubles the 𝜆= timescale and, even in this scenario, our estimated compaction timescales 495
are still in line with the observed timescales. We further note that our estimated compaction 496
timescales consider lithostatic pressures only and do not take stresses imparted by recently 497
opened adjacent fractures into account. 498
H2O diffusion offers an independent tuffisite chronometer to these estimated viscous
499
sintering timescales. The best-fit diffusion model (Figure 6c) to the measured H2O depletion
500
adjacent to the fracture/clast boundary of the CH5F and BTB tuffisites yields timescales 𝜆& (time 501 between fracture opening and final quenching) of ~4 and ~2 h, respectively (as shown in the 502 previous section). These predicted timescales compare well with other estimates of the lifetimes 503 of tuffisites from Chaitén volcano and elsewhere (Berlo et al., 2013; Cabrera et al., 2011; Castro et 504
al., 2012; Saubin et al. 2016). Further, we highlight that viscous sintering timescales were also 505 found to coincide with H2O re-equilibration timescales in obsidian pyroclasts from Mono Craters 506 (USA) that were assembled from juvenile particles during magma ascent (Gardner et al., 2017), 507 suggesting that viscous sintering plays an important role in cyclic fragmentation behaviour and 508
apparent open-system degassing (Gardner et al., 2017; Rust et al., 2004; Tuffen et al., 2003; 509
Watkins et al., 2017). Our predicted H2O diffusion timescales are, however, longer than the
510
observed inter-fracture timescales and the timescales predicted for compaction-driven sintering 511
(Figure 8). Because H2O diffusion can continue even after compaction renders permeable gas flow
512
ineffective, we consider that 𝜆& is the sum of the fracture opening timescale (𝜆~), the sintering or 513
compaction timescale (𝜆 or 𝜆=), and a quenching timescale. According to our analysis, the 514
quenching timescale is therefore likely to be on the order of a couple of hours, consistent with 515
conductive cooling of bombs tens of centimetres in diameter (e.g., Saubin et al., 2016). We also 516
highlight the numerous model assumptions that may influence our predicted H2O diffusion
517
timescales, such as, for example, using a steady eruptive temperature and a single step in H2O
518
activity at the fracture walls. Furthermore, observations at Cordón Caulle highlight that ash jetting 519
can occur from the same fracture and, since H2O diffusion would necessarily continue, the
520
repeated use of the same fracture could also help explain the discrepancy between the H2O
521
diffusion timescales and the timescales required for compaction, pressurisation, and 522 fragmentation. 523 524 5.5 Pressurisation and outgassing at silicic lava flows and domes 525
Before discussing the potential role of tuffisites in influencing conduit processes and 526
outgassing during silicic eruptions, it is important to address the question: how common are 527
tuffisites? Providing a robust answer to this question for active volcanoes such as Chaitén or 528
Cordón Caulle is problematic, in part because fully mature, densely welded tuffisite is likely 529
indistinguishable from dense obsidian (see Castro et al., 2014). Calculations presented in Castro 530
et al. (2012) suggest that a dense spacing of tuffisites (approximately a tuffisite every 0.01-0.001 531
m) would be required to fully degas a silicic magma in the approximate times available. Such high 532 tuffisite number densities are considered consistent with evidence that obsidian lavas have been 533 thoroughly fractured and then re-healed (or annealed) to dense glass (Castro et al., 2012, 2014). 534 Further, several field campaigns at Chaitén volcano have highlighted that bombs on the crater rim 535
and flanks commonly host tuffisites, the width of which typically ranged from a couple of 536
millimetres up to a few tens of millimetres. Evidence of high tuffisite number densities from 537
dissected rhyolitic conduits in Iceland (McGowan, 2016) provides support to the high densities 538
predicted for Chaitén volcano by Castro et al. (2012). For example a 5 m line transect in a dissected 539
rhyolitic conduit in Iceland contained 282 tuffisites (McGowan, 2016). Although the tuffisite 540 number density from this dissected conduit may contains different generations of tuffisites (i.e. 541 all 282 tuffisites may not have been active at the same time), this number speaks to the ubiquity, 542 and therefore potential importance, of these features in rhyolitic conduits. We also note that, even 543
if tuffisites are relatively uncommon, their influence on the permeability of an otherwise 544 impermeable magmatic plug can be very large. For example, a single permeable pathway within 545 an large low-permeability rock mass can increase the equivalent permeability of the system by 546 many orders of magnitude, as discussed in, for example, Heap and Kennedy (2016), Farquharson 547 et al. (2017), and Farquharson and Wadsworth (2018). Finally, although the outgassing flux could 548 be computed using either Darcy law (low Reynolds number) or the Forchheimer equation using 549
the constraints of permeability provided herein, we note that while our determination of the 550 porosity-permeability relationship is valid locally, the depth-dependent stress and the coupling 551 between the evolving gas pressure and the sintering rates demands a full numerical solution (e.g., 552 Michaut et al., 2013). We propose that fertile future research could use our model, validated using 553 empirical data on tuffisites, to provide a tuffisite outgassing model for rhyolitic volcanoes. 554 In upper conduits characterised by dense, impermeable magmatic plugs and host rock (i.e. 555 a “closed system”; see the modelling of Diller et al., 2006; Collinson & Neuberg, 2012), we propose 556 here that the recurrence timescale of explosive venting must, in a broad sense, equal the sum of 557
the timescales of tuffisite sintering, pressurisation, and fragmentation. Our study provides 558
estimates spanning seconds (in the case of compaction-driven sintering) to hours (in the case of 559
surface tension-driven sintering) for the thorough sintering of tuffisites and we can assume that 560
the timescale for fragmentation is necessarily small compared to the other timescales. The 561
timescale for pressurisation, which will depend on, among other factors, the ascent rate and 562 volatile budget of the magma, is the missing constraint. Therefore, the sintering times estimated 563 herein must be less than or equal, and cannot be longer, than the explosive venting timescale. 564 Indeed, the observed range of cyclic pressurisation and ash venting timescales at erupting silicic 565
lava domes at, for example, Santiaguito volcano (Guatemala) and Soufriere Hills volcano 566 (Montserrat; Holland et al., 2011; Johnson et al., 2008; Voight et al., 1999), is consistent with our 567 timescale estimates for the thorough sintering of tuffisites. This may imply that pressurisation 568 timescales can be short or, and perhaps more likely, that pressurisation begins before the tuffisites 569 are completely sintered shut. Indeed, the presence of an H2O-rich clast population within the BTB 570 sample demonstrated that deeper, pressurised gas entered the shallower, lower-pressure fracture 571 system, consistent with the pressurisation of fractures/tuffisites prior to the destruction of their 572 permeability. 573 The low permeabilities attained by the CH5F (~10-16 m2; Figure 5b and Table 1) and the 574 BTB tuffisites (~10-15 m2; Figure 5b and Table 1) coincide with that of healed gas escape routes 575 modelled by Collinson and Neuberg (2012). We consider that the effective healing of tuffisites 576 likely therefore contributed to the upper conduit pressure accumulation that ultimately led to 577 their explosive ejection. Although clast vesiculation contributed to porosity loss within the BTB 578 tuffisite (alongside other mechanisms), the BTB tuffisite failed to attain the low permeability of 579 CH5F, interpreted here as the result of a shorter pre-ejection healing time within the conduit. 580 Nonetheless, the permeability attained by BTB (~10-15 m2) must have been sufficiently low to 581 render gas loss inefficient over its lifespan (pressure equilibrium time at this permeability >11 582 days; see also the modelling of Collinson & Neuberg, 2012; Chevalier et al., 2017). We note that it 583 is also possible that a healed tuffisite is not immediately ejected and undergoes additional viscous 584
compaction prior to ejection in a later fragmentation event – a plausible scenario given the 585
repetitive nature of tuffisite formation and healing (Tuffen et al., 2003). In this scenario, we would 586 expect the diffusion timescale to greatly exceed the sintering timescale. 587 The modelled source depths of upper conduit pressurisation are additionally consistent 588 with ejected bomb depths at Chaitén volcano, as inferred from bomb volatile concentrations (see 589 above and Saubin et al., 2016). It is therefore plausible that upper conduit pressurisation cycles 590 are modulated by sintering-driven blockage of initially permeable tuffisite networks, especially in 591 crystal-poor rhyolitic systems where melt-rich magma readily sinters. Equivalent observational 592
data from the 2008 eruption of Chaitén volcano is unfortunately lacking, but the filming of 593 pulsatory ash venting during the eruption of Cordón Caulle in 2011-2012 revealed significantly 594 shorter inter-explosion intervals (<40 s, Schipper et al., 2013; Figure 1), perhaps controlled by the 595 sintering of finer material. The rhyolite at Cordon Caulle is also of lower silica content than Chaitén 596 volcano and was erupted at comparatively higher temperatures (~890 °C; Castro et al., 2013), 597 factors that reduce melt viscosity and therefore sintering timescales (e.g., Gardner et al., 2018; 598 Figure 8). Nonetheless, limited video footage prior to the onset of the hybrid phase at Chaitén 599 volcano in 2008 (Figure 1b) records a key phase of eruption development, in which the initially 600 broad pyroclastic vent had constricted to several distinct vents tens of metres across above the 601 yet-to-emerge lava dome (also observed at Cordón Caulle). Such focusing of pyroclastic discharge 602 requires sintering of initially loose pyroclastic vent-filling material to gain strength and reduce 603 permeability (e.g., Heap et al., 2015; Kolzenburg et al., 2012; Kolzenburg & Russell, 2014). This 604 indicates that sintering processes can act to reconfigure conduit architecture during eruptions, 605 and the transition from initially Plinian to hybrid activity at Chaitén volcano can be conceptualised 606 as a decrease in the width of venting tuffisites from the entire conduit, through an intermediate 607
phase characterised by multiple vents tens of metres in breadth, to, finally, pathways only 608
centimetres wide such as observed in the BTB tuffisite (Figure 2a). Occlusion of outgassing 609
pathways by sintering encourages greater pressurisation of the upper conduit, and this is 610
proposed to be responsible for the forceful intrusion of a shallow laccolith at Cordón Caulle, whose 611
emplacement coincided with a marked narrowing of the vent prior to the onset of hybrid activity 612 (Castro et al., 2016). 613 The variable initial particle radius of a tuffisite relates to the efficiency of fragmentation 614 (Kueppers et al., 2006), together with sorting phenomena associated with clastic transport and 615 deposition (Tuffen et al., 2003). Fowler and Scheu (2016) demonstrate that, for a given porosity, 616 a larger overpressure release at fragmentation results in a smaller average grainsize. Owing to the 617
fact that viscous sintering timescales are shorter at small grainsizes (Gardner et al., 2018; 618 Wadsworth et al., 2014, 2016b), we conclude that violent decompression events associated with 619 fracture opening will create tuffisites capable of more rapid healing (for a given melt viscosity). 620 As healing can provoke repressurisation and explosive failure, the most energetic venting likely 621 involves the shortest duration cycles of pyroclast and gas ejection from fracture systems. 622 The accuracy of the calculations presented herein invariably rest on the accuracy of the 623 numerous model input parameters (such as the inferred temperatures used in our H2O diffusion 624 modelling and viscosity calculations) and, therefore, although we consider our assumptions as 625
well reasoned, the model predictions should still be treated with some caution. Further 626
outstanding complications include the time evolution of particle viscosity during sintering as 627 diffusive mass transport of water occurs in tuffisites (Castro et al., 2014), grainsize sorting during 628 transport and accumulation of clastic particles (Tuffen & Dingwell, 2005), frictional heating and 629 its potential role as a sintering accelerant, the entrainment of cooler lithics into tuffisites (although 630 we highlight that lithics represent a very small fraction of the total fracture fill; for example, Saubin 631 et al. (2016) found that the lithic content of the BTB sample was <0.5 vol.%), and the effect of high 632
particle-particle pressures in pore networks exceeding the capillary pressures of sintering 633
(Wadsworth et al., 2016b). We further note that the tuffisites documented here are also end-634
members in that they are hosted in dense obsidian; tuffisites in other systems characterised by a 635
more permeable host rock may behave, and be preserved, differently (e.g., tuffisites in a 636
pumiceous rhyolite host rock: Castro et al., 2012; the fractures documented at Volcán de Colima: 637
Farquharson et al., 2016; Kendrick et al., 2016; Kolzenburg et al., 2012; or the fractures seen 638
within pyroclasts from Katla, Iceland: Owen et al., 2019). Nevertheless, even in this scenario it is 639
likely that the initially granular fracture fill will be of a higher permeability than the host rock. 640
Therefore, although outgassing can occur through the host rock, we suggest that sintering 641
timescales will be similar to those reported herein for rhyolitic systems and that tuffisites that 642
form within a more permeable host rock will still play an important role in the cyclic bleeding and 643
accumulation of pore pressure thought to drive episodic explosive events at active volcanoes. 644
Indeed, connectivity between pumice-hosted tuffisites and exsolved gas in their vesicular walls 645
can greatly facilitate outgassing and may be a key process assisting the formation of dense, 646 compacted magma in shallow silicic conduits. 647 648 6 Concluding remarks 649
We conclude that if fractures in silicic lavas, domes, and vents are primary outgassing 650 pathways for local and deep-seated magma (Castro et al., 2014), then the longevity of open-system 651 outgassing from those fractures will scale with the timescale of viscous sintering. Our analyses 652 suggest that it is the timescale for sintering driven by compaction that provides the most realistic 653 timescale estimates and is likely therefore an important process dictating the lifespan of these 654 tuffisites. Importantly, the permeability of those fractures will decay toward zero over that same 655 timescale, rendering outgassing ineffective and permitting the pore pressure to build, eventually 656 driving subsequent explosions and rapid concomitant lava extrusion rates (e.g., Pallister et al., 657
2013). The grainsize dependence of viscous sintering (Gardner et al., 2018; Wadsworth et al., 658
2014, 2016b) suggests that the most energetic venting (i.e. the most efficient fragmentation; 659
Kueppers et al., 2006) likely involves shorter duration cycles of pyroclast and gas ejection from 660
fracture systems. The first-order constraint on lava and lava dome permeability evolution 661 presented herein could be used to compare with cycles of proximal geophysical and geochemical 662 signals such as conduit inflation, low-frequency seismicity, and surface emissions of gas and ash. 663 664 Acknowledgements and Data 665
M.J. Heap and H. Tuffen are indebted to the Royal Society International Exchanges 666
program for funding our project entitled “Volcanic valves: The permeability of tuffisites”. H. Tuffen 667
was additionally supported by a Royal Society University Research Fellowship and thanks 668
Lancaster University Sports Centre and grounds staff for assistance. J.M. Castro thanks support 669
from the VAMOS research center, University of Mainz. The first author acknowledges funding from 670
an Initiative d’Excellence (IDEX) “Attractivité” grant VOLPERM (funded by the University of 671 Strasbourg). We also thank Bertrand Renaudié, Jamie Farquharson, Jérémie Vasseur, Ed Llewellin, 672 Alexandra Kushnir, and Pauline Harlé. Gilles Morvan is thanked for technical support. The data 673 collected for this study can be found in Table 1. The comments of two anonymous reviewers, the 674 associate editor, and the editor helped improve this manuscript. 675 676
Figures 677 678 679 Figure 1. Explosive ash venting at (a) Cordón Caulle (January 10th 2012) and (b) Chaitén (May 680
10th 2008). (a) 𝑡 = 0 ash venting from a newly opened fracture (indicated by the arrow). 𝑡 = 4 ash
681
venting reaches a climax. 𝑡 = 11 ash venting from the fracture has stopped, highlighting the 682 transient, pulsatory nature of the process. See also Schipper et al. (2013). (b) The time-stamped 683 Chaitén frames illustrate the formation of a funnel shaped ash jet indicated by the arrow (scale 684 100 m). This jet is one of many pyroclastic vents that emanate from a lava plug that will days later 685 form a voluminous obsidian dome. 686
687 Figure 2. (a) Photograph of a large bomb in the crater of the 2008 Chaitén eruption containing a 688 tuffisite (the parent of the BTB block). The BTB tuffisite is 30 mm wide with remarkably planar 689 walls. It is connected to a network of sub-millimeter subsidiary tuffisites in the dense obsidian 690 host material (Saubin et al., 2016). (b) Photograph of the decametric breadcrust bomb from the 691
June 2011 hybrid activity at Cordón Caulle. (c) Photograph of a 20 mm-diameter cylindrical 692 sample of tuffisite CH5F (Chaitén). (d) Photograph of a 20 mm-diameter cylindrical sample of 693 tuffisite BTB (Chaitén). (e) Photograph of a 10 mm-diameter cylindrical sample of tuffisite CH5G 694 (Chaitén). (f) Photograph of a 20 mm-diameter cylindrical sample of tuffisite B1 (Cordón Caulle). 695
696
Figure 3. Backscattered scanning electron microscope (SEM) images of the BTB tuffisite. The 697 images show that the BTB tuffisite contains mixture of ash- and lapilli-sized juvenile and lithic 698 fragments. Some of the juvenile fragments have vesiculated centres (panels (a-d)). Lithic clasts 699 (rhyolite fragments) can be rounded (panel (c)) or banded/angular (panel (d)). Panel (b) shows 700 that the tuffisite-host rock boundary is curvilinear on the microscale. 701
702 Figure 4. Backscattered scanning electron microscope (SEM) images of the CH5F (panels (a-b)), 703 the CH5G (panels (c-d)), and the B1 (panels (e-f)) tuffisites. The images show that the tuffisites 704
contain mixture of ash- and lapilli-sized juvenile and lithic fragments. Lithic clasts (rhyolite 705
fragments) can be rounded (panels (b-c)) or banded/angular (panels (a) and (d)). Juvenile 706 fragments with vesiculated centres can be seen in samples CH5G (panel (d)) and B1 (panel (e)), 707 but are rare in sample CH5F (panel (b)). Glassy fragments are angular in sample CH5G (panels (c-708 d)), have diffuse boundaries in sample CH5F (panels (a-b)), and appear rounded in sample B1 709 (panel (f)). 710
711 Figure 5. (a) Connected porosity as a function of total porosity for the four tuffisite samples (BTB, 712 CH5F, CH5G, and B1). Measurement errors are smaller than the symbol size. (b) Permeability as 713 a function of porosity for the four tuffisite samples (BTB, CH5F, CH5G, and B1). Measurement 714 errors are smaller than the symbol size. Model curves (Equation 5) for a given initial particle radii 715 are also provided as grey dashed lines (Wadsworth et al., 2016a) (see discussion for details). Data 716 for variably sintered, granular volcanic material (welded block-and-ash flow; BAF) from Heap et 717 al. (2015) are plotted to provide a comparison (light grey circles). 718
719
Figure 6. (a) Permeability as a function of confining pressure (up to 10 MPa) for a sample of BTB. 720
Also shown is the average pore radius used by the gas molecules, as calculated using the 721
Klinkenberg slip factor (Equation 4) (see discussion for details). (b) Pore throat size distribution 722
(plot of cumulative void space as a function of pore throat diameter) determined using mercury 723
porosimetry. The pore throat diameters determined using the Klinkenberg analysis (Equation 724 (4)) and the permeability modelling (Equation (5)) are also indicated on the plot. (c) Measured 725 spatial variation in H2O from a clast margin for BTB (data from Saubin et al., 2016) and from the 726 host rock obsidian for CH5F. Best-fit modelled 1D diffusion curves (solid lines) are given for each 727 dataset (number in hours) (see discussion for details). We also provide neighbouring modelled 728 1D diffusion curves (dashed lines; number in hours) (see discussion for details). Inset on panel (c) 729 shows a photograph showing the location of the profile in sample CH5F. Images of the transect for 730 the BTB sample can be found in Saubin et al. (2016). 731
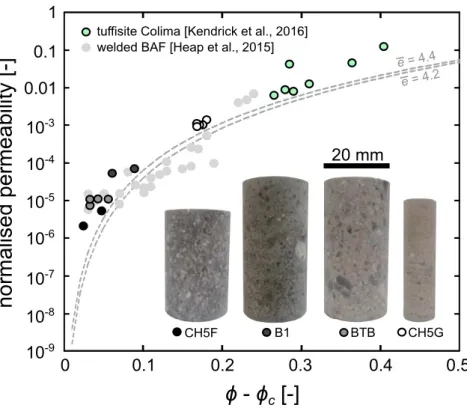
732 Figure 7. Normalised permeability (see text for details) as a function of 𝜙 − 𝜙9 (porosity minus 733 the porosity of the percolation threshold at which the permeability can be considered zero, taken 734 here as 𝜙9 = 0.03. The circles represent the experimental data (data unique to this study and data 735
from Heap et al. (2015) and Kendrick et al. (2016)) and collapse to a single permeability 736
description consistent with 4.2 < 𝑒̅ < 4.4 (the two grey dashed curves) (see text for details). 737