HAL Id: hal-00328388
https://hal.archives-ouvertes.fr/hal-00328388
Submitted on 14 Jun 2005
HAL is a multi-disciplinary open access
archive for the deposit and dissemination of
sci-entific research documents, whether they are
pub-lished or not. The documents may come from
teaching and research institutions in France or
abroad, or from public or private research centers.
L’archive ouverte pluridisciplinaire HAL, est
destinée au dépôt et à la diffusion de documents
scientifiques de niveau recherche, publiés ou non,
émanant des établissements d’enseignement et de
recherche français ou étrangers, des laboratoires
publics ou privés.
radiances, O3, NO2, and BrO: technical set-up and
validation of the method
F. Weidner, H. Bösch, H. Bovensmann, J. P. Burrows, A. Butz, C.
Camy-Peyret, M. Dorf, K. Gerilowski, W. Gurlit, U. Platt, et al.
To cite this version:
F. Weidner, H. Bösch, H. Bovensmann, J. P. Burrows, A. Butz, et al.. Balloon-borne limb profiling
of UV/vis skylight radiances, O3, NO2, and BrO: technical set-up and validation of the method.
At-mospheric Chemistry and Physics, European Geosciences Union, 2005, 5 (5), pp.1422. �hal-00328388�
www.atmos-chem-phys.org/acp/5/1409/ SRef-ID: 1680-7324/acp/2005-5-1409 European Geosciences Union
Chemistry
and Physics
Balloon-borne limb profiling of UV/vis skylight radiances, O
3
, NO
2
,
and BrO: technical set-up and validation of the method
F. Weidner1, H. B¨osch1,*, H. Bovensmann3, J. P. Burrows3, A. Butz1,2, C. Camy-Peyret2, M. Dorf1, K. Gerilowski3, W. Gurlit3, U. Platt1, C. von Friedeburg1, T. Wagner1, and K. Pfeilsticker1
1Institut f¨ur Umweltphysik, University of Heidelberg, Heidelberg, Germany
2Laboratoire de Physique Mol´eculaire et Applications (LPMA), Universit´e Pierre et Marie Curie, Paris, France 3Institut f¨ur Umweltphysik und Fernerkundung, University of Bremen, Bremen, Germany
*now at: Jet Propulsion Laboratory (JPL), Pasadena, USA
Received: 9 August 2004 – Published in Atmos. Chem. Phys. Discuss.: 24 November 2004 Revised: 2 May 2005 – Accepted: 9 May 2005 – Published: 14 June 2005
Abstract. A novel light-weight, elevation scanning and
ab-solutely calibrated UV/vis spectrometer and its application to balloon-borne limb radiance and trace gas profile measure-ments is described. Its performance and the novel method of balloon-borne UV/vis limb trace gas measurements has been tested against simultaneous observations of the same atmospheric parameters available from either (a) situ in-strumentation (cf., by an electrochemical cell (ECC) ozone sonde also deployed aboard the gondola) or (b) trace gas pro-files inferred from UV/vis/near IR solar occultation measure-ments performed on the same payload. The novel technique is also cross validated with radiative transfer modeling. Rea-sonable agreement is found (a) between measured and sim-ulated limb radiances and (b) inferred limb O3, NO2, and
BrO and correlative profile measurements when properly ac-counting for all relevant atmospheric parameters (tempera-ture, pressure, aerosol extinction, and major absorbers).
1 Introduction
In the past two decades remote sensing of the atmosphere by optical methods has evolved into a powerful tool for me-teorology, atmospheric photochemistry and climate studies. Most recently, space-borne UV/vis limb observations of the skylight have also become available, c.f. through the SME (Mount et al., 1983), SOLSE/LORE (McPeters et al., 2000), Odin/OSIRIS (Von Savigny et al., 2003; Sioris et al., 2003), Envisat/SCIAMACHY (Burrows et al., 1995) instruments.
The SCIAMACHY (SCanning Imaging Absorption spec-troMeter for Atmospheric CHartographY) on the ESA-Envisat satellite offers unprecedented possibilities for
at-Correspondence to: K. Pfeilsticker
mospheric remote sensing by monitoring a larger num-ber of atmospheric trace constituents by spectrally resolved UV/vis/near IR limb scattering observations. SCIAMACHY is a national contribution by Germany, the Netherlands and Belgium to the ESA-Envisat satellite, which was launched into a sun synchronous low orbit on 28 February 2002 (Bovensmann et al., 1999). SCIAMACHY simultaneously measures the atmospheric skylight in a variety of viewing di-rections and the extraterrestrial irradiance in the wavelength range from 220 nm to 2380 nm, at moderate spectral resolu-tion (e.g., Eichmann et al., 2003; Von Savigny et al., 2004 and 2005).
The UV/vis limb measurements of SCIAMACHY, how-ever, involve a number of methods which require careful vali-dation and verification through collocated ground-based, air-craft, and balloon-borne measurements. Among them, the modeling of the atmospheric radiative transfer (RT) – includ-ing the investigation of its sensitivities to a larger number of atmospheric parameters (cf., the temperature, pressure, ozone and aerosol profile, . . .) – is most challenging for the interpretation of UV/vis limb measurements.
Following the pioneering studies of McElroy (1988), we report here on one of the most stringent tests ever to validate the individual steps (spectral retrieval, RT modeling and pro-file inversion) – and thus of the whole UV/vis limb technique. For the present study we have chosen a twofold approach.
(1) The validation is performed by deploying a novel balloon-borne, and absolutely calibrated UV/vis scan-ning limb spectrometer (called mini-DOAS) on a cou-ple of stratospheric balloon flights on the azimuth con-trolled LPMA/DOAS payload (Laboratoire de Physique Mol´eculaire et Applications and Differential Optical Absorp-tion Spectroscopy). These measurements allow us (a) to absolutely monitor UV/vis skylight radiances as a function
of sensor and tangent height, viewing geometry and solar zenith angle (SZA) and (b) by applying the Differential Op-tical Absorption Spectroscopy (DOAS, Platt, 1994; Platt and Stutz, 2006) technique to infer vertical profiles for a number of UV/vis absorbing atmospheric trace gases (O3, NO2, O4,
BrO, H2O, and possibly in future of OClO, IO, OIO, . . .).
(2) Further, the measured mini-DOAS limb radiances are inter-compared to simulations of a novel Monte-Carlo (MC) radiative transfer model, the latter to be used in future stud-ies for forward modeling of the SCIAMACHY limb obser-vations. Secondly, the inferred trace gas profiles from the mini-DOAS instruments are validated against simultaneous profile measurements of the same atmospheric constituents measured by well established in-situ (e.g., ozone by an elec-trochemical cell) or optical remote sensing techniques (cf., solar occultation) performed on the LPMA/DOAS payload. For details of the latter measurements see e.g., Camy-Peyret et al., 1993; Payan et al., 1998; Ferlemann et al., 1998, 2000; Harder et al., 1998, 2000; B¨osch et al., 2003, and the accom-panying paper of Gurlit et al., 2004).
The present study is organized as follows: In Sect. 2, the newly developed instrument is described and characterized, and experimental details about the absolute calibration are given. Furthermore, descriptions of the data analysis meth-ods, i.e. DOAS evaluation, RT modeling, profile inversion, and error analysis, are provided. In the Sects. 3 and 4, se-lected atmospheric observations of the mini-DOAS instru-ment are described and discussed with respect to the mea-surements of the other instruments also deployed aboard the LPMA/DOAS payload. Section 5 concludes the study with the lessons learned for future investigations.
2 Methods
2.1 Technical set-up of the mini-DOAS instrument The novel mini-DOAS spectrometer has been designed for low weight (<7 kg) and low power consumption (7.5 W), with a particular emphasis being put on stable imaging and a reasonably large signal to noise ratio. While the small size and low weight offers the chance for versatile applications (c.f., a stand-alone operation for time resolved measurements of important stratospheric radicals, trace gas measurements and radiative transfer studies in the cloudy troposphere), a stable imaging is found to be necessary for the detection of O3, NO2 and in particular of the weakly absorbing gases
(BrO, OClO, IO, OIO . . .), based on the experience with our larger precursor balloon spectrometer.
The mini-DOAS instrument consists of 5 major parts: (a) 2 light intake telescopes for simultaneous nadir and scan-ning limb observations (the latter being mounted on an auto-mated elevation scanner), (b) glass fibre bundles which con-duct the skylight from the telescopes into the spectrometers, (c) two commercial Ocean Optics USB-2000 spectrometers
(d) which are mounted into an evacuated and temperature-stabilized housing, and finally (e) a single board computer for data handling and storage.
(a) The nadir and limb telescopes each consist of a spher-ical quartz lense (12.7 mm diameter, 30 mm focal length) which focuses the incoming scattered skylight onto the cir-cular or the rectangular entrance of the glass fiber bundles. During the balloon flight, the nadir telescope is mounted at the bottom of the outer frame of the LPMA/DOAS payload structure, which provides an unobscured view into nadir di-rection. The limb telescope is mounted on an elevation an-gle scanner (built by Hofmann Meßtechnik, Rauenberg, Ger-many) which supports limb observations in a range of +10◦ to −20◦ elevation angle, with step sizes as small as 0.04◦. During the balloon flight, the scanner is mounted on the right hand side (i.e., in a +90◦azimuth angle relative to the Sun’s
azimuth direction) of the azimuth controlled LPMA/DOAS gondola.
(b) Each glass fibre bundle consists of 10 individual quartz glass fibers each (diameter 100 µm, length 2 m, numerical aperture=0.22). Glass fibre bundles are used, since they not only allow for a more flexible arrangement of the instru-ment, but are also known for largely reducing the polarization sensitivity of grating spectrometers (Stutz and Platt, 1996, 1997). In fact, laboratory measurements show that by using glass fibre bundles the polarization sensitivity of an Ocean Optics USB 2000 spectrometer is small (≤1%). For the nadir observations, the individual glass fibres are arranged in circu-lar geometry at the light intake, a mounting which together with the telescope supports a round field of view (FOV) of 0.6◦. For the limb observations the glass fibres are arranged
in a “rectangular geometry” light intake set-up i.e., the in-dividual glass fibre entrances are linearly aligned. This ar-rangement supports a FOV of 0.19◦in the vertical and 1.34◦ in the horizontal direction. Likewise, the glass fibres are lin-early aligned at both exits, and the outgoing light is skimmed by a 50 µm wide and 1000 µm high spectrometer entrance slit.
(c) The heart of the mini-DOAS balloon instrument con-sists of two commercial Ocean Optics USB 2000 spectrom-eters for simultaneous nadir and limb observations. The USB 2000 is a miniature grating spectrometer working in cross Czerny-Turner geometry. Its advantage is the small size (86×63×30 mm3), the low weight (270 g) and the high photon detection sensitivity owing to an integrated linear CCD array detector (Sony ILX511). The light enters the spectrometer through an entrance slit from which it is fo-cused by a collimator mirror onto a holographic grating with 1800 grooves/mm. A second mirror focusses the light onto the linear CCD array with 2048 pixels (each pixel is 14 µm wide and 200 µm high). Attached onto the CCD array de-tector is a cylinder lense which focuses the 1000 µm high entrance slit onto the 200 µm high detector. Also attached to the CCD array detector is the preamplifier and a control logic unit which handles the pre-amplification of the signals, A/D
conversion to 12 bit data and communication.
The spectrometers cover a spectral range of 327−527 nm at a full width at half maximum resolution (FWHM) of 0.8−1 nm, or 8 to 10 detector pixel/FWHM depending on the wavelength. Based on previous experience, this wavelength coverage and resolution should allow for the detection of the atmospheric trace gases O3, NO2, O4, BrO, H2O, (and
po-tentially OClO, IO, OIO, CH2O).
(d) Both spectrometers are kept in a sealed and evacuated container, which itself is immersed in a water-ice reservoir (∼2 liters). This ensures a stable spectrometer and CCD ar-ray temperature of 0◦C during an entire balloon flight.
(e) Data handling and storage is maintained by a single board PC (type National Geode 200 MHz) which is equipped with a flash memory device. The allocated data are trans-ferred from the spectrometers to the PC via a USB data transfer connection. It supports a data transmission rate fast enough to record a single spectrum every 25 ms. Possible in-tegration times per spectrum as provided by the manufacturer of the spectrometers are in the range of 3−65 535 ms. The PC can alternatively be operated under Windows or Linux with our lab-owned DOASIS1 or XDOAS software pack-ages, respectively. Both software tools support the automatic adjustment of the integration time, recording and storage of the measured spectra and the control of the limb scanning stepper motor.
The total size of the instrument is 260×260×310 mm3 (w/o fibers), its weight is ∼4.8 kg plus 2 kg of water and ice, and its power consumption is ∼7.5 W.
2.2 Instrument performance and calibration
Instrument performance: The optical performance of the
mini-DOAS instrument is tested in a set of laboratory mea-surements using alternatively Penray Hg, Kr or HgCd emis-sion lamps or white light sources (integrating sphere type BN-102-3 manufactured by Gigahertz). For the temperature stabilized (0◦C) instrument, the following relevant noise con-tributions (1-σ rms) are found for single scans:
(a) an electron shot noise level of 15 binary units (BU) corresponding to a 1-σ noise of 0.474% for a 80% satu-ration level of the CCD array with a well-depth of 62 500 electrons and an electron to binary unit conversion factor of 15 electrons/BU. As for a DOAS evaluation the ratio of the spectrum being analyzed and a solar reference spectrum is considered, the noise has to be multiplied by a factor of
√ 2, yielding a photo-electron shot noise of 0.67%.
(b) a total electronic noise of 67.4 electrons or 4.4 BU causing a noise of 0.135% at 1-σ .
(c) the dark current of the SONY ILX511 shows a large pixel to pixel variation e.g., next to pixels with very small dark current there are pixels for which the current
1available for download under: http://www.iup.uni-heidelberg.
de/bugtracker/projects/doasis/
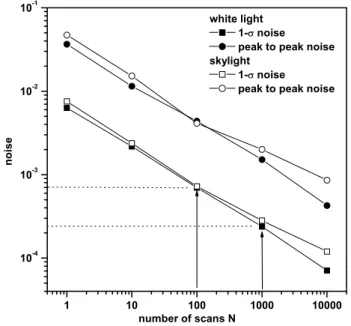
Fig. 1. Root mean square (1-σ ) and peak-to-peak residual structure
(5-σ ) as a function of co-added spectra N at 80% illumination level of the CCD array detector for white light of an integrating sphere and skylight. The arrows indicate the (1-σ ) noise actually achieved during the balloon flights.
is 270 electrons/s corresponding to 18 BU/s. The average dark current, however, is 16.6 electrons/s only, correspond-ing to 1.09 BU/s. The dark current noise is proportional to the square root of the integration time and measured to 0.42 BU/√s, much smaller than the other noise contribu-tions.
Since all noise contributions (a) to (c) are inversely pro-portional to the square root of the number of scans (N), the total noise is measured as a function of N (see Fig. 1). For this purpose the total noise and its scaling with the number of scans is monitored using scattered skylight and a small integrating sphere. In both cases, the 1-σ noise for single scans is ∼0.7%. For a medium large number of scans, the instrument, in fact, operates at the physical limits given by the photo-electron noise. For an actual balloon flight, typi-cally 100–1000 spectra (corresponding to 10−100 s integra-tion time) are co-added for the sake of height resoluintegra-tion. This results for field conditions in a total 1-σ noise of 7×10⁻⁴for 100, and 2.5×10⁻⁴for 1000 co-added spectra, respectively (as indicated by the arrows in Fig. 1).
The spectrograph stray light is analyzed by laboratory measurements (Weidner, 2005). It is estimated to 0.2−0.3% of full saturation resulting in a contribution of <1% at all occurring saturation levels. Spectral structures arising from spectrograph stray light can be eliminated by including an additive polynomial to be fitted to the measured intensity (in-tensity offset) during the fitting procedure.
Absolute calibration: The radiometric calibration of both
spectrometers is performed in two steps: In a first step, a small, but not absolutely calibrated, integrating sphere (type BN-102-3 by Gigahertz) is absolutely cross calibrated against an absolute radiance standard using the mini-DOAS instrument as transfer device. In a second step, this now ab-solutely calibrated integrating sphere is used for radiometric calibration of each of the spectrometers, shortly before the actual balloon flight is conducted.
For absolute radiance calibration, a National Institute of Standards and Technology (NIST) calibrated FEL 1000 W irradiance Quartz Tungsten Halogen (QTH) standard (serial number F-455 from OSRAM Sylvania; Walker et al., 1987) is employed in combination with a calibrated space grade Spectralon diffuser plate manufactured by Labsphere. The same setup is used for absolute radiometric calibration of SCIAMACHY during the SCIAMACHY calibration cam-paign in 1998 (Dobber, 1999). The bi-directional reflectance distribution function (BRDF) of the diffuser plate is cal-ibrated in 0−23◦ geometry by the Dutch company TNO TPD. For more details see TNO TPD report of calibration (van Leeuwen, 2003). NIST provides the calibration at a distance of 50 cm. The wavelength dependent radiomet-ric irradiance accuracy of the NIST-FEL lamp ranges be-tween 0.91%−1.09%, and the long term reproducibility is 0.87%−0.96% in the 300−654.6 nm wavelength range (for more details see the NIST report of calibration, 844/25 70 96-96-1, 1997). For the radiance transfer measurements, the NIST-FEL lamp and the Spectralon diffuser plate are posi-tioned into the optical axis of the limb transfer spectrometer. The field of view of the spectrometer light intake telescope is small and completely located inside the characterized lamp irradiance plane on the Spectralon diffuser plate. After the measurement is taken, a not yet absolutely calibrated inte-grating sphere (type BN-102-3) is cross calibrated with the calibrated transfer spectrometer. The uncertainty of the ra-diance of the NIST-FEL lamp and Spectralon setup in the 300−700 nm region is 2−3% as indicated by test measure-ments performed during the SCIAMACHY calibration cam-paign (Gerilowski, 2004). For the somewhat less ideal con-ditions in the field, the estimated accuracy of the absolute radiometric calibration of both channels is estimated to 35% at 380 nm, 10% at 440 nm and 4% at 510 nm, including all known sources of uncertainties and errors. The reproducibil-ity of the integrating sphere measurements is better than 1%. Further, the absolute calibration is checked by compar-ing the measured radiance at two wavelengths (360 nm vs. 490 nm), for a condition for which the radiative transfer is simple. For example, for the limb observations (90◦ az-imuth angle, +0.5◦elevation angle, SZA=88.54◦at 30 km) during the Kiruna 23 March 2003 flight, RT calculations show that most photons ((80±5)%) are single Rayleigh scat-tered. This number is in agreement with the study of Oikari-nen et al. (1999). Therefore, by knowing the relative so-lar irradiance F(360 nm)/F(490 nm)=0.588 (e.g. Gurlit et
al., 2004) for the two wavelengths and the relative prob-ability for Rayleigh scattering (490 nm/360 nm)4=3.432, the radiance ratio I(360 nm)/I(490 nm)=2.018 can be cal-culated. In fact, the model ‘Tracy’ calculates a ratio of I(360 nm)/I(490 nm)=2.06, and our observation yields I(360 nm)/I(490 nm)≈2.0.
2.3 DOAS evaluation
For the evaluation of O3, NO2, BrO, O4, and H2O slant
column densities (SCD), the Differential Optical Absorption Spectroscopy (DOAS) technique is applied to the measured spectra (Platt, 1994; Platt and Stutz, 2006). For the spectral retrieval, the WinDOAS software is used (C. Fayt and M. Van Roozendael, 2001). Each spectrum is corrected for electronic offset and dark current using an offset and dark current spec-trum, respectively, recorded either on the ground shortly be-fore launch or during balloon float after sunset. The spec-tral retrieval of O3is performed in the 490−520 nm
wave-length intervall. The following cross sections are used: ozone from Voigt et al. (2001) at T=203 K; NO2 from Harder et
al. (1997) at T=217 K and 230 K, while the latter is numeri-cally orthogonalized with respect to the former; water vapor from Rothman et al. (2003) at T=230 K and p=400 hPa; and O4at room temperature from Hermans et al. (private
com-munication, 20022). The spectral retrieval of NO2 is
per-formed in the 400−450 nm wavelength range. The follow-ing cross sections are used: O3from Burrows et al. (1999)
at T=202 K and T=221 K while the latter is numerically or-thogonalized with respect to the former; NO2 from Harder
et al. (1997) at T=217 K; water vapor from Rothman et al. (2003) at T=230 K and p=400 hPa ; and O4at room
tem-perature from Hermans et al. In this wavelength interval, the O3cross section from Voigt et al. (2001) recorded with
a Fourier Transform spectrometer is rather noisy because the ozone absorption is minimal. Thus, the cross section from Burrows et al. (1999) recorded with the GOME spectrometer at medium resolution but higher signal to noise ratio is pre-ferred. The spectral retrieval of BrO is done as recommended by Aliwell et al. (2002) in the 346−359 nm wavelength in-terval with the following cross sections: BrO from Wahner et al. (1988) at T=203 K shifted by +0.25 nm to match the wavelength calibration of the BrO reference from the IUP-Bremen3; ozone from Voigt et al. (2001) at T=203 K and 223 K while the latter is numerically orthogonalized with re-spect to the former; NO2from from Harder et al. (1997) at
T=217 K; and O4at room temperature from Hermans et al.
All high resolution cross sections are convolved with the ac-tual instrumental slit function, determined from recorded line spectra of Hg and Kr. A spectrum correcting for the Ring ef-fect (Grainger and Ring, 1962) is also included in the fitting
2for details see: http://www.oma.be/BIRA-IASB/Scientific/
Topics/Lower/LaboBase/acvd/O4Info.html
3for details see: http://www.iup.physik.uni-bremen.de/gruppen/
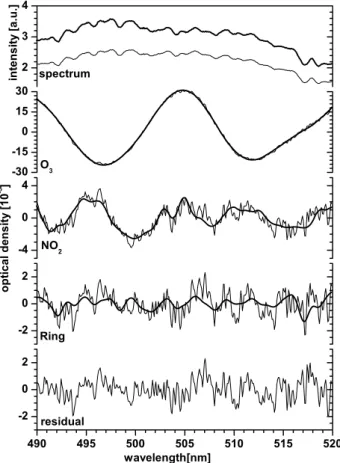
Fig. 2. Sample DOAS evaluation of ozone in the wavelength in-terval 490−520 nm for a limb observation at float altitude in limb scanning mode (at 31.6 km altitude, an elevation angle of −5.5◦, azimuth angle of 90◦, and SZA=89.9◦) for the Kiruna flight on 23 March 2003. Shown are the retrieved optical densities of O3,
NO2, Ring (thick lines) and the latter plus the residual structure (thin lines). The upper two traces show the measured (thick line) and the Fraunhofer (thin line) spectra, the latter is recorded at an altitude of 29.7 km, an elevation angle of 0.5◦, an azimuth angle of 90◦, and SZA=88.5◦.
routine: σRing=IRaman/(Iref−IRaman). For Iref, the same
solar reference spectrum as for the DOAS evaluation is used, and IRamanis calculated with the DOAS tool MFC (Gomer
et al., 1996). To correct for structures arising from spectro-graph stray light, an additive polynomial (intensity offset) of 2nd order is fitted to the measured spectra during the DOAS evaluation procedure. The obtained residuals are somewhat lower if an additive polynomial is included into the fit. Both the residuals and the fit results are almost identical and well within the given uncertainties for a degree of the additive polynomial between 0 and 2. For the Fraunhofer reference spectrum, a limb measurement from balloon float altitude is used, for which the residual trace gas absorptions are ex-pected to be minimal. For example, for the flight from Kiruna on 23 March 2003, the Fraunhofer reference is recorded at 29.7 km of altitude, SZA=88.5◦, elevation angle +0.5◦ and
Fig. 3. Same as Fig. 2 but for the NO2 evaluation in the
400−450 nm wavelength interval and a limb observation (at 30.9 km altitude, −3.5◦elevation angle (corresponding to a tangent height of ∼19.5 km), 90◦azimuth angle and SZA=89.4◦) for the Kiruna flight on 23 March 2003.
azimuth angle 90◦to the sun. Figures 2 and 3 show the spec-tral retrievals for the inferred differential slant column den-sities of ozone measured at 31.6 km for SZA=89.9◦, and
el-evation angle −5.5◦, and of NO
2measured at 30.9 km for
SZA=89.4◦, and −3.5o elevation angle, respectively.
Fig-ure 4 shows the inferred BrO absorption for an observation at 26.4 km altitude (−1.5◦elevation angle, 90◦azimuth angle and SZA=82.9◦) for the Kiruna flight on 24 March 2004.
One particular problem is that the DOAS method only re-trieves differential Slant Column Densities (dSCD), i.e. the trace gas absorption of the spectrum to be evaluated minus that of the solar reference spectrum. So the trace gas ab-sorption of the spectrum used as solar reference has to be determined separately and added to all measured dSCD val-ues. One possibility is to use the solar spectrum from Kurucz et al. (1984) convolved to the instrument’s resolution. How-ever, this leads to significantly larger residuals caused by im-properly removed Fraunhofer structures causing rather large systematic errors in the retrieved SCD values. Accordingly, this method only works for the strong absorber O3but cannot
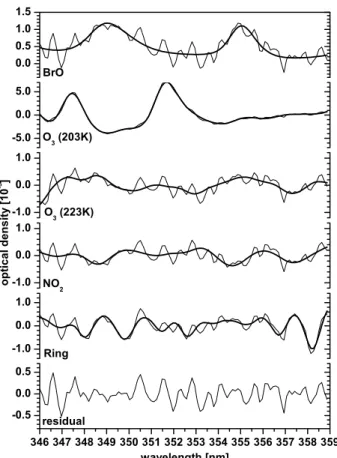
Fig. 4. Same as Fig. 2 but for the BrO evaluation in the 346−359 nm
wavelength interval and a limb observation (at 26.4 km altitude,
−1.5◦ elevation angle (corresponding to a tangent height of
∼25.5 km), 90◦ azimuth angle and SZA=82.9◦) for the Kiruna flight on 24 March 2004.
are much smaller than the residual structures in that case. A different approach is undertaken for BrO. As the BrO con-centration above balloon float altitude (∼32 km) is compar-atively small and also well known, a BrO concentration pro-file from the 3D-CTM Slimcat (Chipperfield, 1999) and the RT modeled BoxAMF are used to simulate the BrO absorp-tion contained in the solar reference spectrum. In the case of NO2, this method cannot be applied because the winterly
stratospheric NO2concentrations are not well reproduced by
CTMs and the solar reference is recorded in a region of very high NO2 concentrations implying large absorptions in the
reference spectrum itself so it has to be determined very pre-cisely. For the NO2measurements shown in this paper, the
NO2absorption of the solar reference spectrum is determined
by a correlation plot of the measured dSCDs and RT simu-lated SCDs using the profile obtained from the direct sunlight DOAS measurements as input.
2.4 Radiative transfer modeling
A Monte Carlo (MC) Radiative Transfer model (called “Tracy”) has been developed by our group (Von Friedeburg, 2003). It allows the forward simulation of the mini-DOAS and Envisat/SCIAMACHY limb observations. In particular, it can simulate the measured limb radiances and slant col-umn densities (SCD) of the trace gases under consideration, including sensitivity tests for varying atmospheric parame-ters such as T , p, the ozone and aerosol profiles.
“Tracy” solves the radiative transfer equation by backward Monte Carlo simulations in a fully spherical, 3-dimensional and refractive atmosphere. However, it does not consider the polarization of the scattered skylight, which was found nec-essary in a recent theoretical study on scattered light ozone measurements (Hasekamp et al., 2002). Further, it supports an arbitrary spatial discretization, a tool which permits to ac-count for spatially strong varying aerosol and trace gas con-centrations, and it takes into account multiple scattering with arbitrary scattering phase functions.
For the RT simulations, “Tracy” uses atmospheric tem-perature and pressure profiles and, if available, profiles of the atmospheric aerosol extinction and ozone concentration (H¨onninger et al., 2004). For the present simulations, the stratospheric aerosol data version 2.00 of the SAGE III in-strument is used (Thomason and Taha, 2003). The used aerosol phase functions are calculated for a standard scenario using Mie-theory (Hendrick, pers. communication). Mie scattering due to tropospheric clouds is not considered fur-ther. In the current version, “Tracy” runs with either the “Ku-rucz” (Kurucz et al., 1984) or the SOLSPEC solar spectrum (Thuillier et al., 1997, 1998a and b).
“Tracy” outputs are wavelength dependent limb radiances, slant column densities (SCD) of the trace gases of interest which the actual measurements can be compared to, and so called box air mass factors (BoxAMFs). The latter give the ratio of slant to vertical paths through each atmospheric layer, i.e. AMF =SCD/V CD, where AMF is the BoxAMF , SCDthe slant and V CD the vertical column density of the considered layer.
2.5 Profile retrieval
Profile inversion from measured SCDs is performed by the Maximum A Posteriori (MAP) solution technique described in Rodgers (2000), also used for the inversion of solar oc-cultation measurements performed by the other optical spec-trometers (DOAS and LPMA) deployed on the gondola. The two-step approach of forward modeling of the atmospheric RT, and optimal estimation for profile inversion of measured SCDs is chosen since it offers the chance to cross validate each step of the newly developed limb technique. Sensitiv-ity tests and validation can thus be undertaken on the sim-ulated and measured limb radiance level, by comparison of simulated and measured SCDs of the gases of interest, or
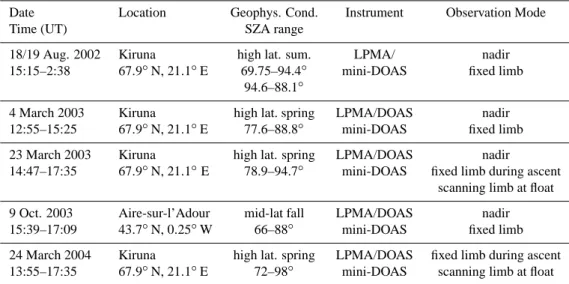
Table 1. Compendium of balloon-borne mini-DOAS measurements
Date Location Geophys. Cond. Instrument Observation Mode
Time (UT) SZA range
18/19 Aug. 2002 Kiruna high lat. sum. LPMA/ nadir
15:15–2:38 67.9◦N, 21.1◦E 69.75–94.4◦ mini-DOAS fixed limb 94.6–88.1◦
4 March 2003 Kiruna high lat. spring LPMA/DOAS nadir
12:55–15:25 67.9◦N, 21.1◦E 77.6–88.8◦ mini-DOAS fixed limb 23 March 2003 Kiruna high lat. spring LPMA/DOAS nadir
14:47–17:35 67.9◦N, 21.1◦E 78.9–94.7◦ mini-DOAS fixed limb during ascent scanning limb at float 9 Oct. 2003 Aire-sur-l’Adour mid-lat fall LPMA/DOAS nadir 15:39–17:09 43.7◦N, 0.25◦W 66–88◦ mini-DOAS fixed limb 24 March 2004 Kiruna high lat. spring LPMA/DOAS fixed limb during ascent 13:55–17:35 67.9◦N, 21.1◦E 72–98◦ mini-DOAS scanning limb at float
by inter-comparison of otherwise measured profiles c.f., ob-tained from the well validated solar occultation technique. At the same time, the approach allows us to validate various radiative transfer codes used in upcoming studies addressing SCIAMACHY limb observations.
Using the definition of the BoxAMF as stated above and the standard notation as used in Rodgers (2000), the profile retrieval problem can be written as:
y = K x + ε, (1)
where y is a vector of the measured SCDs, x a vector of the desired VCDs for each altitude layer, and K the weight-ing function matrix given by the RT calculated BoxAMF for each measurement and altitude layer. ε describes the in-evitable measurement errors. The best estimate solution ˆx of this problem based on the measurements y and available a priori information xais given by the linear MAP inversion
algorithm as described in Rodgers (2000), chapter 4: ˆ
x = (KTSε−1K + Sa−1)−1(KTSε−1y + Sa−1xa), (2)
where Saand Sε are the covariances of the a priori profile
and the measurements, respectively. The covariance of the retrieved profile is given by:
ˆ
S = (KTSε−1K + Sa−1)−1. (3) All covariance matrices are diagonal. The covariance of the measurements is given by the errors of the DOAS evaluation εcorresponding to each measurement, i.e. Sε,ii=ε2i. The
co-variance of the a priori profile is taken as constant percentage pof the profile itself, i.e. Sa,i=(p xa,i)2. The error of the
retrieved profile is obtained from its covariance matrix by σi=
q ˆ Sii.
The inversion is characterized by the averaging kernel ma-trix A given by:
A = (KTSε−1K + Sa−1)−1KTSε−1K. (4)
Averaging kernels being close to unity indicate a height reso-lution of (or better than) the grid spacing used for the profile retrieval and independence of the retrieved profile point from the a priori. For all the profiles shown in this study, only the altitudes levels with averaging kernels close to one are considered.
Constraining the inversion by an a priori profile is nec-essary as the measurements contain no profile information about the altitude levels above float altitude. In order not to lose profile information about the altitude levels below float, the covariance of the a priori is chosen as high as possible, usually to p=100%. As a result, the retrieved profiles are in-dependent from the a priori in the altitude range traversed by the balloon. This independence has been checked by varying the a priori over a large range and by analysis of the averag-ing kernels.
2.6 Error analysis
For the O3and NO2DOAS evaluation, the statistical retrieval
error determined by the residual noise is usually very small. In this case, the largest error of the retrieved SCDs arise from systematical effects like uncertainties of the used cross sec-tions and the solar reference offset to be added to the mea-sured dSCDs. These systematical error contributions are as-sumed to be 5% of the retrieved dSCD and solar reference offset, respectively. They are accounted for in the error anal-ysis by retrieving an additional profile with a set of SCDs with the respective error added. The difference of the two profiles yields the error of the retrieved profile arising from the respective effect and is added to the error given by Eq. (3).
Fig. 5. Comparison of measured and simulated limb radiance at 360 nm (open squares and dashed line) and 490 nm (filled squares and full line, respectively) for an azimuth angle of 90◦and an eleva-tion angle of +0.5◦during balloon ascent over Kiruna on 23 March 2003. Also denoted is the Solar Zenith Angle (SZA) at the balloon position.
3 Observations and flights
For the actual balloon flights (see Table 1) the instrument is mounted on the azimuth controlled LPMA/DOAS pay-load. One of the telescopes is directed into the nadir, whereas the other telescope is mounted into the limb scanner, which points perpendicular to the Sun’s azimuth direction (when the gondola is perfectly azimuth controlled). The elevation of the limb telescope is kept fixed during balloon ascent at an angle around 0◦. At balloon float, the instrument per-forms scanning limb measurements at elevation angles be-tween −6◦and 0◦.
To date 5 mini-DOAS flights have been performed; and overall the instrument performed well during all of them. Since the instrument and method are novel and need some testing, the instrument has been constantly refined, e.g., by operating a limb scanner from the second flight on, by subse-quently improving the instrument’s housing and cooling and its software, and finally by adding a vacuum sealed hous-ing surroundhous-ing the spectrometers. Therefore, the quality of the limb and nadir spectra are not directly comparable from one balloon flight to another. Nevertheless, the functionality, and the feasibility of the method, as well as its potential for novel atmospheric observations are well demonstrated by the results discussed in the following section.
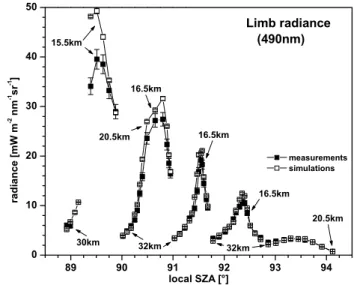
Fig. 6. Comparison of measured (filled squares) and RT mod-eled (open squares) limb radiances at 490 nm vs. local SZA at the balloon position for the Kiruna 23 March 2003, balloon flight at bal-loon float altitude (30.3−32.2 km) for an azimuth angle of 90◦and elevation angle varying from +0.5◦to −5.5◦with +0.5◦steps. The figure shows 5 limb profiling scans consisting of up to 13 individual observations each. The height labels denote the tangent heights of the observations.
4 Results and discussion
In the following, we provide some sample results obtained from the data collected during 2 of the 5 balloon flights:
(a) In a first exercise, the measured absolute skylight radi-ances (azimuth angle 90◦, fixed elevation of +0.5◦) are
com-pared with RT calculated skylight radiances for two wave-lengths (λ=360 nm and λ=490 nm) for the balloon ascent and the scanning limb observations at balloon float altitude (30.3−32.2 km) at Kiruna on 23 March 2003 (see Figs. 5 and 6, respectively). For the RT modeling the actually measured atmospheric parameters (profiles of T and p, and of ozone) are used. The ground albedo is set to 0.6 (which accounts for the still existing snow cover over Northern Scandinavia by late March). No further assumptions are made for the tropo-spheric aerosols and cloud scattering and absorption, mainly because they are not known for the actual sounding and are known to be quite variable. Figure 5 demonstrates that with the given assumptions the measured stratospheric limb radi-ances at 360 nm and 490 nm are reproduced reasonably well by the RT model (within the given error bars). At λ=360 nm, however, the measured limb radiances are exceedingly larger than the simulation below 17 km. Also not unexpected, in the tropopause region the measured limb radiances are much more variable at 490 nm than at 360 nm. This effect is due to the predominance of Mie scattering by aerosols and clouds over Rayleigh scattering for the skylight radiances in the vis-ible (at 490 nm) compared to UV light (at 360 nm).
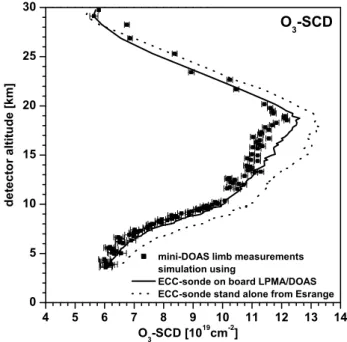
Fig. 7. Comparison of limb (90◦azimuth angle and 0.5◦elevation angle) measured (filled squares) and forward modeled O3-SCDs
us-ing the ozone measurements from two ECC-sondes deployed on the same gondola (full line), and flown stand-alone ∼3 h after the LPMA/DOAS launch (dotted line) for the Kiruna 23 March 2003 flight.
Figure 6 shows the measured and RT modeled limb radi-ance at λ=490 nm for the limb scanning observations at bal-loon float altitude (30.3−32.2 km). During each limb scan, the elevation angle is varied from +0.5◦to −5.5◦in steps of 0.5◦corresponding to about 10 min. Overall, a good agree-ment in the measured and modeled skylight radiance is found for limb scans number 2 to 5 (when counting from left to right), and only for the 1st run, the disagreement is larger at lower altitudes than expected. We believe that the gap around SZA=90◦ is due to the notorious difficulties of RT models to deal numerically correct in this regime. Sensitivity tests showed that stratospheric aerosols and tropospheric clouds only have a small impact on the RT calculated radiances and cannot explain the discrepancies.
(b) After gaining some confidence in the RT modeling, we further evaluate the measured spectra during balloon ascent and at balloon float to obtain profile information of some rel-evant atmospheric absorbers in the UV/vis wavelength range i.e., of O3, NO2, and BrO.
In a first exercise, we tested the O3profile retrieval from
the mini-DOAS observations for a fixed limb viewing geom-etry (at an azimuth angle of 90◦ and an elevation angle of 0.5◦) performed during the balloon ascent of the Kiruna 23 March 2003 flight. Note that the balloon flight is undertaken around the vortex edge, implying large horizontal gradients in the trace gas concentrations.
Fig. 8. Averaging kernels for the ozone profile retrieval shown in
Fig. 9.
In a first step, the slant column densities of ozone (O3
-SCD) are inferred from the measured spectra, and com-pared with the same parameter simulated by Tracy RT cal-culations using as input either the O3profile simultaneously
measured on-board by an electrochemical cell (ECC), or by a stand-alone ECC O3 sonde, launched ∼3 h after the
LPMA/DOAS gondola. Figure 7 reveals that the measured and simulated O3-SCDs compare reasonably well, however
only for the simulations using the ozone profile measured by the ECC-sonde aboard (the full line in Fig. 7). Con-versely taking the O3profile in the simulation from the
mea-sured stand-alone launched ECC sonde launched ∼3 h after the LPMA/DOAS payload, larger O3concentrations are
ob-tained in the 12−21 km height range with a corresponding overestimation in the simulated O3-SCDs (dotted curve in
Fig. 7). This comparison clearly demonstrates the quality of the limb O3measurements and its sensitivity towards the
shape and O3concentration of the profile.
In a second step, the measured O3-SCDs are
mathemati-cally inverted into an O3concentration profile, using the RT
calculated BoxAMF and the inversion routine described in Sect. 2.5 (see Fig. 9). Overall, a good agreement found be-tween the inferred limb ozone profile and the simultaneously measured O3 profiles either from the on-board ECC sonde
or inferred from the direct sunlight DOAS observations indi-cates the feasibility of the balloon-borne limb method. The error bars are calculated as described in Sect. 2.6. The rela-tive total error of the inferred O3concentrations is 5−10% in
the 10−25 km range increasing to 15% above as concentra-tions are lower. Below 10 km, the relative error is strongly increasing due to very low tropospheric concentrations and,
Fig. 9. Comparison of inferred O3profiles from (a) limb
observa-tions (filled squares) at an azimuth angle of 90◦and elevation angle of 0.5◦, (b) the direct sunlight DOAS measurements (open circles), and two ECC ozone sondes (c) one deployed on the same gondola (full line) and (d) from the stand-alone launched ECC-sonde (dotted line) for the Kiruna, 23 March 2003 flight.
thus, stronger contribution of the stratospheric O3to the
mea-sured SCDs. The rows of the corresponding averaging kernel matrix A are shown in Fig. 8. The averaging kernels are close to 1 in the altitude range where measurements are available, i.e. between 3 and 30 km, on the chosen altitude grid of 1 km below 20 km and 2 km above owing to the lower number of measurements due to lower limb radiances there.
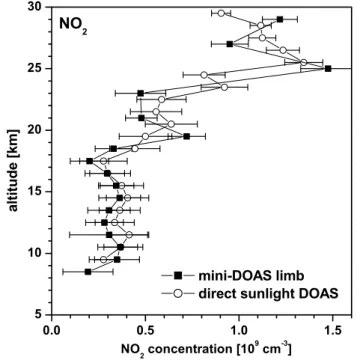
In a second exercise, we inferred an NO2profile from the
measured SCDs during balloon ascent on 23 March 2003 (see Fig. 10). As before the comparison of the NO2profiles
inferred either from the limb or direct Sun observations is ex-cellent. This result again demonstrates the equally large sen-sitivity of the balloon-borne ascent limb measurement com-pared to the solar occultation techniques. The higher errors of the mini-DOAS limb measured NO2-SCDs compared to
the SCDs of the direct sunlight DOAS measurements due to a lower number of analyzed photons are compensated by the better conditioning of the inversion problem (i.e. Box-AMFs with sharp maximum at the detector altitude) so that both profiles have similar uncertainties. For the shown er-ror bars, 5% uncertainty of the solar reference offset is as-sumed. No systematical error of the cross section is assumed for this comparison as the same cross sections are used for the DOAS evaluation of the mini-DOAS limb and solar oc-cultation spectra. The total relative errors of the mini-DOAS profile is 5−10% above 25 km where NO2concentrations are
maximum and 20−30% below.
Fig. 10. Comparison of inferred NO2profiles from (a) limb ob-servations (filled squares) for an azimuth angle of 90◦and elevation angle of 0.5◦, and (b) from direct sunlight DOAS measurements (open circles) during balloon ascent at Kiruna on 23 March 2003. The SZA was between 80◦at 10 km, and 88.9◦at 30 km detector altitude.
In a third exercise, we inferred a BrO profile from the limb measured SCDs during balloon ascent on 24 March 2004 (see Fig. 11). As for the NO2 comparison, the limb
mea-sured BrO compares excellently with the BrO meamea-sured with the solar occultation instrument, thus providing confidence in both methods. The total relative error calculated as de-scribed in Sect. 2.6 is ∼12% in the 12−25 km range and sig-nificantly higher above and below as BrO concentrations are much lower.
Finally, in a fourth exercise, we intercompare measured and simulated O3-SCDs for the scanning limb observations
at balloon float (30.3−32.2 km) for the Kiruna 23 March 2003 flight (see Fig. 12). As before, the measured and simulated O3-SCDs compare well, in particular for tangent
heights above the ozone maximum concentration (>25 km). For lower altitudes, simulated O3-SCD are larger by ∼10%
than those measured, a finding for which the reason is not totally clear. However, it is worthy noting that the simulated O3-SCDs are less sensitive to RT errors than the simulated
limb radiances. Therefore the small error found in the sim-ulated radiance (compare Fig. 3) can hardly provide an ex-planation for the discrepancies. For a given ozone profile, a larger simulated than measured limb O3-SCD could mean a
longer simulated than real viewing distance (or a better vis-ibility) over which the limb radiance received by the instru-ment is integrated. Conversely, if the RT model simulations
Fig. 11. Comparison of inferred BrO profiles from (a) limb ob-servations (filled squares) for an azimuth angle of 90◦and elevation angle of −1.5◦, and (b) from direct sunlight DOAS measurements (open circles) during balloon ascent at Kiruna on 24 March 2004. The SZA was between 76.5◦at 9 km, and 85.4◦at 33 km detector altitude.
fit well with the actual atmospheric RT, smaller measured than simulated O3-SCDs would imply smaller ozone
con-centrations than assumed in the simulation (here as before, the on-board measured ECC-sonde ozone profile is taken). In fact, there is a good reason to assume that the latter expla-nation is more likely than the former since the limb scanning measurement touched the vortex edge. The ozone-poor po-lar air-masses were increasingly occupying the instrument’s field of view as the gondola followed (in clockwise direction) the increasing solar azimuth angle with progressing balloon flight duration.
5 Conclusions
We describe the first application of a novel balloon-borne UV/vis spectrometer and its limb radiance and trace gas measurements. The study discusses the instrument’s perfor-mance in a series of balloon flights, and the novel method of balloon-borne UV/vis limb trace gas measurements is tested against simultaneous observations of the same atmospheric parameters and RT model results.
Overall, reasonably good agreement is found in inter-comparisons of simulated and measured limb radiance per-formed in fixed observing geometry during balloon ascent, and in limb scanning geometry at balloon float altitude
dur-Fig. 12. Comparison of measured (filled squares) and forward modeled (open squares) limb absorption of ozone vs. local SZA at the balloon position for the Kiruna flight on 23 March 2003 for azimuth angle of 90oto the sun and elevation angles varying from
+0.5◦to −5.5◦with 0.5◦steps. The height labels denote the tan-gent heights of the observation.
ing sunset. Due to potential problems arising from the Earth sphericity and atmospheric refraction, the latter provides a stringent test for forward RT modeling. Further, accurate and cross validated RT modeling and measurements, how-ever, permit to calculate more reliably photolysis frequen-cies of UV/vis absorbing atmospheric trace gases, known to be particularly difficult to calculate at large solar zenith an-gles (e.g., B¨osch et al., 2001; Uhl and Reddmann, 2004). The inter-comparison demonstrates that the UV/vis optical prop-erties of the stratosphere for volcanically quiescent and polar stratospheric cloud free periods are reasonably well under-stood.
The novel limb technique is also cross validated by simul-taneous measurements of the same atmospheric trace gases (here O3, NO2, BrO) and, overall, a good agreement is found.
It is shown that the UV/vis limb measurements are partic-ularly sensitive in the upper troposphere/lowermost strato-sphere (UT/LS) for moderately large SZA during balloon ascent. In the future, this particularly large sensitivity may allow more accurate studies on the UT/LS NO2 or halogen
oxide photochemistry than presently available from remote sensing instrumentation. Moreover, scanning UV/Vis limb profiling may provide a rather powerful tool to investigate the time dependent photochemistry of stratospheric radicals, for example of the ClO+BrO ozone loss cycle by simultane-ous observations of the OClO and BrO profiles in the win-tertime polar stratosphere (WMO, 2002; Canty et al., 2005; Salawitch et al., 2005).
Finally, our study demonstrates the overall feasibility of the various steps (spectral retrieval, forward RT modeling,
profile inversion, . . .) in the emerging technique of satellite-borne remote sensing of atmospheric constituents by spec-troscopic UV/vis limb observations.
Acknowledgements. Support of the project by BMBF through
grants 50FE0017 and 50FE0019. We are grateful to the support given by the team of CNES in particular ‘l’´equipe nacelles point´ees’ and the balloon launching team from Aire-sur-l’Adour/France for the assistance given to perform successfully the balloon flights. We thank in particular C. Randall (University of Colorado, Boulder, USA) for providing the SAGE III aerosol data. Thanks to M. Long for proofreading the manuscript with regard to the English. Edited by: M. Dameris
References
Aliwell, S. R., Van Roozendael, M., Johnston, P. V., Richter, A., Wagner, T., Arlander, D. W., Burrows, J. P., Fish, D. J., Jones, R. L., Tørnkvist, K. K., Lambert, J.-C., Pfeilsticker, K., and Pundt, I.: Analysis for BrO in zenith-sky spectra: An intercomparison exercise for analysis improvement, J. Geophys. Res., 107, D14, 4199, doi:10.1029/2001JD000329, 2002.
B¨osch, H., Camy-Peyret, C., Chipperfield, M., Fitzenberger, R., Harder, H., Schiller, C., Schneider, M., Trautmann, T., and Pfeil-sticker, K.: Inter comparison of measured and modeled strato-spheric UV/vis actinic fluxes at large solar zenith angles, Geo-phys. Res. Lett., 28, 1179–1182, 2001.
B¨osch, H., Camy-Peyret, C., Chipperfield, M. P., Fitzenberger, R., Harder, H., Platt, U., and Pfeilsticker, K.: Upper limits of strato-spheric IO and OIO inferred from center-to-limb-darkening-corrected balloon-borne solar occultation visible spectra: Impli-cations for total gaseous iodine and stratospheric ozone, J. Geo-phys. Res., 108, D15, 4455, doi:10.1029/2002JD003078, 2003. Bovensmann, H., Burrows, J. P., Buchwitz, M., Frerick, J., No¨oel,
S., Rozanov, V. V., Chance, K. V., and Goede, A. H. P.: SCIA-MACHY: Mission Objectives and Measurement Modes, J. At-mos. Sci., 56, 127–150, 1999.
Burrows, J. P., H¨olzle, E., Goede, A. P. H., Visser, H., and Fricke, W.: SCIAMACHY – Scanning Imaging Absorption Spectrom-eter for Atmospheric Chartography, Acta Astronautica, 35, 7, 445–451, 1995.
Burrows, J. P., Richter, A., Dehn, A., Deters, B., Himmelmann, S., Voigt, S., and Orphal, J.: Atmospheric remote-sensing reference data from GOME – 2. Temperature-dependent absorption cross sections of O3in the 231–794 nm range, J. Q. S. R. T., 61, 4,
509–517, 1999.
Camy-Peyret, C., Flaud, J. M., Perrin, A., Rinsland, C. P., Goldman, A., and Murcray, F.: Stratospheric N2O5, CH4and N2O profiles from IR solar occultation spectra, J. Atmos. Chem., 16, 31–40, 1993.
Canty, T., Rivi`ere, E. D., Salawitch, R. J., Berthet, G., Renard, J.-B., Pfeilsticker, K., Dorf, M., Butz, A., B¨osch, Stimpfle, R. M., Wilmouth, D. M., Richard, E. C., Fahey, D. W., Popp, P. J., Schoeberl, M. R., Lait, L. R., and Bui, T. P.: Nighttime OClO in the winter Arctic vortex, J. Geophys. Res., 110, D01301, doi:10.1029/2004JD005035, 2005.
Chipperfield, M. P.: Multiannual simulations with a three-dimensional chemical transport model, J. Geophys. Res., 104, 1781–1805, 1999.
Dufour, G., Payan, S., Lef`evre, F., Eremenko,M., Butz, A., Jeseck, P., T´e, Y., Pfeilsticker, K., and Camy-Peyret, C.: 4-D comparison method to study the NOy partitioning in summer polar strato-sphere – Influence of aerosol burden, Atmos. Chem. Phys., 5, 919–926, 2005,
SRef-ID: 1680-7324/acp/2005-5-919.
Eichmann, K.-U., Kaiser, J. W., von Savigny, C., Rozanov, A., Rozanov, V., Bovensmann, H., K¨onig, M., and Burrows, J. P.: SCIAMACHY limb measurements in the UV/vis spectral region: first results, Adv. Space Res., 34, 775–779, 2003.
Fayt, C. and van Rozendael, M.: WinDOAS 2.1 Software User Manual, technichal report, Belgian Institute for Space Aeronomy (BIRA-IASB), http://www.oma.be/BIRA-IASB/ Molecules/BrO/WinDOAS-SUM-210b.pdf, 2001.
Ferlemann, F., Camy-Peyret, C., Fitzenberger, R., Harder, H., Hawat, T., Osterkamp, H., Perner, D., Platt, U., Schneider, M., Vradelis, P., and Pfeilsticker, K.: Stratospheric BrO Profiles Measured at Different Latitudes and Seasons: Instrument De-scription, Spectral and Profile Retrieval, Geophys. Res. Lett., 25, 3847–3850, 1998.
Ferlemann, F., Bauer, N., Fitzenberger, R., Harder, H., Osterkamp, H., Perner, D., Platt, U., Schneider, M., Vradelis, P., and Pfeil-sticker, K.: A new DOAS-instrument for stratospheric balloon-borne trace gas studies, J. Appl. Opt., 39, 2377–2386, 2000. Gerilowski, K.: Estimation of the Absolute Value of the ESM
Dif-fuser BRDF from NASA Sphere Measurements from Optec-5, IFE-SCIA-KG-20040128 ESM BRDF Correction, draft 1.3, 15 May 2004.
Gomer, T., Brauers, T., Heintz, F., Stutz, J., and Platt, U.: MFC User Manual, Vers. 1.98m, Technical Report, Institut f¨ur Umwelt-physik, Universit¨at Heidelberg, 1996.
Grainger, J. F. and Ring, J.: Anomalous Fraunhofer line profiles, Nature, 193, 762, 1962.
Gurlit, W., B¨osch, H., Bovensmann, H., Burrows, J. P., Butz, A., Camy-Peyret, C., Dorf, M., Gerilowski, K., Lindner, A., No¨el, S., Platt, U., Weidner, F., and Pfeilsticker, K.: The UV-A and visible solar irradiance spectrum: inter-comparison of absolutely calibrated, spectrally medium resolution solar irradiance spectra from balloon- and satellite-borne measurements, Atmos. Chem. Phys. Discuss., 4, 8439-8469, 2004.
Harder, J. W., Brault, J. W., Johnston, P., and Mount, G. H.: Temper-ature dependent NO2cross sections at high spectral resolution,
J. Geophys. Res., 102, 3861–3879, 1997.
Harder, H., Camy-Peyret, C., Ferlemann, F., Fitzenberger, R., Hawat, T., Osterkamp, H., Perner, D., Platt, U., Schneider, M., Vradelis, P., and Pfeilsticker, K.: Stratospheric BrO Profiles Measured at Different Latitudes and Seasons: Atmospheric Ob-servations, Geophys. Res. Lett., 25, 3843–3846, 1998.
Harder, H., B¨osch, H., Camy-Peyret, C., Chipperfield, M., Fitzen-berger, R., Payan, S., Perner, D., Platt, U., Sinnhuber, B., and Pfeilsticker, K.: Comparison of measured and modeled strato-spheric BrO: Implications for the total amount of stratostrato-spheric bromine, Geophys. Res. Lett., 27, 3695–3698, 2000.
Hasekamp, O. P., Landgraf, J., and van Oss, R.: The need of polarization modeling for ozone profile retrieval from backscattered sunlight, J. Geophys. Res., 107, 4692,
doi:10.1029/2002JD002387, 2002.
H¨onninger, G., von Friedeburg, C., and Platt, U.: Multi Axis Differ-ential Optical Absorption Sepctroscopy (MAX-DOAS), Atmos. Chem. Phys., 4, 231–254, 2004,
SRef-ID: 1680-7324/acp/2004-4-231.
Kurucz, R. L., Furenhild, I., Brault, J., and Testermann, L.: Solar Flux Atlas From 296 to 1300 nm, National Solar Observatory Atlas, No. 1, June 1984.
Mount, G. H., Rusch, D. W., Zawodny, J. M., Noxon, J. F., Barth, C. A., Rottman, G. J., Thomas, R. J., Thomas, G. E., Sanders, R. W., and Lawrence, G. M.: Measurements of NO2in the Earth’s
Stratosphere using a limb scanning visible light spectrometer, Geophys. Res. Lett., 10, 265–268, 1983.
McElroy, C. T.: Stratospheric nitrogen dioxide concentrations as determined from limb brightness measurements made on June 17th, 1983, J. Geophys. Res., 93, 7075–7083, 1988.
McPeters, R. D, Janz, S. J., Hilsenrath, E., Brown, T. L., Flittner, D. E., and Heath, D. F.: The retrieval of O3profiles from limb
scat-ter measurements: Results from the Shuttle Ozone Limb Sound-ing Experiment, Geophys. Res. Lett., 27, 2597–2600, 2000. Oikarinen, L., Sihvola, E., and Kyr¨ol¨a, E.: Multiple scattering
radi-ance in limb-viewing geometry, J. Geophys. Res., 104, 31 261– 31 274, 1999.
Payan, S., Camy-Peyret, C., Lef`evre, F., Jeseck, P., Hawat, T., and Durry, G.: First direct simultaneous HCl and ClONO2
pro-file measurements in the Arctic vortex, Geophys. Res. Lett., 25, 2663–2666, 1998.
Platt, U.: Differential Optical Absorption Spectroscopy (DOAS), Air Monit. by Spectr. Techniques, edited by: Sigrist, M. W., Chemical Analysis Series, 127, 27–84, John Wiley & Sons, Inc., 1994.
Platt, U. and Stutz, J.: Differential Optical Absorption Spectroscopy (DOAS), Principle and Applications, Springer Verlag Heidel-berg, ISBN 3-340-21193-4, 2006.
Rodgers, C. D.: Inverse Methods For Atmospheric Sounding, World Scientific, Singapore, New Jersey, London, Hongkong, 2000. Rothman, L. S., Barbe, A., Benner, D. C., Brown, L. R.,
Camy-Peyret, C., Carleer, M. R., Chance, K., Clerbaux, C., Dana, V., Devi, V. M., Fayt, A., Flaud, J.-M., Gamache, R. R., Goldman, A., Jacquemart, D., Jucks, K. W., Lafferty, W. J., Mandin, J.-Y., Massie, S. T., Nemtchinov, V., Newnham, D. A., Perrin, A., Rins-land, C. P., Schroeder, J., Smith, K. M., Smith, M. A. H., Tang, K., Toth, R. A., Vander Auwera, J., Varanasi, P., and Yoshino, K.: The HITRAN molecular spectroscopic database: edition of 2000 including updates through 2001, J. Q. S. R. T., 82, 1–4, 2003. Salawitch, R. J., Weisenstein, D. K., Kovalenko, L. J., Sioris, C.
E., Wennberg, P. O., Chance K., Ko, M. K. W., and Mclinden, C. A.: Sensitivity of ozone to bromine in the lower stratosphere, Geophys. Res. Lett., 32, L05811, doi:10.1029/2004GL021504, 2005.
Sioris, C. E., Haley, C. S., McLinden, C. A., von Savigny, C., Mc-Dade, I. C., McConnell, J. C., Evans, W. F. J., Lloyd, N. D., Llewellyn, E. J., Chance, K. V., Kurosu, T. P., Murtagh, D., Frisk, U., Pfeilsticker, K., B¨osch, H., Weidner, F., Strong, K., Stegman, J., and M´egie, G.: Stratospheric profiles of nitrogen dioxide ob-served by OSIRIS on the Odin satellite, J. Geophys. Res., 108, 4215, doi:10.1029/2002JD002672, 2003.
Stutz, J. and Platt, U.: Numerical analysis and estimation of the sta-tistical error of differential optical absorption spectroscopy
mea-surements with least-square methods, Appl. Opt., 35, 30, 6041– 6053, 1996.
Stutz, J. and Platt, U.: Improving long-path differential optical ab-sorption spectroscopy (DOAS) with a quartz-fiber mode-mixer, Appl. Opt., 36, (6), 1105–1115, 1997.
Thomason, L. W. and Taha, G.: SAGE III aerosol extinction mea-surements: Initial Results, Geophys. Res. Lett., 30 (12), 1631, doi:10.1029/2003GL017317, 2003.
Thuillier, G., Hers´e, M., Simon, P. C., Labs, D., Mandel, H., and Gillotay, D.: Observation of the UV solar irradiance between 200 and 350 nm during the ATLAS-1 mission by the SOLSPEC spectrometer, Sol. Phys., 171, 283–302, 1997.
Thuillier, G., Hers´e, M., Simon, P. C., Labs, D., Mandel, H., Gillotay, D., and Foujols, T.: The visible solar spectral irradiance from 350 to 850 nm as measured by the SOLSPEC spectrometer during the ATLAS-1 mission, Sol. Phys., 177, 41–61, 1998a. Thuillier, G., Hers´e, M., Simon, P. C., Labs, D., Mandel, H., and
Gillotay, D.: Solar radiometry and solar spectral irradiance: Ob-servation of the solar spectral irradiance from 200 nm to 870 nm during the ATLAS 1 and ATLAS 2 missions by the SOLSPEC spectrometer, Metrologia, 35, 689–697, 1998b.
Uhl, R. and Reddmann, T.: Divergence of sun-rays by atmospheric refraction at large solar zenith angles, Atmos. Chem. Phys., 4, 1399–1405, 2004,
SRef-ID: 1680-7324/acp/2004-4-1399.
Van Leeuwen, S.: Spectralon Diffuser BRDF Measurement, ESA Technical Note, TPD-SCIA-PhE-TN-009, Issue 1, Sept. 3, 2003, and Absolute Radiometric Calibration of the SCIAMACHY PFM, TNSCIA1000TP/190, Issue 1, Feb. 15, 1999.
Voigt, S., Orphal, J., Bogumil, K., and Burrows, J. P.: The Temper-ature dependence (203–293 K) of the absorption cross sections of O3in the 230–850 nm region measured by Fourier-transform
spectroscopy, J. Photochem. Photobiol. A, 143, 1–9, 2001. Von Friedeburg, C.: Derivation of Trace Gas Information
com-bining Differential Optical Absorption Spectroscopy with Ra-diative Transfer Modelling, PhD Thesis, IUP Heidelberg, http: //www.ub.uni-heidelberg.de/archiv/3758, 2003.
Von Savigny, C., Rozanov, A., Bovensmann, H., Eichmann, K.-U., Kaiser, J. W., No¨el, S., Rozanov, V. V., Sinnhuber, B.-M., Weber, M., and Burrows, J. P.: Stratospheric Ozone Profiles retrieved from Limb Scattered Sunlight Radiance Spectra Measured by the OSIRIS Instrument on the Odin Satellite, Geophys. Res. Lett., 30, doi:10.1029/2002GL016401, 2003.
Von Savigny, C., Rozanov, A., Bovensmann, H., Eichmann, K.-U., No¨el, S., Rozanov, V., Sinnhuber, B.-M., Weber, M., Burrows, J. P., and Kaiser, J. W.: The Ozone Hole Breakup in September 2002 as Seen by SCIAMACHY on ENVISAT, J. Atmos. Sci., 62, 721–734, 2005.
Von Savigny, C., Kokhanovsky, A., Bovensmann, H., Eichmann, K.-U., Kaiser, J., No¨el, S., Rozanov, A. V., Skupin, J., and Bur-rows, J. P.: NLC detection and particle size determination: first results from SCIAMACHY on ENVISAT, Adv. Space Res., 34, 851–856, 2004.
Wahner, A., Ravishankara, A. R., Sander, S. P., and Friedl, R. R.: Absorption cross section of BrO between 312 and 385 nm at 298 and 223 K, Chem. Phys. Lett., 152, 507–512, 1988.
Walker, K. D., Saunders, R. D., Jackson, J. K., and Mc Sparron, D. A.: Spectral Irradiance Calibration, NBS Special Publication, 250–20, 1987.
Weidner, F.: Development and Application of a Versatile Balloon-Borne DOAS Spectrometer for Skylight Radiance and Atmospheric Trace Gas Profile Measurements, PhD Thesis, IUP Heidelberg, http://www.iup.uni-heidelberg.de/institut/ forschung/groups/atmosphere/stratosphere/publications/pdf/, 2005.
World Meteorological Organization (WMO): Scientific Assessment of ozone depletion 2002: WMO Global Ozone Research and Monitoring Project, No. 47, chap. 7, Geneva, Switzerland, 2003.