HAL Id: tel-01290203
https://tel.archives-ouvertes.fr/tel-01290203
Submitted on 21 Mar 2016HAL is a multi-disciplinary open access archive for the deposit and dissemination of sci-entific research documents, whether they are pub-lished or not. The documents may come from teaching and research institutions in France or abroad, or from public or private research centers.
L’archive ouverte pluridisciplinaire HAL, est destinée au dépôt et à la diffusion de documents scientifiques de niveau recherche, publiés ou non, émanant des établissements d’enseignement et de recherche français ou étrangers, des laboratoires publics ou privés.
for abdominal surgical planning
Wenwu Zhu
To cite this version:
Wenwu Zhu. Segmentation and registration of CT multi-phase images for abdominal surgical planning. Medical Imaging. Université de Strasbourg, 2015. English. �NNT : 2015STRAD011�. �tel-01290203�
ÉCOLE DOCTORALE ED269- Mathématiques, Sciences
de l’information et l’ingénieur
ICUBE
THÈSE
présentée par:Wenwu ZHU
soutenue le : 13 AVRIL 2015pour obtenir le grade de :
Docteur de l’université de Strasbourg
Discipline/ Spécialité: Traitement du signal et
des images
Segmentation et recalage d'images TDM
multi-phases de l'abdomen pour la
planification chirurgicale
THÈSE dirigée par :
Mr. REMOND Yves Professeur, Université de Strasbourg
Mr. SOLER Luc Professeur, IRCAD - Université de Strasbourg
RAPPORTEURS :
Mr. MALANDAIN Grégoire Directeur de Recherche, I3S-INRIA
Mr. PASSAT Nicolas Professeur, Université de Reims Champagne-Ardenne
AUTRES MEMBRES DU JURY :
Mr. HEINRICH Christian Professeur, Université de Strasbourg Mr. NICOLAU Stéphane Directeur de Recherche, IRCAD
I
Acknowledgement
This doctoral research program was supported by China Scholarship Council which provided all fees for my work and life in France. The PhD degree is a very important achievement in one’s academic career, though it is full of challenge during the period. I have to highlight that my goal could have never been reached without the contributions of many other people. I hereafter express my appreciation to those persons involved in my PhD study and apologize in advance for those who are not mentioned involuntary.
I firstly would like to thank Prof. Jacques MARESCAUX who is the president of IRCAD and gave me the chance to investigate my research in his computer science team. I give my appre-ciation to the jury: Prof. Grégoire MALANDAIN, Prof. Nicolas PASSAT and Prof. Christian HEINRICH for arranging themselves to be part of the committee of my defense despite their extremely busy schedule. I also want to thank them for carefully reviewing my long thesis and giving many remarkable comments and suggestions which helped me to understand deeper and broader this research topic.
I need to express my sincere emotion to my thesis supervisors Prof. Yves REMOND and Prof. Luc SOLER who gave me the opportunity to participate in such interesting project and constantly guided me during the past three years with their enthusiasm. They always ex-plained me the details with patience when I had questions about the research or industrial ser-vices.
I would like to express my deep gratefulness to my advisor Dr. Stephane Nicolau who is full of wisdom and a brilliant mentor for me. I cannot imagine that I would have completed my PhD thesis without his help. I would like to thank his tremendous help and guidance in the work and life. His scientific training paves the way for me to be a good researcher.
I am very grateful to Dr. Vincent AGNUS who is an expert in computer programming and image processing. He is always full of passion and never hesitated to contribute with all his ideas and solutions to help me solve my problems. I would also like to give many thanks to Dr. Alexandre HOSTETTLER who is a specialist in breathing simulation. His deep experi-ence in breathing motion has contributed to help me better understand the registration prob-lem.
II The contribution from Dr. Jordan Bano cannot be neglected either. He always helped me at any time with a high enthusiasm whenever I asked him even if he had huge tasks to do. I would especially thank Sylvain BERNHARDT who spent much time to correct my thesis in the stressful periods and make it more fluent. I would also thank the image segmentation team who provided me clinical CT and MR images. I could have not continued my research work without their collaborations.
I would like to express my appreciation to Miss Pamela LHOTE who plays a very important role in my article writing. I also thank Julien WAECHTER and Pascal MONNIER from R&D department who gave me much help in the configuration of my computer programming envi-ronment. I also thank all members of the IT department who maintain all computers in our team and help fix any problems in time.
I am also thankful to many friends in Strasbourg, who shared their lives with me in the past three years. Particularly, my friend Xiao Xuan, who is always positive and gave many en-couragements when I had huge pressure during the thesis writing.
Finally, I want to express my deepest love to my parents and families who always support my pursuit in my life and give me the power to pass through any difficulties.
March 2015 Wenwu ZHU
I Content
Part I Main Thesis ... VI
Chapter 1 Introduction ... 1
1.1 Background ... 1
1.2 Objective ... 5
1.3 Outline of the thesis ... 5
Chapter 2 Clinical Background ... 8
2.1 The cancer in abdominal viscera ... 9
2.1.1 Hepatocellular Carcinoma ... 9
2.1.2 Kidney cancer ... 10
2.1.3 Pancreas cancer ... 10
2.2 Diagnosis and treatment approaches ... 11
2.2.1 The diagnosis of HCC ... 11
2.2.2 Treatment of HCC ... 13
2.2.3 Treatment for other cancers ... 17
2.3 Conclusion ... 17
Chapter 3 Image registration problem of the abdominal viscera ... 19
3.1 Medical image registration framework ... 20
3.1.1 Similarity measure ... 21
3.1.2 Transformation ... 27
3.1.3 Optimization ... 30
3.2 Image registration on the abdominal viscera region ... 31
3.3 Breathing motion ... 33
3.3.1 Introduction ... 33
3.3.2 The effect of breathing motion on the abdominal viscera ... 34
3.4 Existing registration methods to handle the sliding motion issue ... 36
3.5 Conclusion ... 40
Chapter 4 Fast segmentation of the abdo-thoracic wall and diaphragm ... 43
4.1 Related work on abdominal wall segmentation ... 44
4.1.1 Automatic approaches ... 44
4.1.2 Semi-automatic approaches ... 47
4.1.3 Anatomy of the thoracic and abdominal wall ... 47
II
4.2 Fast segmentation tool of the abdo-thoracic wall ... 50
4.2.1 Description ... 51
4.2.2 Discussion ... 56
4.3 Diaphragm Segmentation Interactive tool ... 57
4.3.1 Description ... 57
4.3.2 Discussion ... 60
4.4 Evaluation of the number of selected slices and tool efficiency ... 61
4.4.1 Experimental set up for the NSS ... 61
4.4.2 Results for the choice of NSS ... 62
4.4.3 Evaluation of the segmentation duration ... 63
4.5 Application: Visualization of the image without abdo-thoracic wall and diaphragm 64 4.6 Conclusion ... 66
Chapter 5 Abdominal wall & diaphragm removal for accurate non-rigid registration of multiphase clinical image ... 69
5.1 Methodology ... 70
5.1.1 Overview of our approach ... 70
5.1.2 B-spline-based non-rigid registration ... 71
5.1.3 Super Baloo non-rigid registration ... 73
5.2 Experimental setup ... 75
5.2.1 Image data ... 75
5.2.2 Evaluation metric ... 76
5.3 Results ... 77
5.3.1 Image comparison ... 77
5.3.2 Deformation field analysis ... 79
5.3.3 Quantitative analysis of registration on four abdominal organs ... 82
5.3.4 Accuracy analysis of abdominal vessels ... 85
5.4 Discussion and conclusion ... 87
Chapter 6 Automatic segmentation of AW: preliminary results ... 89
6.1 Image analysis ... 90
6.2 Method overview and a priori data extraction ... 93
6.2.1 Overview of strategy ... 93
III
6.2.3 The segmentation of muscle border ... 95
6.2.4 The segmentation of ribs ... 96
6.3 Segmentation of the AW ... 100
6.3.1 Search of the first control points CRF and CLF ... 100
6.3.2 Search of second control points CPRS and CPLS ... 101
6.3.3 Generation of the initial border of the AW ... 103
6.3.4 Refinement of the segmentation ... 104
6.4 Discussion and conclusion ... 105
Chapter 7 Conclusion and perspective ... 108
7.1 Contributions ... 108
7.1.1 Analysis of the motion mechanism in the abdominal viscera ... 108
7.1.2 Fast segmentation of abdominal and thoracic wall ... 109
7.1.3 Accurate registration of abdomen multiphase CT ... 109
7.1.4 Automatic segmentation of AW ... 110
7.2 Perspective ... 110
7.2.1 Extension to other image modalities ... 110
7.2.2 Improvement of the fast segmentation of AW ... 110
7.2.3 Improvement of the automatic segmentation of abdominal wall ... 111
7.2.4 Integrating our registration algorithm into a surgical planning software ... 112
Part II Appendix and bibliography ... 113
A. 1.1 Contexte Clinique ... 114
A.1.2 Objectifs ... 115
A.1.3 Notre stratégie ... 115
A.2.1 Outil de segmentation rapide de la paroi abdominale ... 116
A.2.2 Outil de segmentation rapide du diaphragme ... 117
A.3.1 Données expérimentales ... 118
A.3.2 Méthodologie ... 119
A.3.2.1 Description des deux algorithmes de recalage non-rigide ... 119
A.3.3 Résultats ... 119
A.3.3.1 Comparaison qualitative des images ... 119
A.3.3.2 Analyse quantitative du recalage sur quatre organes ... 120
A.5.1 Conclusion ... 123
IV Publications ... 140
VI
Part I Main Thesis
1
Chapter 1
Introduction
1.1 Background
Imaging is a vital component for medical research and clinical application. It includes the di-agnostic setting, surgical planning and post-operative evaluation. Given the significant ad-vancement of computer techniques and devices, the development of the medical imaging field has been promoted rapidly and thus changed the information acquisition mode. The traditional x-ray imaging technique provided 2D visual information of the interior of patients by printing the images onto radiographic films which were analysed in a light box. The information of 3D shape of the organ of interest and its spatial relationship with surrounding tissues could only be obtained based on the imagination and experience of the clinical surgeons and radiologists. The emergence of new imaging techniques, such as computed tomography (CT), magnetic resonance imaging (MRI), ultrasound (US), positron emission tomography (PET), functional MRI (fMRI), enabled the generation of a 3D volume image consisting in continuous slices, which can be viewed conveniently in the axial, coronal or sagittal plane with the use of multi-planar reformatted imaging. However, these techniques have different inherent imaging mechanisms and provide different visual information, thus bringing the requirement of inte-gration between these images. A special terminology of this process is image registration which aims at matching different image data of interest into the same spatial coordinate space, thus providing a comprehensive context for the clinical application.
Image registration is a crucial step in many medical fields with different purposes. For in-stance, one can:
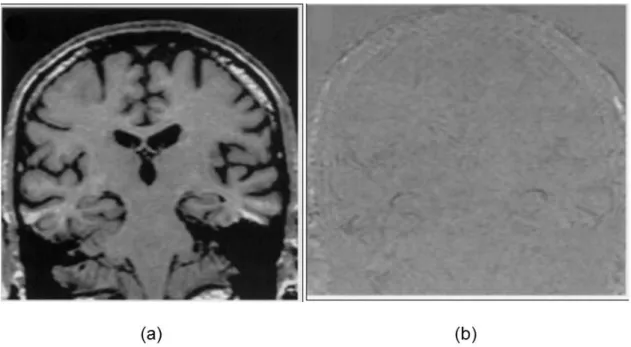
(I) Monitor the brain disease progress of the same patient over time (cf. FIGURE 1.1) with the use of fluid registration of serial 3D MR images (Freeborough & Fox, 1998;Fox & Freeborough, 1997). Such registration is called intro-patient mono-modal registration.
2 FIGURE 1.1: The registration of the brain. (a) The baseline MR scan of an Alzheimer disease patient. (b) The difference after the fluidly registration between the new scan after 22 months and the baseline scan (a). These images are from the paper of Freeborough & Fox, 1998.
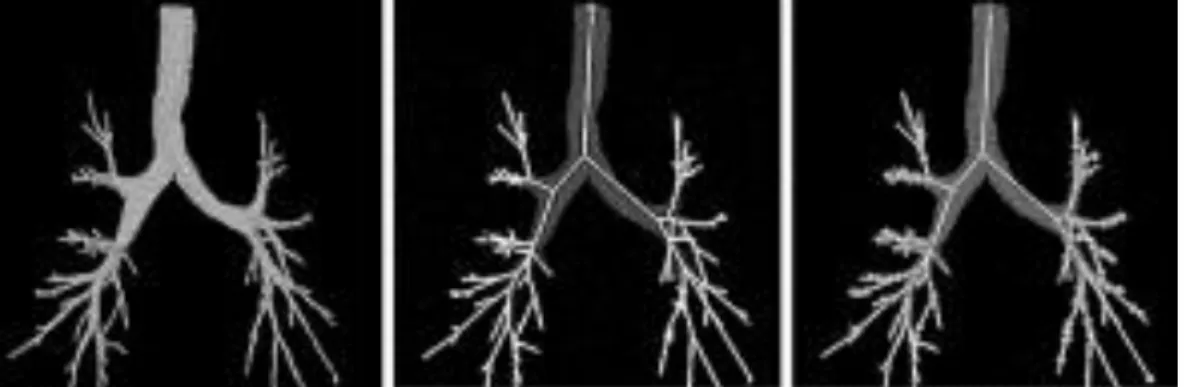
(II) Build a computerized human lung atlas from CT image with use of consistent landmark- and intensity-based thin-plate spline registration algorithms (B. Li et al., 2003;B. Li et al., 2012). The lung, airway tree and skeleton are segmented auto-matically (cf. FIGURE 1.2) using the segmentation from (S. Hu et al., 2001;
Kiraly et al., 2002), then the airway branch points are extracted as the internal landmarks for establishment of the correspondence during the registration (cf. FIGURE 1.3). In this context, the registration is still mono-modal but inter-patient. A similar work is the construction of a statistical shape model of anatomical varia-bility of brain, in which a deformable registration is adopted to establish the point correspondences between shapes from different patients (Rueckert et al., 2003;
3 FIGURE 1.2: From left to right: Airway tree, center lines, and branch points which are ex-tracted from the pulmonary CT image (B. Li et al., 2003).
FIGURE 1.3: The matching example of branch points from airway trees of different subjects (B. Li et al., 2003).
(III) The quantification of the perfusion for the heart would be impossible without the use of registration to correct the motion due to the fact that the heart beating can-not be controlled consciously (Bidaut & Vallée, 2001). The registration is per-formed on the dynamic cardiac MRI after contrast media injection and each image from the dynamic sequence was spatially registered to the reference image.
One can note that most registration work focuses on one organ only. Although mono organ registration is medically relevant, there are many clinical contexts where the environment of organs is important. Particularly for abdominal regions in which there are many potential can-cers, almost all registrations focus on one organ only, e.g. liver (Carrillo et al., 2000; Torsten Rohlfing et al., 2004; KM Brock et al., 2003; W.-C. C. Lee et al., 2005; Lange et al., 2005;
Cash et al., 2007; Lange et al., 2009; Wein et al., 2008; Peterhans et al., 2011; Vijayan et al., 2014; Sundarakumar et al., 2015; Mauri et al., 2014), kidney (Zöllner et al., 2009; Yang et al., 2014; Nishiyama et al., 2014; Spiegel et al., 2009; Leroy et al., 2004; Kaus et al., 2007), pan-creas (M. J. Murphy et al., 2000; Kandel et al., 2009; Donati et al., 2010) , whereas we know
4 that an accurate registration between the organs and its surrounding vessels is important for the surgical planning , for instance, hepatic and adrenal gland surgery. In the procedure of du-odenopancreatectomy, the surgeon needs to assess accurately their relative positions to sur-rounding organs (spleen, pancreas and transverse colon) to choose the right instrument access. Another common example is the gallbladder surgery, which involves vessels around the liver, the stomach and the pancreas, which are not inside one organ only.
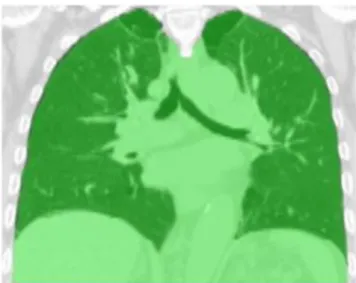
However, the image registration of abdominal viscera is complicated. The abdominal organs are soft tissues and can be deformed due to the gravity and other muscle contractions. The pa-tient position is difficult to keep the same between several image acquisitions which can also lead to the position variation of organs. The position of abdominal organs is also dependent on the point or phase of the breathing motion, particularly the liver and spleen, because they are attached to the diaphragm. In addition, there are no fiducial markers can be used in this region, while such markers are usually employed for the registration of brain. There is also the discontinuous motion between the abdominal viscera region and abdo-thoracic wall which is mainly caused by the breathing motion. FIGURE 1.4 illustrates this phenomenon from multi-phase CT image, the venous multi-phase data being superimposed onto the artery multi-phase in axial, frontal and sagittal view respectively. Venous and artery phase CT images are two CT scans acquired on the same patient while a time gap round one minute. The patient is asked to take an inspired breath motion held to obtain a same magnitude of the organs, which particularly seldomly happened. One can see the big difference of the ribs positions in FIGURE 1.4 (b) due to the sliding motion, and the big deformation of abdominal organs. The sliding motion makes the registration problem more complicated, namely the discontinuous deformation field between the abdominal organs and abdominal-thoracic wall. The feature of deformation field with high discontinuities contradicts the general assumption of usual registration algorithms in which the entire motion field should be smooth.
5 FIGURE 1.4: Illustration of sliding and deformation by superimposing the venous phase im-age onto the artery phase in axial (a), frontal (b) and sagittal view (c) respectively.
1.2 Objective
The purpose of this thesis is to propose an approach for registering the abdominal viscera de-spite the problem we described previously. Our approach should overcome the following con-straints:
1) We aim at finding a technique which is able to register the entire abdominal viscera organs and their surrounding vessels.
2) We want to propose a registration approach, which deals with the breathing and its influ-ence on abdominal viscera motion.
3) We currently investigate the multi-phase CT image registration, and will expand our ap-proach to CT-MR in the future.
1.3 Outline of the thesis
This thesis is organized in 7 chapters, including the general introduction in Chapter 1 and general discussion and conclusion in Chapter 7. The content of other chapters is organized as follows:
Chapter 2 provides the clinical background. We firstly introduce the cancer in the abdominal viscera region especially related to the liver. Then the diagnosis and treatment approaches of Hepatocellular Carcinoma (HCC) are reviewed, which highlight the significance of the surgi-cal planning and its role for the theraphetic decision. Practisurgi-cally, understanding the tumor
po-6 sition and its spatial relationship with surrounding vessels explains why the registration is critical during the surgical planning step to increase the surgical success chance.
Chapter 3 gives an overview of image registration, which is helpful for readers to understand our approach. We realize that the traditional registration method is not sufficient and robust for abdominal viscera region, since the effect of the breathing motion should be processed specifically. We thus analyse the mechanism of the breathing motion, and review the work which aims at handling the sliding motion for the registration. This review shows that no ex-periment has been focused on abdominal viscera but existing results related to lung registra-tion, thus confirms our feeling: sliding motion as a priori knowledge should be provided to the registration approach. We finally propose to perform a segmentation of the abdo-thoracic wall and further exploit this information to remove the sliding motion effect on the registra-tion of the abdominal viscera.
Chapter 4 describes the contribution of two interactive segmentation tools we developed to quickly delineate abdo-thoracic wall and thoracic viscera. There is a large number of slices in a 3D CT volume image, in general more than 200: an expert needs to spend more than 5 hours to finish the segmentation of abdo-thoracic wall slice by slice. We propose to perform a fast segmentation by delineating several selected slices in axial view (resp. sagittal view for tho-racic viscera), the remaining slices being automatically segmented with the used of B-spline based interpolation technique. The segmentation accuracy and the number of selected slices (NSS) that must be interactively delineated are also evaluated and discussed. The segmenta-tion results will be used in the following registrasegmenta-tion work. The work in this chapter has been published in the MICCAI 2012 workshop on Computational and Clinical Applications in Ab-dominal Imaging (Zhu et al., 2012) and is currently under review in the Journal of Computer Surgery.
Chapter 5 describes our approach to tackle the multiphase CT abdominal viscera registration. Since the main error is caused by the discontinuity of the deformation field close to boundary between thoracic wall (AW) and thoracic viscera, we choose to replace the abdo-thoracic wall from images by an homogenous value using the previous segmentation. To veri-fy the influence of lung in abdominal viscera registration, we also use images without abdo-thoracic wall and abdo-thoracic viscera (AW&TV). A state-of-the-art non-rigid registration algo-rithm was designed and implemented to register the abdominal viscera generated by previous segmentation. Super Baloo (SB) algorithm was also employed to show that our approach is
7 not fully dependent on a specific registration algorithm. Finally, a complete evaluation of the registration accuracy, not limited to one organ only, is performed qualitatively and quantita-tively, which includes the visual analysis of deformation field, the measurement of organ sur-face distance, and the error calculation of the vessel bifurcations.
Chapter 6 presents our first attempt to provide automatic segmentation of the AW, which was motivated by the excellent registration we obtained in the previous chapter. We firstly analyse the AW shape in axial, sagittal and frontal slices and explain why we believe the AW seems easier to delineate in frontal slices. Then, we propose a segmentation method based on a first step of prior segmentation (lungs, ribs and abdominal muscles), followed by a refinement per-formed using image gradient along a specific direction. Finally, experiments on patient data are performed and encouraging results are obtained. However, they also indicate that a better prior analysis and understandings of the patient anatomy is necessary to reach the accuracy expected by practitioners.
8
Chapter 2
Clinical Background
Nowadays, it is well known that brain registration is mandatory for clinical analysis of the brain function (Pietrzyk et al., 1996;Jenkinson et al., 2002;Jay West et al., 1997;Holden et al., 2000;Avants et al., 2011;Chen & Varshney, 2003;Klein et al., 2010), and also suited for im-age guided neurosurgery (Dogra & Patterh, 2014; Warfield et al., 2002; Gering et al., 2001;
Grimson et al., 1996; Ferrant et al., 2002).
In the abdominal area, similar work has been performed essentially for the liver (Torsten Rohlfing et al., 2004; KM Brock et al., 2003; W.-C. C. Lee et al., 2005; Lange et al., 2005;
Cash et al., 2007; Lange et al., 2009; Wein et al., 2008; Peterhans et al., 2011; Vijayan et al., 2014; Sundarakumar et al., 2015; Mauri et al., 2014), which manages to provide fusion of several modalities, each giving their specific information related to the liver context, such as tumor, artery position, hepatic vein, biliary tree and portal tree. Obviously, this work is im-portant, but the abdominal area is not limited to the liver. There are many pathologies involv-ing not only one organ, yet its environment as well. In literature, as far as we know, there is no registration method for abdominal viscera.
In this chapter, we propose to explain why information fusion of the entire abdominal viscera is crucial for a better diagnosis and surgical planning. Section 2.1 first presents general can-cers in abdominal viscera region. Then, Section 2.2 describes diagnosis and treatment ap-proaches which related to the described cancers in previous section. We also introduce the surgical planning role to choose an optimized therapy, and emphasize why registration of en-tire abdominal area can directly affect the success of the surgical planning and consequently that of the surgical outcome.
9
2.1 The cancer in abdominal viscera
There are many critical cancers in the abdominal viscera region which includes the liver can-cer, renal tumors and pancreas tumors. We briefly describe these diseases and their corre-sponding treatment approach.
2.1.1 Hepatocellular Carcinoma
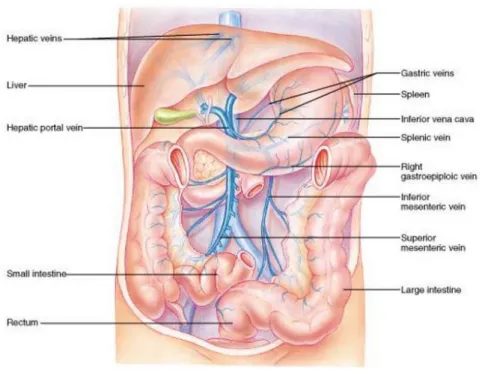
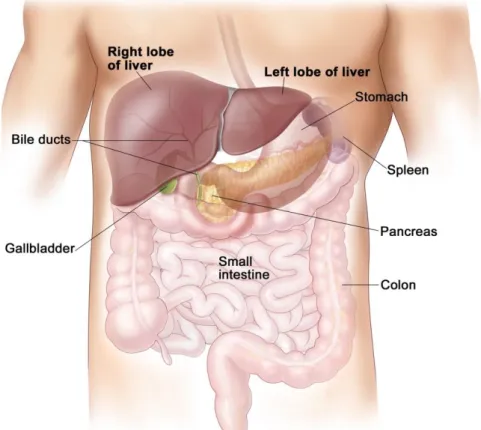
The liver is the largest organ in the abdominal viscera and the most complex one. It is located in the upper right-hand position of abdominal cavity, under the diaphragm and above the stomach and the right kidney (cf. FIGURE 2.1). The liver is made of soft pinkish-brown tis-sue and linked to the peritoneum of the abdominal cavity. The hepatic portal vein and hepatic artery supply blood to the liver where it is processed, added nutrients and sent back to the whole body by the hepatic vein. The liver also contains many other functions which are vital for almost all organs (Heimann et al., 2009)
FIGURE 2.1: Illustration of liver anatomy and surrounding vessels, the figure is cited from the website of (Cummings, 2001).
HCC is a tumor of the liver and is also one of the most common malignancies all over the world (J. M. Llovet et al., 2003;M. Sherman, 2005;Bruix et al., 2004). Each year, over a mil-lion people’s deaths are related to HCC. The incidence rate varies largely with the region of the world, the number is approximately 2-5 cases per 100, 000 people in developed western
10 countries, but more than 100 per 100, 000 people in the south-east Asia and sub-Saharan Af-rica regions (El-Serag & Mason, 1999;Park, 2005). A report shows that the mean survival pe-riod of the patients with HCC is 6-20 months (Di Bisceglie et al., 1988), and this situation has not improved visibly though the technique of the diagnosis and treatment therapy has ob-tained significant progress (Bruix et al., 2001).
2.1.2 Kidney cancer
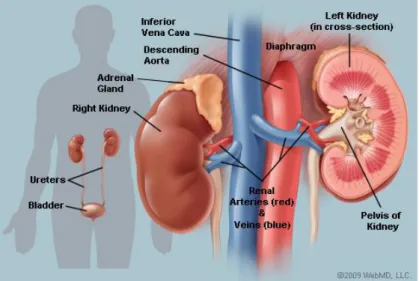
There are two kidneys in the human body (cf. FIGURE 2.2), the left kidney is under the spleen and the right kidney is under the liver, being slightly inferior to the left one due to the big volume of the liver. Kidneys are located deep behind the peritoneum and are well protect-ed by the ribs and muscles of the back to avoid external damages. The function of kidney is to filter water and impurities in the blood. One third of all blood pushed from the heart enters the kidneys and flows to the other organs and tissues via the renal veins system after the filtering process (Marieb & Hoehn, 2007).
FIGURE 2.2: Illustration of the kidney anatomy cited from ("Picture of the Kidneys," 2014).
2.1.3 Pancreas cancer
The pancreas sits across the back of the abdomen, behind the stomach, and is surrounded by other tissues including the liver, intestine, duodenum, bile duct and spleen (cf. FIGURE 2.3). The two main functions of the pancreas is the exocrine which helps the digestion and the en-docrine which regulates blood sugar. There are several blood vessels surrounding the pancre-as: the superior mesenteric artery, the superior mesenteric vein and the portal vein. These
ves-11 sels supply blood to the pancreas and other abdominal organs. The pancreas cancer is not very common and occurs about 1 in 10,000 people in the UK ("REAL HUMAN PANCREAS," ).
FIGURE 2.3: Illustration of the pancreas position in the abdomen ("REAL HUMAN PANCREAS," )
2.2 Diagnosis and treatment approaches
2.2.1 The diagnosis of HCC
The identification of early HCC is critical for the survival of patients (Tangkijvanich et al., 2000). The alfa-fetoprotein (AFP) and ultrasound (US) imaging are the most commonly used tools to screen HCC (Wong et al., 2000). The AFP was first used as a marker to identify HCC 40 years ago (K.-Q. Hu et al., 2004). The level of AFP for a normal adult is smaller than 10 ng/dL, and the value will be elevated to more than 400-500 ng/mL for the patient with HCC. However, research also indicates that the positive predictive value (PPV) of AFP is low, which varies from 9% to 32% (Befeler & Di Bisceglie, 2002), due to the difference of popula-tions and regions. The accuracy of AFP for predicting HCC still needs to be improved by in-vestigating it at a cell component level (Bialecki & Di Bisceglie, 2005). In addition, US imag-ing is simultaneously used to detect the small hepatic tumors smaller than 3 cm due to its low
12 cost and non-invasive nature. With the combination of AFP and US imaging, PPV has im-proved effectively and its value is up to 94% (Morris Sherman et al., 1995). Some studies also indicate that CT scans have a higher PPV than either AFP or US when either of them is used independently (Chalasani et al., 1999a). A review reports that a CT scan is used by nearly 25% of hepatologists to detect the tumor in the United States on high-risk patients (Chalasani et al., 1999b).
If an abnormal region or lesion is detected during the previous screen stage, it is required to adopt an advanced technique for the diagnosis. Triple phase CT and triple phase dynamic con-trast-enhanced MRI are two of the most effective imaging techniques for achieving the diag-nosis of suspected HCC lesions (D. Choi et al., 2001). The mechanism of these two tech-niques is similar, so here we focus on the triple phase CT. One can obtain more information on a comparison between them in the following papers (B. I. Choi, 2004;Sadek et al., 1995). The mechanism is that a specific contrast agent is injected intravenously and the CT scan is performed at various time intervals. Triple phase means the CT image is acquired with respect to the different states of the contrast agent as it flows in the blood, which is usually defined as before contrast, during arterial and venous phases. A contrast agent is used due to the fact that the target HCC derives the blood predominantly from the hepatic arteries, and this results in much more enhancement of the suspected HCC in the arterial phase 2-40 seconds after the contrast agent infusion. The surrounding normal hepatic tissues absorb 75%-80% of the blood from portal vein (Bialecki & Di Bisceglie, 2005), and thus are more visible and highlighted in the following venous phase which is 50-90 seconds after the injection of contrast agent. James H. Oliver and his colleagues investigated the value of arterial phase CT imaging for the detection of HCC tumors by comparing results with those from unenhanced imaging and the venous phase CT (Oliver 3rd et al., 1996). After the acquisition of triple phase CT images on 81 patients with proven HCC, three blinded persons were invited to evaluate and record the number of unique or common lesions seen at each phase. The statistic result shows that 27% (89-111) of tumors can be seen on the arterial phase image and were not seen at the portal phase. And 17% tumors (45-55) are seen on the unenhanced images and cannot be inspected in the portal phase. Thus, the combination of these three phases imaging can detect much more HCC lesions than any of each imaging used independently, and finally improve the sur-vival rates of patients.
13 Both CT and MRI are able to detect and identify the HCC tumor whose size is over 2 cm. The detection accuracy of both techniques is around 70% due to the anatomy similarity between HCC tumor and dysplastic nodules, focal fat and peliosis (Brancatelli et al., 2003). For sus-pected tumors whose size is below 2 cm or if the lesion is uncertain, another diagnosed ap-proach (biopsy) is recommended as it is safe and effective (Borzio et al., 1994). Biopsy has been used for lesion evaluation for more than half a century and is investigated in following papers (Caturelli et al., 2004;Bravo et al., 2001;G.-T. Huang et al., 1996).
2.2.2 Treatment of HCC
Treating the HCC tumor and optimizing the patient survival is a complicated task. The con-sidered factors include bulk, number, severity and associated comorbidities as well as the cur-rent medical condition of the patient, from which the therapy type is decided. The clinical terminology is the staging of the tumor which is critical during treatment procedure. Taking different criteria and aspects into account, there are several staging systems: Barcelona-Clinic liver Cancer (BCLC), Cancer of the Liver Italian Program, the Chinese University Prognostic Index and Japanese Integrated staging (El-Serag et al., 2008). However, to date, there is no gold standard for evaluating the stage of HCC tumor. BCLC (Josep M Llovet et al., 1998) is mainly adopted by radiologist (cf. FIGURE 2.4). It defines each stage by combining the tu-mor feature and the corresponding liver function feature. The status of liver function is de-clared using a classification system called Child-Pugh classification of liver disease severity, which calculates and grades the amount of the bilirubin, albumin, prothrombon time and en-cephalopathy. The BCLC system also provides the treatment strategy for each stage of HCC, e.g. the stage A2 of the patient is suitable to be applied radiofrequency ablation or transplant therapy. With the guidance of the precise staging of the HCC tumor, the therapy of treatment can be chosen much more efficiently and the survival of patient can be extended. Due to the complicated clinical context, to date there is no gold standard strategy to process all different type of tumors. We give hereafter an overview of the main treatment approaches for the early stage of HCC.
14 FIGURE 2.4: The illustration of the BCLC staging system, the figure originated from (NEXAVAR, 2008)
Surgical resection
Surgical resection means the removal of the liver part which contains the tumor. The goal of this operation is to directly remove whole tumors and this strategy usually increases the resec-tion margin to ensure no tumor porresec-tion remains. This treatment therapy is mainly chosen for patients without cirrhosis, because the resection operation is based on the physiology feature of liver, namely, the preserved liver is capable of growing again and compensate for the re-moved portion. Cirrhosis makes HCC patients face two risk factors – a hepatic decompensa-tion and a decreased ability of hepatocyte regeneradecompensa-tion. The pordecompensa-tion of patients without cir-rhosis in western countries is roughly less than 5% in all HCC patients, and nearly 40% in Asian countries (Bolondi et al., 2001). The choice of hepatic resection also considers the tu-mor size, number and invasion to blood vessels. The detailed effect of these factors has been investigated by one research on the survival of 557 patients group (Vauthey et al., 2002). The statistical results show the different effect of these factors on the 5-year survival rate as fol-lows: for tumor size <5 cm it is 43%±3%, for tumor size >5 cm it is 32%±3%; for single tu-mor it is 45%±3%, for the multiple tutu-mors it is 45%±3%; without major vascular invasion it is 41%±2%, with vascular invasion it is 15%±5%. Generally, 5-year survival rate with surgi-cal resection is around 30%-50% (Josep M Llovet et al., 2005).
Surgical resection planning requires the surgeons to estimate the liver segment boundaries according to the portal veins tree (Reitinger et al., 2006) and also consider the volume and function of remaining liver after the operation. Anatomical variations can lead surgeons to
15 make wrong decisions. For instance, the tumor located at segment boundary can result in too much tissue being removed (Glombitza et al., 1999).
This step is extremely difficult when the tumor is visible only on the arterial phase and its margin is totally invisible in the venous phase. Indeed, the liver segments can be delineated from the vein network only. Consequently, if the tumor position is not accurately understood in the venous image, which is the case when arterial and venous phase images are not regis-tered, there is a risk of diagnosing its position in a wrong segment, or of missing that the tu-mor belongs to several segments instead of one, or of believing it belongs to several segments whereas it is located in one segment only. Such mistakes clearly influence the patient survival outcome.
Another main difficulty, when a surgeon has to plan a segmentectomy due to a tumor, is to check that the artery passing by the considered segment does not supply blood to another segment. If this is the case, removing the cancerous segment will lead to an ischemy of the neighbour segment cells, which will thus destroy the neighbour segment function. A good un-derstanding of the 3D position of hepatic arteries (visible in arterial phase) with respect to each hepatic segment (visible in venous phase) is thus crucial to choose the appropriate sur-gery. In case of bad spatial interpretation, the patient’s survival may be highly reduced. Both previous examples clearly demonstrate why an accurate registration of arterial and venous phase is important.
- Liver transplantation
Liver transplantation is, theoretically, the best approach for treating the HCC. It can remove the HCC and potential related tumors fully and diminish the recurrence rate dramatically. Currently, the 5-year survival rate is 70% and very low recurrence rates smaller than 15% (Josep M Llovet et al., 2005). This excellent outcome is accomplished due to the optimal can-didate selection by referring to the Milan criteria (a single lesion smaller than 5 cm or up to three nodules smaller than 3 cm) (El-Serag et al., 2008). As the number of candidates for liver transplantation grows, the big issue is the shortage of donors and the long time waiting further decrease the survival rate.
16 Percutaneous radiofrequency ablation (RFA) is the most adopted therapy for the early HCC patients due to the fact that there are few patient candidates who are eligible for hepatic resec-tion and liver transplantaresec-tion (El-Serag & Mason, 1999). RFA is further extended to play a bridge role for patients who are waiting for a liver transplantation and also used to remove the tumors in the lung and kidney (Pavlovich et al., 2002;Gervais et al., 2005;Gillams, 2005). The mechanism of RFA is that an electrode is placed into the center of the target tumor and a high frequency alternative current moves from the tip of the electrode to the surrounding tis-sue (cf. FIGURE 2.5). Usually, the needle placement is carried out under CT or US image guidance. The ions of the tissue move along the direction of the alternative current and this results in the generation of frictional heat (cf. FIGURE 2.6). The tissue cells begin to die when the temperature approaches 60°C and generate the necrosis surrounding the electrode. The clinical temperature produced by the RFA often exceeds 100°C and causes the death of the tumor and parenchymal cells. Ultimately, the tissue microvasculature is destroyed due to the thrombosis occurring in the hepatic arterial and portal venous branches. The extent of the tissue destroyed by the RFA depends on the impedance of the tissue and is also in proportion to the square of distance from the electrode. Thus, the generated high temperature rapidly de-creases as the distance from the needle probe gradually inde-creases. Clinically, the HCC tumor with a maximum diameter smaller than 2.5 cm can be ablated by the RFA (Curley, 2003). The multiple electrode arrays are designed and placed for tumors with a size larger than 2.5cm (Lencioni & Crocetti, 2008).
FIGURE 2.5: Illustration of the RFA originated from ("Radiofrequency Ablation (RFA)," 2010)
17 FIGURE 2.6: Illustration of the heat generation of the needle originated from ("Interventional Radiology Services," )
One of the main difficulties in RFA is the planning of the needle trajectory, which must avoid critical vessels. The poor visibility of the needle and tumor in US and CT images can lead to improper needle placement, resulting in the inadequate ablation beyond the tumor margins or thermal injury to adjacent structures (Livraghi et al., 2003). In addition, if the tumor is visible in the arterial phase only and hardly visible in the venous phase, the selection of a trajectory from arterial image using a mental registration with the venous phase image is hazardous, since it may result in a trajectory crossing a vein.
2.2.3 Treatment for other cancers
Renal cell cancer is the most common type of kidney cancer and can be treated by biological therapy, radiotherapy, cryotherapy, radio-frequency ablation and arterial embolization.The treatment options for the pancreas cancer contain surgery, chemotherapy and radiotherapy. The selection of the specific treatment option depends on many factors such as the stage of the cancer, the tumor position and the patient’s health condition.
2.3 Conclusion
As we described in the previous section, there are many treatment options for different can-cers in the abdomen. The key factors influencing the decision are tumor location, size, spatial relation with adjacent vessels as well as the post-operative liver function. Successful opera-tions depend on accurate preoperative planning that gives the physicians and surgeons a
de-18 tailed understanding of the complex structure of abdominal organs, allowing to choose the best therapeutic option.
Multiphase CT imaging technique is used to obtain the necessary anatomy information and help diagnosis. However, the surgical planning can still be challenging because the abdominal organ shape, position and relation to adjacent structures and vessels may differ significantly between several image acquisitions. Therefore, surgeons must currently perform a mental reg-istration between the multiphase CT data, which can be hazardous and lead to inappropriate treatment. Providing a software allowing to accurately register such data is thus critical to im-prove the surgical planning step and increase the patient survival rate.
19
Chapter 3
Image registration problem of the
ab-dominal viscera
In the previous chapter, we have seen how registration can play an important role during sur-gical planning of abdominal viscera. However, the literature reports little work about viscera registration. The purpose of this chapter is to understand why this registration is a complex task, give an insight analysis of the existing problems and propose an approach to overcome such issues.
In this chapter, we firstly give an overview of the registration theory. We describe the feature and classification of each component and the corresponding application context. Then the sec-tion 3.2 summarizes the image registrasec-tion work related to the abdominal region and highlight why breathing motion cannot be ignored to get an accurate registration on the entire viscera area. The section 3.3 deeply analyzes the causes of the inaccurate registration and concludes that the pre-segmentation of AW is a good approach to remove the sliding motion influence on the registration result. The section 3.4 gives an overview of related registration work han-dling the sliding motion issue.
20
3.1 Medical image registration framework
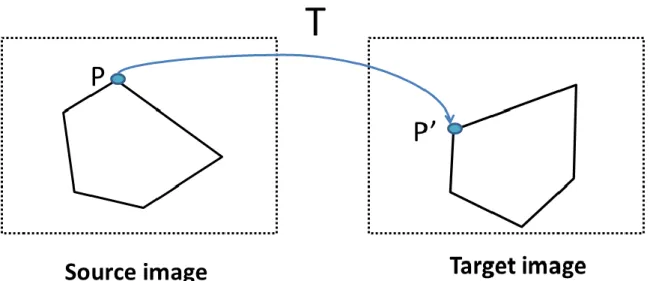
Image registration is a process to find a spatial coordinate mapping of the pixels (voxels in a 3D volume) from a source image to a target image (cf. FIGURE 3.1), so that the information in the source image can be aligned and fused into the target image for analysis. This matching process is usually required due to the fact that medical images are acquired at different times, views, positions and statuses on the same or different subjects. Because the registration in our research is in 3D space, we use the voxel to represent a point in the 3D CT volume image in the following chapter. Our research focuses on the CT image acquisitions at different time from the same patient.
FIGURE 3.1: The image registration definition is to match the corresponding points between source and target image by using a transformation T.
The image registration framework is usually as follows and depicted in FIGURE 3.2, target and source images are input as data source, the source image will be modified and aligned to the target image (template) at the level of the voxel. The spatial relationship between the voxel in the source image and corresponding point of the target image is described as a trans-formation model. A similarity value of these two images is calculated, the optimization mod-ule continues to look for better parameters of the transformation model if the similarity value has not reached the expected accuracy, this procedure is iterated until the similarity value is satisfied or the maximum number of the iterations is reached. Since it is difficult to obtain the “best” transformation model immediately and complete the registration procedure, the real
21 implementation approach is usually an optimization process by maximizing a similarity met-ric. Sometimes, it can be reformatted as minimizing a cost function by adding a minus symbol before some similarity metric function which is positive, so that the best transformation ma-trix searching process is converted to optimize a global minimum value in the mathematical format, which is convenient for the algorithm implementation.
Briefly, the registration framework can be decomposed into mainly three components (Crum et al., 2014):
-Similarity measure: it defines the degree of the similarity between the target and trans-formed source image based on the specific image information used in the registration;
-Transformation model: it specifies the mapping path of how to displace the voxel in the source image to its corresponding point in the target image;
FIGURE 3.2: The framework of image registration.
-Optimization process: it searches the transformation parameters corresponding to the global maximum value of the similarity metric according to a specified search scheme.
We give hereafter a basic introduction of these three components, one can refer to correspond-ing references for deeper and broader details.
3.1.1 Similarity measure
The similarity measure is the most important factor for the success of registration, because it defines the criterion during the iterative optimization process. Its choice usually depends on
22 the image information used in the registration. The latter can be divided into two main catego-ries, geometric-based and intensity-based. A geometric-based registration builds the corre-spondence model between target and source image with the use of geometric feature ele-ments, the most widely used ones being landmarks and surfaces.
Geometric-based registration
The landmarks can be clustered into two categories: internal and external landmarks, which can be defined and marked based on image information of the anatomy structure of interest (Maurer Jr et al., 1997; Schad et al., 1987; Strother et al., 1994). Internal landmarks are usual-ly identified interactiveusual-ly by medical experts with the use of image processing software (Yu, 2005). They are chosen and marked in both target and source images, the spatial correspond-ence between them being established from the consideration of surrounding anatomy features. If the image lacks sufficient information for identifying feature points, external landmarks are used. They are usually close to the patient skin and should be visible by all image modalities (Hutton & Braun, 2003; Nicolau et al., 2005; Nicolau et al., 2009; Yu, 2005). After the estab-lishment of the landmark correspondences, the registration process is converted into searching a transformation T in order to obtain a minimal distance between landmark pairs, which can be mathematically defined as following:
SumOfDistance = (∑𝑁𝑖=1(𝑇(𝑝𝑖) − 𝑞𝑖)2)12 (3.1)
where (𝑝𝑖, 𝑞𝑖) is one pair of landmark from source and target images respectively. The
trans-formation T is a rigid or affine model due to the limitation of landmark number.
Surface-based registration is usually divided into three classical steps: the extraction of faces or boundaries of structures of the interest, the registration of the target and source sur-faces, the extension of the surface deformation field to the whole volume (Declerck et al., 1996; Grimson et al., 1996; Herring et al., 1998; Maurer Jr et al., 1998;Crum et al., 2014). In medical images, boundaries and surfaces are usually more distinctive than landmarks and can be extracted with the use of segmentation algorithms due to the high contrast of surface, e.g. the skin. A famous surface-based registration method is called the head-and-hat algorithm proposed by Pelizzari et al. (1989). In this method, two surfaces are identified and the source surface is represented by point sets and refers to as the hat. The target mesh is represented as a list of dics and referred to as the head. The rigid transformation is searched and iterated by
23 minimizing the distance between points from the hat surface and the corresponding closest vertex points in the head surface. However, the distance measurement is prone to generate error due to the fact that the closest point in the target surface is not always in the direction of the head centroid.
Recently, the most popular and widely used approach proposed to perform the registration between two surfaces is called the Iterative Closest Points (ICP) algorithm and other derived methods (Arun et al., 1987; Besl & McKay, 1992). Given two point sets extracted from the target and source surfaces, the purpose of ICP is to find a rotation and translation transfor-mation which generates the least-squared distance between the two point sets until it meets the desirable accuracy or value.
Firstly, given the initial estimation of the rigid transformation parameters, the source point sets are transformed and the closest point in the target points sets is searched by calculating the least-squared distance. Then, a new translation and rotation matrices are calculated based on the previous matched points. The new source point sets will be calculated using this new transformation and the least-squared distance is recalculated. This iterative process will con-tinue until the local minimum value meets the convergence conditions. The limitation of this method is the large computation time and number of iteration as well as the risk of converging into a local minimum. Several improved version of this algorithm can be found in these pa-pers (Rusinkiewicz & Levoy, 2001; Z. Zhang, 1994;Pomerleau et al., 2013; Low, 2004).
Intensity-based similarity measurement
Another branch of the similarity measurement is based on the intensity information (the voxel grey value) of the target and source images and request statistical computations. The intensi-ty-based similarity measurements mainly include the Sum of Squared differences (SSD), Cor-relation Coefficient (CC) and Mutual Information (MI).
The simplest voxel similarity measurement is SSD, which assumes that the intensity value of each point should be the same after registration up to a Gaussian noise (Hajnal et al., 1995;Zhao et al., 1993;Viola & Wells III, 1997). Given the number of voxels N in the overlap domain ΩA,B, the SSD can be described using the following mathematical equation:
𝑆𝑆𝐷 = 1
𝑁∑ |𝐴(𝑥) − 𝐵(𝑇(𝑥))| 2
24 where A(x) and B(T(x)) are the intensity value of voxel x in the images A and B respectively, and T is the transformation.
The registration process aims at reducing the SSD value iteratively by optimizing the trans-formation parameters. The SSD has been widely used in the MR image registration of brain, since the brain registration is usually rigid or affine, and the MR images have similar intensi-ties which allows comparing grey level intensity scale from one MR-scanner brand to another one (Hajnal et al., 1995; Ashburner, 2007; Holden et al., 2000). It is obvious that the SSD cannot be used for measuring the intensity value difference of inter-modality registration. We can also highlight the SSD is sensitive to a small number of voxels which have a big value difference between target and source image. For instance, if images A and B of a same patient are acquired using contrast material injected into the patient at a different time window (Hill et al., 2001).
As already mentioned, the SSD measurement has a strict assumption about the intensity in-formation between the two input images. Another less strict metric is the Correlation Coeffi-cient (CC) which assumes the intensity value between target and source images following lin-ear relationship. It can be described as following:
𝐶𝐶 = ∑𝑥𝜖Ω𝐴,𝐵((𝐴(𝑥)−𝐴 ̅ )(𝐵(𝑇(𝑥))−𝐵̅)) {∑ (𝐴(𝑥)−𝐴 ̅ )2 ∑ (𝐵(𝑇(𝑥))−𝐵̅)2 𝑥𝜖Ω𝐴,𝐵 𝑥𝜖Ω𝐴,𝐵 } 1 2 ⁄ (3.3)
where A ̅ and B̅ are the mean intensity value in image A|ΩA,Band B(T(x))|ΩA,B, respectively.
CC has been used in the registration of MR and functional MR images (Lemieux & Barker, 1998; J. Kim & Fessler, 2004; Andronache et al., 2008).
Mutual information
Both of SSD and CC similarity measurements are used for the same or similar modality im-ages which have similar grey value, but they are not suitable for multi-modality image regis-tration, such as CT and MRI, PET&MRI, arterial and venous phases CT. In this context, the intensity characteristic of both input images is totally different and there is no obvious rela-tionship between them. Thus, new similarity measurements have been developed, which can reflect this fact and measure the similarity in the registration. The most widely used and
ro-25 bust approach is MI and its derived algorithms (Mattes et al., 2001; Maes et al., 1997; Mattes et al., 2003; Holden et al., 2000).
MI is a concept from the information theory, it means how much information one variable contains about another random variable. It has been introduced into the medical image regis-tration field by Collignon et al. (1995) and Viola and Wells III (1997) independently. Thus MI can be seen as an approach to measure how well two input images are registered and max-imized when images are aligned correctly. Given the image A and B, the MI can be calculated as following:
𝐼(𝐴, 𝐵) = 𝐻(𝐴) + 𝐻(𝐵) − 𝐻(𝐴, 𝐵) (3.4)
where H(A), H(B) represent the marginal entropy of the grey value in image A and B respec-tively, and H(A,B) denotes the joint entropy of A and B. The equation shows that the mutual information is not contributed by the entropy information of individual images only, but also by the joint information between them. The classical calculation method of general marginal entropy H is proposed by Shannon (2001) as:
𝐻 = − ∑ 𝑝𝑖 𝑖𝑙𝑜𝑔(𝑝𝑖) (3.5) where pi is the marginal probability distribution of the symbol i.
Entropy H will have a minimal value 0 if the occurring probability of one symbol is 1 and the probability of all other symbols is zero, and have a maximum value if all have an equal occur-ring probability.
In the field of image, the entropy can be calculated from the intensity value histogram in which the probabilities are the histogram entries. If an image has only one single intensity value 200, then its histogram has only one peak value at 200 and thus the probability of the voxel value 200 is 1. For all other intensity value it is 0 and the entropy of this image is − ∑2001log1= 0. If there is some noise in this image, it means the occurring probability of other intensity values is increased, which spreads the histogram and finally increases the en-tropy value. In other words, the probability distribution of intensity value with a single value is related to a low entropy, whereas a broad distribution corresponds to a high entropy value.
26 The joint entropy H (A, B) measures the amount of information combined from two images, and can be calculated by the joint probability distribution of the two images. The mathemati-cal description is as following:
𝐻(𝐴, 𝐵) = − ∑ 𝑝𝑖,𝑗 𝑖,𝑗𝑙𝑜𝑔 𝑝𝑖,𝑗 (3.6)
The joint probability distribution of intensity values can be calculated from the joint histo-gram by dividing each entry by the total number of entries (Pluim et al., 2003). If the images A and B are acquired from different subjects with different imaging modality, thus three is no relationship between them and the joint entropy H(A, B) is approximately the sum of the en-tropy of images A and B. Therefore, the better the registration between the images, the small-er the joint entropy value and it is smallsmall-er than the sum of the independent marginal entropy:
𝐻(𝐴, 𝐵) ≤ 𝐻(𝐴) + 𝐻(𝐵) (3.7)
In the equation of MI definition (1), we can find that MI is maximized when the joint entropy is minimized. Actually, the joint entropy is also an approach to measure the common infor-mation between two images. The problem of using joint entropy only as a similarity meas-urement is that when the entropy value is very low (theoretically corresponding to a good alignment of the input images), the result can be totally misregistered. For example, if an op-timized transformation matches the background region of the source and target images only, thus the joint histogram of this overlapped image is sharp (the intensity value of background) and results in a low entropy value.
MI can better avoid this issue by incorporating the marginal entropy. If the registration result is only matched to the background region, the mutual information is low and when the re-maining anatomy structures are also aligned it is high. This is due to the marginal entropy, which can penalize the transformation when it decreases the amount of information in the source image.
It has to be noticed that the entropy of the source image H(B) is changing during the image registration. The transformation matrix is changed at each iterative step and a new image is generated with new transformation parameters and the use of interpolation technique. H(B) and H(A,B) will then be recalculated based on this new image and result in a new value of MI at each iterative step. The registration process will be stopped while the MI value reaches the expected threshold or accuracy.
27
3.1.2 Transformation
The choice of transformation model is critical for the success of the image registration. Thus we give here a fundamental overview of the classical transformation categories for under-standing the current progress in this field. One can learn much more in deeper details from the survey on image registration in (Hill et al., 2001;Crum et al., 2014;Holden, 2008). The trans-formation model mainly can be divided into rigid, affine and deformable types.
The coordinate transformation from one image to another is called rigid when only the trans-lation and rotation are applied. The shape and dimension of the object is kept the same and only the 3D position is changing. The rigid transformation can be described by a homogene-ous constant matrix equation for the 3D to 3D mapping:
( 𝑥′ 𝑦′ 𝑧′ 1 ) = ( 𝑟11 𝑟12 𝑟13 𝑡 𝑟21 𝑟22 𝑟23 𝑡 𝑟31 𝑟32 𝑟33 𝑡 0 0 0 1 ) ( 𝑥 𝑦 𝑧 1 ) (3.8)
where the point 𝑝(𝑥, 𝑦, 𝑧) and 𝑝′(𝑥′, 𝑦′, 𝑧′) are the old and new coordinates of voxels of the image respectively, t represents translation vector and r represents a 3 × 3 rotation matrix which can be defined and decomposed in three Euler sub matrices:
𝑟𝑖𝑚 = 𝑟𝑖𝑗(1)𝑟𝑗𝑘(2)𝑟𝑘𝑚(3) , 𝑟(1) = ( 1 0 0 0 cos 𝛼1 − sin 𝛼1 0 sin 𝛼1 cos 𝛼1 ), 𝑟(2)= ( cos 𝛼2 0 sin 𝛼2 0 1 0 −sin 𝛼2 0 cos 𝛼2 ), 𝑟(3)= ( cos 𝛼3 − sin 𝛼3 0 sin 𝛼3 cos 𝛼3 0 0 0 1 )
,
where 𝑟(𝑖) denotes the point rotated around the axis i by the angle 𝛼𝑖.
If scaling and shearing operations are linearly combined with the rotation and translation, it is called affine transformation, in which the parallelism of lines in the source image will be served after mapping to the new generated image, but their angle and length will not be pre-served.
28 In contrast, a deformable transformation maps straight lines to curves and is a continuous and differentiable function which is represented as a displacement vector instead of a constant ma-trix:
𝑃′= 𝑝 + 𝑇(𝑥, 𝑦, 𝑧) (3.9)
where T is a deformable transformation which can be calculated at each specific voxel coor-dinate.
Many deformable transformation models have been proposed. Holden (2008) divided it into two main categories: physical-based models and function representation-based models. One can learn much more from the review paper (Sotiras et al., 2013) which extends this classifi-cation and gives more emphasis on the derived algorithms which are not mentioned in this chapter.
The physical-based model is coming from the theory of continuum mechanics and generally divided into two main categories: elastic models and fluid flow models. The function repre-sentation-based model is derived from the interpolation (Meijering, 2002) and the approxima-tion theories (Schumaker, 1981; Powell, 1981) and represents the transformation with a set of functions.
Elastic model
The theory of the elastic model is based on motions of stress strain (Holden, 2008). In the reg-istration procedure, the model is optimized by balancing the external force (the image similar-ity) and the internal force (the smoothness constrain) and can be represented by the Navier-Caudy partial difference equation (PDE) (Lester & Arridge, 1999):
𝜇∇2𝑢(𝑥) + (𝜇 + 𝛾)∇(∇ ∙ 𝑢(𝑥)) + 𝑓(𝑥) = 0 (3.10)
where 𝑢(𝑥) is the displacement vector at point x, 𝜇 and 𝛾 are Lamé constants, and f(x) de-notes the external force per unit volume and drives the registration.
Broit (1981) firstly introduced the linear elastic model into the image registration area, with an external force f deforming the image and an internal stress μ imposing the elastic property, the registration is completed when an equilibrium is reached between two opposite forces. This PDE is solved iteratively with the use of a finite difference approach.
29
Bajcsy et al. (1983) improved this approach by using a priori affine transformation to correct the global difference. Then a multi-resolution scheme was adopted on the Broit (1981) model. The big limitation of the linear elastic model transformation described by the Navier-Caudy PDE (2) is the inability to deal with large deformation (Holden, 2008). A viscous fluid model was thus proposed by (Christensen et al., 1994;Christensen et al., 1996;Christensen et al., 1997) to tackle this issue.
The “demons” registration algorithm was proposed by Thirion (1998) based on the optical flow model (Horn & Schunck, 1981). The limitation of this model is that it lacks displace-ment constraints and does not preserve the topology. Some improved algorithms have been proposed to solve this issue (Pennec et al., 1999). The drawback of this family of algorithms is that they are usually combined with SSD as similarity measure which is only suitable for the mono-modal image registration.
Function representation-based transformation model
Function representation-based model derives from either the interpolation theory or the ap-proximation theory. The principle of interpolation theory is that the remaining displacement space can be interpolated from the known values of feature points. The approximation theory considers there is an error in the sample deformation field, thus the transformation should ap-proximate the displacement and result in a smoother deformation than its interpolation coun-terpart.
The most important transformation model in this category is the family of thin plate spline (TPS) which has been used for more than 15 years (Crum et al., 2014). TPS is a type of radial basis functions which have the property of interpolating a deformation field from irregular known values. The fundamental principle of TPS model is to use a control point grid to de-form the shape of an object. The resulting dede-formation controls the shape of the whole region of interest and produces a smooth and continuous transformation. Each control point of the TPS has a global influence on the final transformation, which means that if the position of one point varies, it will result in all other points to change. Thus, it is difficult for the TPS to mod-el a localized deformation.
B-spline-based transformation model inherits the advantage of TPS and avoids its limitation so that each control point only affects the neighbourhood points. This local support ability
30 makes it widely adopted for many registrations, notably for the brain (Holden et al., 2002), the heart (Frangi et al., 2002), the chest (Mattes et al., 2003;McLeish et al., 2002), the lung (Z. Wu et al., 2008;Delmon et al., 2013), the liver (Torsten Rohlfing et al., 2004), the breast (Schnabel et al., 2001;Tanner et al., 2002) etc. The property of the B-spline can be described as following.
Let Ω denote the volume size of image data in 3D:
Ω = {(x, y, z)|0 ⩽ x < X, 0 ⩽ y < Y, 0 ⩽ z < Z} (3.11) where (x, y, z) represents the 3D coordinates of any point of the image data.
Then let Φ denote a nx× ny× nz mesh of control points ϕi,j,k with uniform spacing
(δx, δy, δz) in each direction. Finally, for any voxel (x, y, z) of volume data, its deformation can be defined as the 3-D tensor product of 1-D cubic B-splines:
𝛵𝑙𝑜𝑐𝑎𝑙(𝑥, 𝑦, 𝑧) = ∑𝑙=03 ∑3𝑚=0∑𝑛=03 𝐵𝑙(𝑢)𝐵𝑚(𝑣)𝐵𝑛(𝑤)𝜙𝑖+𝑙,𝑗+𝑚,𝑘+𝑛 (3.12) where i = |x δx| − 1 , j = | y δy| − 1 , k = | z
δz| − 1 and denote the cell containing the (x,y,z),
u = x
δx− (i + 1),v =
y
δy− (j + 1),w =
z
δz− (k + 1). Bl represents the l-th basic function of
the B-spline (S. Lee et al., 1996):
B0(t) = (−t3+ 3t2− 3t + 1) 6,⁄
B1(t) = (3t3− 6t2+ 4) 6,⁄
B2(t) = (−3t3+ 3t2 + 3t + 1) 6,⁄
B3(t) = t3⁄6
(3.13)
From the above formula, we can conclude that B-splines are locally controlled, which makes them computationally efficient even for a large number of control points. In other words, changing coefficients of any control pointϕi,j,k, will affect only the neighbourhood controls
points 4 × 4 × 4
3.1.3 Optimization
The optimization, in general, is an iterative progress of finding the “best parameters” of the transformation model, in order to maximize the similarity measurement. At each iterative step, the new similarity measurement is calculated based on the new estimated transformation (with updated parameters), then the optimization algorithm searches for a transformation in
31 the parameter space determined by the specific search strategy and generate a new corre-sponding similarity measurement. The algorithm continues until the similarity measurement reaches a threshold or the maximum number of iterations manually defined before the regis-tration.
One issue of the optimization algorithms is that they can converge to an incorrect point like a local optimum. This is caused by the fact that there are multiple optima in the parameter space and the registration will fail if the optimization converges to the wrong optimum. Some local optima are very small, caused by a local good alignment between input images or by interpo-lation artifacts (Hill et al., 2001). These small optima can be removed by an image blurring operation as a pre-processing step. In addition, a multi-resolution scheme can also be adopted, in which the image registration is firstly performed at a coarse low resolution level obtained by a sampling operation, then the obtained transformation parameters will be used to initialize at a finer registration level, and so on. This can facilitate the optimization algorithm, effective-ly avoid dropping into local optima and improve the speed of the algorithm convergence at each resolution level.
3.2 Image registration on the abdominal viscera region
The image registration of abdominal viscera is a challenging task, due to the deformation of organs, inherent motion of the abdominal organs, as well as the sliding motion between ab-dominal viscera and abab-dominal wall. There has been much registration work presented to reg-ister organs or vessels in the abdominal viscera.
Surface-based rigid registration approaches have been proposed for the registration of livers. For instance, Herline et al., 2000 performed a surface-based registration using the iterative closest point (ICP) algorithm of Besl and McKay (1992) on liver phantoms with embedded tumors. An initial point-based marker registration is carried out and used as a “gold standard”. This experiment investigated the spatial relationship between liver and tumor in phantom im-ages, which cannot mimic the actual deformation and motion.
Surface-based non-rigid registration has also been studied. Kaus et al., 2007 proposed a mod-el-based deformable registration with surface meshes extracted from abdo-thorax MR images (such as the lung, liver, kidney and pelvic). A point-based deformable registration is then per-formed on the vertices of target and source images. The obtained deformation field between mesh surfaces is then extended to the volume using an interpolation method (thin plate spline,