HAL Id: inserm-00874380
https://www.hal.inserm.fr/inserm-00874380
Submitted on 17 Oct 2013
HAL is a multi-disciplinary open access archive for the deposit and dissemination of sci-entific research documents, whether they are pub-lished or not. The documents may come from teaching and research institutions in France or
L’archive ouverte pluridisciplinaire HAL, est destinée au dépôt et à la diffusion de documents scientifiques de niveau recherche, publiés ou non, émanant des établissements d’enseignement et de recherche français ou étrangers, des laboratoires
Local landmark alignment for high-resolution fMRI
group studies: toward a fine cortical investigation of
hand movements in human.
Fabrizio Pizzagalli, Guillaume Auzias, Chantal Delon-Martin, Michel Dojat
To cite this version:
Fabrizio Pizzagalli, Guillaume Auzias, Chantal Delon-Martin, Michel Dojat. Local landmark alignment for high-resolution fMRI group studies: toward a fine cortical investigation of hand movements in human.. Journal of Neuroscience Methods, Elsevier, 2013, 218 (1), pp.83-95. �10.1016/j.jneumeth.2013.05.005�. �inserm-00874380�
Local landmark alignment for high-resolution fMRI
group studies : toward a fine cortical investigation of
hand movements in human
F. Pizzagallia,b, G. Auziasc, C. Delon-Martina,b, M. Dojata,b,∗
aINSERM U836 (GIN), Grenoble, F-38700, France bUniversit´e Joseph Fourier, Grenoble, France cLSIS Lab, UMR CNRS 6168, Marseille, F-13000, France
Abstract
Converging evidence conclusively demonstrates the robust relationship bet-ween anatomical landmarks and underlying functional organization in pri-mary cortical regions. In consequence, a precise alignment across subjects of such specific individual landmarks should improve the overlap of the cor-responding functional areas and thus the detection of active clusters at the group level. In an effort to define a dedicated processing pipeline for a fine non-invasive exploration of the motor cortex in human, we evaluated four recent non-linear registration methods based on anatomical and functional indexes. We used high-resolution functional MRI data to finely reveal the impact of the registration on the cortical assignment of the detected clus-ters. Our results first demonstrate that the quality of registration strongly affects the statistical significance and the assignment of activated clusters to specific anatomical regions, here in the primary motor area. Our results also illustrate the bias induced by the chosen reference template on the de-tected clusters. The analysis of the jacobian of the deformation field informs us about how each method deforms the anatomical structures and functio-nal maps.The methodology we propose, combining high resolution fMRI and non-linear registration method, allows a robust non-invasive exploration of the motor cortex.
∗. Corresponding author at : Grenoble Institut des Neurosciences, INSERM U836, Batiment Edmond J Safra, Chemin Fortun´e Ferrini, 38700 La Tronche, FR. Tel : +33 456520601 Fax : +33 452560599. E-mail address : [email protected] (M. Do-jat).
Keywords: Realignment, Diffeomorphic Registration, Functional MRI, Structural MRI, Jacobian, Sulci, Brain.
Highlights
• We propose the combination of high-resolution fMRI with non-linear registration technique involving explicit anatomical constraint for indi-vidual cortex region alignment.
• Precise local anatomical landmark alignment improves functional clus-ter detection and localization at group level.
• The quality of the registration obtained is assessed by both structural and functional indexes.
1. Introduction
Group analysis of neuroimaging data requires registering anatomical and functional individual data in a common space. This spatial registration should ensure a precise alignment of individual cortical gray matter ribbons and ideally of underlying functional areas. For primary cortical regions, conver-ging evidence conclusively demonstrates the robust relationship between ana-tomical landmarks and underlying functional organization (Fischl et al., 2008). In consequence when such a relationship exists, a precise alignment across subjects of individual anatomical landmarks should improve the over-lap of the corresponding functional areas and thus the detection of active clusters at the group level. In this paper, we consider the primary motor cortex M1 that exhibits a clear relationship with a constant anatomical land-mark, the central sulcus (Fischl et al., 2008). We investigate whether a fine alignment of individual central sulcus improves functional alignment at the group level. An important part of M1 is devoted to the control of hand mo-vements. Our current knowledge of the hand movement control relies mainly on electrophysiological recordings in monkeys (Humphrey, 1986; Kakei et al., 1999; Rathelot and Strick, 2006) and in humans, on pre-surgical investiga-tions (Penfield, 1935) or post mortem cytoarchitectonic studies (Geyer et al., 1996). Indeed, human M1 appears to be grossly somatotopic but its fine functional organization remains poorly known (Geyer et al., 1996; Sanes and Schieber, 2001). Neuroimaging appears as the ideal non-invasive tool to pro-gress in our understanding of the cortical representation of hand movement in humans. However, all non-invasive functional studies of human M1 pro-posed to date have been limited by the considerable inter-subject variability
in subject’s response, degree of somatotopy and the exact localization of their motor maps (Kleinschmidt et al., 1997; Meier et al., 2008). In healthy subjects, different fMRI studies of the cortical representation of fingers revea-led highly overlapping maps, together with an arrangement of finger-specific hot spots that follows a somatotopic organization (Sanes et al., 1995; Rao et al., 1995; Kleinschmidt et al., 1997; Indovina and Sanes, 2001; Beisteiner et al., 2001; Dechent and Frahm, 2003). More recently, Meier and collabo-rators (Meier et al., 2008) found an overlapping somatotopy in human for which the representations of the different body parts are intermingled, and a complex organization for the arm and hand, with fingers emphasized in a core region surrounded by a dorsal and ventral representation of the arm. In the same line, Strother et al. reported a double representation of the wrist and elbow (Strother et al., 2012). Our goal with the present study was to define a specific image processing pipeline to investigate finely hand cortical movement organization in M1 in healthy and pathological subjects.
Structurally, the primary motor M1 and somatosensory S1 cortices lie on the two banks of the Central Sulcus (CS), respectively anteriorly and poste-riorly. The segment of the precentral gyrus shaped like an inverted omega or epsilon in the axial plane and like a hook in the sagittal plane, is a reliable landmark for identifying the precentral gyrus under normal and pathological conditions. It is generally referred as the hand-knob structure and is a good predictor of the hand representation in M1 at the individual level (Yousry et al., 1997). However, it presents a considerable variability in shape and dorso-ventral position along the CS between subjects (Caulo et al., 2007; Sun et al., 2011). Functionally, the investigation of M1 with functional Ma-gnetic Resonance Imaging (fMRI) is limited by two factors :
1. insufficient spatial resolution of fMRI. At acquisition, the typical spatial resolution (3x3x3 mm3) leads to a mixing of functional BOLD responses within M1 subregions and between M1 and somatosensory cortex S1. 2. poor cross-participant alignment of hand motor area. This leads to the
underestimation or the failure to detect functional activation in M1. Moreover, spatial alignment and spatial filtering, performed prior to statistical analysis to reinforce the overlap between individual areas, introduce per se the functional blurring and the loss of a precise loca-lization of fMRI signals. This clearly impedes the separation of poten-tially distinct activated clusters found in M1.
indivi-dual hand-knobs from structural MR images with high resolution functional MR images, insuring the mapping of each functional voxel to a single gy-rus location, could improve at the population level functional areas overlap, increasing the significance of statistical parametric maps.
Given the high tortuosity of the cortical ribbon, Hyde and coworkers (Hyde et al., 2001) found that an isotropic spatial resolution of 1.5 mm was optimal to detect robust cortical activation following a finger-tapping para-digm. This spatial resolution can be achieved by decreasing plane thickness and increasing the in-plane acquisition matrix using multi-shot EPI sequences while restricting the acquired volume to encompass the motor area. For spa-tial alignment, it is well established that linear registration is inadequate for aligning cortical structures such as sulci. Several studies have compared non-linear brain image registration algorithms working on the whole brain (Hellier et al., 2003; Klein et al., 2009), on specific regions (Yassa and Stark, 2009), or using volume versus surface-based approaches (Klein et al., 2010). In all these studies a set of quantitative measures was used to compare the defor-med structural MR source images to the target. The effects of the registration on brain activation detection were investigated, to the best of our knowledge, mainly in auditory cortex (Viceic et al., 2009; Tahmasebi et al., 2009, 2012). In this paper, in the context of motor cortex studies, we explore the effects of non-linear registration methods on the detection of statistically signifi-cant activated clusters and on their localization. The use of high-resolution functional MR images allow to finely explore the impact of the registration on the cortical assignment of the detected clusters. We selected four recent registration methods as representative of the current state-of-the-art.
First, we considered DARTEL (Ashburner, 2007) as representative of standard diffeomorphic methods where the deformation constraints, estima-ted globally on the whole brain scan, align the cortical valleys and crests but without guarantee that sulci of identical anatomical denomination would be properly aligned altogether. Then, we considered DISCO+DARTEL (Auzias et al., 2011) as representative of a class of methods where explicit sulcal landmarks are used to constraint the 3D deformation. Finally, we conside-red Diffeomorphic Demons (Vercauteren et al., 2009) as representative of diffeomorphic methods where deformations can be estimated locally to align predefined three-dimensional region of interests (ROIs), here surrounding the hand-knob region. Data were also processed using the SPM8 normalization
procedure1 widely used in the neuroscience community. To assess the accu-racy of anatomical and functional alignments provided by each registration method we considered complementary measures and a quantitative analysis of the deformation field computed and applied to high resolution functional datasets coming from thirteen healthy control subjects.
Our results demonstrate the clear improvement provided by registration methods, DARTEL and DISCO+DARTEL, allowing large-but-controlled de-formations on the quality of inter-individual brain structure alignment and on the detection and localization of activated clusters in M1 area at the population level.
2. Material and Methods 2.1. Data Acquisition
Thirteen right-handed healthy subjects (mean 27.5 y.o.), as assessed by the Edinburgh inventory (Oldfield, 1971), without past or current brain di-sease and no detected cognitive deficit were involved in this study. All sub-jects gave written informed consent to participate in the study, which was ap-proved by our institutional review board. We acquired high-resolution struc-tural images (1×1×1 mm3) on a Bruker 3T Medspec S300 whole body scan-ner equipped with a birdcage head coil using a T1-weighted 3D MP-RAGE optimized sequence (Deichmann et al., 2000). For each subject we acquired 176 sagittal partitions in two segments with an image matrix of 256x112 (read x phase). Further imaging sequence parameters were : TR/TE/TI : 16/4.96/903 ms, excitation pulse angle : 8 deg., acquisition matrix : 176x224x256 (x, y, z), fast phase encoding in antero-posterior direction (112 steps per RAGE train, 2 segments), slow phase encoding in left-right direction, isotro-pic nominal resolution = 1mm, BW = 130Hz/pixel, readout in caudo-cranial direction, number of averages = 1 and total measurement time = 14min 40s. BOLD functional images were acquired with the high spatial resolution of 1.5×1.5×1.5 mm3 using a 4 shot EPI sequence (per shot : TR/TE : 1500/30 ms, flip angle : 77 deg, acquisition matrix : 72x16 ; 2 stacks of 15 adjacent contiguous slices of thickness 1.5 mm, the first stack encompassing the hand portion of the primary motor cortex and the second one the upper part of the cerebellum). The total k-space matrix (72x64) was divided in 4 parts,
one per shot. For each shot a quarter of each slice was acquired (72x16). The following slice order was used : 1st slice of stack 1, 1st slice of stack 2, 2nd slice of stack 1, 2nd slice of stack 2,.... Thus, each slice was sampled at four different time points 1.5 sec apart, providing a temporal resolution of 6 sec. Functional data acquired in the cerebellum region are out of the scope of the present paper.
2.2. fMRI experiments
Because of the high complexity of the motor command, we chose to study simple basic movements, namely repetitive flexion and repetitive extension, performed separately with either the thumb or the fingers or the wrist during a simple block-design fMRI protocol. These tasks were performed unilaterally with the dominant (right) and with the non-dominant (left) hand. The total number of basic movements equals 12 (2 movement directions x 3 hand parts x 2 hands). For each basic movement, subjects were instructed to perform an alternation of a self-paced ’movement and relax’ during each activation block duration. The movements were registered for each subject using a set of flexible sensors of flexion/extension (Flexpoint Sensor Systems, Inc., Utah) fixed on 4 joints of each hand with Hypafixr, to insure a close contact between the sensors and the skin. Additionally, this fixation method exerts a restoring force that helps the hand joints to passively return to their initial position during the relaxing time following each flexion or extension. Flexion and extension signals were recorded online at a frequency of 200 Hz using the LabView software package (National Instrumentsr) and displayed on a screen in the acquisition room throughout the experiment, so that the tasks could be controlled in real-time by the experimenters.
Each subject underwent a block-design fMRI protocol. In order not to mix all the twelve movements (2 directions x 3 hand parts x 2 hands), we presented the stimuli in four different functional runs for respectively flexion or extension with the right hand or the left hand. The order was randomized among the subjects. Each run begins with the presentation of the type of stimuli (for instance : ’Right hand flexion’), then 12s-rest and 18s-activation blocks alternated and this cycle was repeated 9 times. Three activation blocks were performed respectively with each hand part, thumb, fingers and wrist, in a pseudorandom order to avoid possible motor preparation. Prior to their installation within the MR scanner, the subjects were trained to ensure that the tasks were properly executed. This short training period avoided any lear-ning effect. We used the Presentationr software (Neurobehavorial Systems,
Inc.) to display instructions back-projected using a video-projector (Epson 7250M, Epson Inc., Long Beach, CA) on a translucent screen positioned at the rear of the magnet. Subjects viewed this screen via a mirror fixed on the head coil.
2.3. Structural image processing
Individual structural images were firstly segmented and debiased using unified segmentation approach as implemented in SPM82 (Ashburner and Friston, 2005) in considering two brain tissues (GM and WM) and four non brain tissues (CSF, large veins, scalp and meningia). We also used the Brain-VISA3 segmentation pipeline to automatically extract and identify the corti-cal sulci and in particular the CS in each individual brain. Then, the volumes were registered between subjects following four different strategies and soft-ware using their own default parameters values as briefly described hereafter : 1/ SPM8, 2/ DARTEL, 3/ DISCO+DARTEL (DiDa) and 4/ Diffeomorphic Demons (DDe). Each strategy provides a subject-related deformation field applied to functional data (see 2.4).
2.3.1. SPM8
SPM8 registration (spatial normalization) is embedded within a probabi-listic framework that combined image registration, tissue classification and bias field correction (Ashburner and Friston, 2005). Tissue probability maps are used to assist the classification. This allows registration to a standard space to be included within the same generative model. The priors used re-present a modified version of the ICBM tissue probabilistic atlas. Estimating the model parameters alternates among classification, bias correction, and registration steps. The non-linear registration part uses a low-dimensional approach (compared to DARTEL), which parameterizes the deformations by a linear combination of about a thousand cosines transform bases. We used the MNI template as the target for registration.
2.3.2. DARTEL
DARTEL (Ashburner, 2007) registration optimizes the overlap of gray and white matter tissue masks between subjects through a large deformation method where deformations are parametrized based on a stationary velocity
2. (’New Segment’ SPM function) 3. http ://www.brainvisa.info
field. To avoid the bias related to the arbitrary selection of a single brain as a registration template, the algorithm embeds the construction of an average image template. It iterates to register all images to their average template and compute a new average template at each step. The initial smooth template becomes gradually sharper each time it is re-computed, resulting in an itera-tive coarse-to-fine registration scheme. The method has been already applied in different voxel-based morphometry studies with good performances.
2.3.3. DISCO+DARTEL (DiDa)
The DIffeomorphic Sulcal-based COrtical (DISCO) registration explicitly forces the alignment of sulci in an iterative approach. Individual sulci are first segmented and modeled as weighted sets of points. An empirical template is defined as the union of the entire set of sulcal points through the group of subjects. For each sulcal label, the corresponding sulcal landmark in the template corresponds to the union of all points associated to this label for each subject. Diffeomorphic transformation of each individual data onto the empirical template is then proceeded in the general framework of the Large Deformation Diffeomorphic Metric Mapping theory. Improved mask overlap and reduction of sulcal dispersion can be reached through the sequential combination of DISCO and DARTEL (DiDa), with DARTEL being initiali-zed using DISCOs outcome (Auzias et al., 2011). In this study, because we were interested in cortical activations located in pre- and post-central gyri, only the central sulcus was considered. For this very stable sulcus, automatic detection of misidentification as presented in (Auzias et al., 2011) did not detect any error. Neither manual nor automatic correction was applied for possible central sulcal misalignments. The deformations resulting from the different methods were applied to the same sulci that served as constraint in DISCO and DISCO+DARTEL.
2.3.4. Diffeomorphic demons (DDe)
Diffeomorphic Demons is an efficient algorithm for the non-parametric registration of multiple dimensional images based on the sum of squared dif-ference in voxels intensity between images implemented in MedINRIA tool-box4 (Vercauteren et al., 2009). It adapts the optimization procedure on the entire space of displacement fields proposed in (Thirion, 1998) to the space
of diffeomorphic transformations. Similarly to DARTEL, DDe relies on a stationary velocity vector field but the objective function to be minimized and the optimization strategy are different. This method has been shown outperforming other methods when applied locally in an ROI in the medial temporal lobe (Yassa and Stark, 2009). In the present work, we applied DDe in a common ROI in the motor cortex region constructed as follows. We first isolated the voxels corresponding to the central sulcus of each subject using BrainVISA. We then linearly registered using SPM8 these voxels in a common referential, the MNI space. We manually defined individual ROIs surrounding the primary somato-sensory cortical area and encompassing the hand-knob structure on each individual structural image registered in the MNI space. We computed a common ROI as the union of all individual ROIs followed by morphological operations of closing and dilatation. This proce-dure was repeated for each hemisphere and resulted in two ROIs per subject (one per hemisphere). Using individual (inverse) transformation parameters, the two common ROIs were then put back in each individual referential. DDe was then applied to realign each individual ROI to a chosen reference sub-ject. To assess the influence of the reference image on the alignment quality, we used two references, R1 (DDe-R1) and R2 (DDe-R2).
2.4. Functional image processing
For each subject, the functional images were corrected for motion and re-gistered to the corresponding structural image (rigid transformation) using SMP8. Individual data analysis was performed in the subject’s referential using a classical General Linear Model with a regressor for each condition of interest (flexion or extension with fingers, thumb or wrist for each hand) and six motion parameters as regressors of non-interest, convolved with the cano-nical hemodynamic response function. Individual statistical contrast images were computed and then, using each registration strategy, registered to the common referential by applying the corresponding deformation field. A slight spatial smoothing was applied using a gaussian kernel with a FWHM equal to the size of the spatial resolution of the functional images (1.5×1.5×1.5 mm3) in order to fit to the gaussian field hypothesis. Random effects statisti-cal group analysis was further performed and T-maps for each task and each registration method were computed.
2.5. Assessment of registration performances
The performances of the four registration methods were evaluated based on the computation of indexes that quantitatively assess both inter-individual anatomical and functional alignments. For the former, we considered both the gray-matter overlap between subjects in computing the Jaccard overlap distance, and the dispersion of the CSs in computing the Hausdorff distance. The Jacobian was also calculated to assess the regularity of the correspon-ding deformation field. For the functional alignment, we reasoned that if it is improved by a registration method then more significant voxels should be detected and correctly positioned in the M1 cortex. In order to focus on our region of interest, the motor region, and allow for the comparison between glo-bal (DARTEL, DISCO+DARTEL and SPM8) and local (DDe) approaches, we restricted the analysis of registration performances to the common ROI defined for DDe.
2.5.1. Assessment of accuracy of anatomical alignment
For each method, we applied the computed deformation field to the in-dividual gray matter images and to the inin-dividual structural images. We computed for each pair of subjects (S1, S2) :
1. The fuzzy Jaccard measure, JO, quantifies the overlap between the grey matter probability maps across two subjects (Auzias et al., 2011; Crum et al., 2005). It is computed based on the grey matter probability value GMi for each voxel i as follows :
J O(S1, S2) = P voxels,imin(GM 1 i, GMi2) P voxels,imax(GM 1 i, GMi2)
where GM1 and GM2 are the gray matter maps for S1 and S2 respec-tively in the common ROI.
2. the Hausdorff distance, H, between the CS. H is an indicator of the spa-tial dispersion between two datasets. It can be obtained by generating the set of distances from each point in one set to the nearest point in the other set (minimal value), and then taking the largest of all these distances (maximal value). This is computed for each set in turn and lastly the largest distance is kept. Here, each point i and j refers respec-tively to the voxels corresponding to the sulci (CS) of subjects S1 and S2. The number of points for S1 and S2 can be different. This measure
is in our context an indicator of the spatial dispersion of the central sulci after alignment.
H(S1, S2) = max(max i minj (||CS 1 i − CS 2 j||), maxj mini (||CS 1 j − CS 2 i||))
The higher J O value and the lower H value, the better the accuracy of the registration method is.
3. Jacobian computation
The deformation field produced reflects the quality of the registra-tion method (Leow et al., 2007). Indeed, two registraregistra-tion methods can achieve similar GM overlaps but with a different amount of dilatations and compressions. Unnecessary tissue stretching or compression should be avoided. A method that generates few deformations while providing an accurate alignment is always preferable. The Jacobian of the de-formation field was computed to assess the regularity of the field and the amount of dilatation or compression for each voxel of the common ROI for the three diffeomorphic methods and for each subject. The Jacobian computation was straightforward for DARTEL and DDe me-thods. As DiDa is a sequential combination of DISCO and DARTEL we computed the following Jacobian measure for each voxel v,
J acobianDI+DA(v) = J acobianDISCO(v) ∗ J acobianDART EL(v)
The spatial distribution of high compression and high dilatation rates in the ROI and among subjects illustrates the regularity of the field a posteriori and how the corresponding registration method has deformed the anatomical structures.
2.5.2. Assessment of accuracy of functional alignment
Because no ground truth is available to compare the statistical para-metric maps obtained using each registration method, we considered separately two aspects at the population level : the activation detecta-bility (t-values) and the localization of activation. For each registration method we computed, for each task and each hand, the number of detected voxels above a predefined threshold. Based on our hypothe-sis that precise inter-subject central sulci alignment results in precise
alignment of corresponding activated functional regions, the more pre-cise the registration, the higher the number of statistical significant activated voxels is. We further tested whether the four methods had si-gnificant effect on activation detectability whatever the task. We com-puted using Statistica 8 (StatSoft c ), a 2-way (method, hemisphere) repeated-measure ANOVA with the total number of detected voxels as measures. A post-hoc Tukey-Kramer test was further computed to as-sess which methods performed significantly better in terms of activation detectability. For localization, we superposed the significantly activa-ted voxels onto the corresponding mean structural image. The major part of activation should be precisely located in M1. Additionally, we quantified the spread of individual subject peak activity coordinates by identifying before registration a cluster (size ≥5 voxels) statistically significant and visually localized at a similar position in each indivi-dual for each task and hand. After registration using SPM8, DARTEL and DiDa, we computed a dispersion index, for each task and hand, as the Euclidean distance between each individual peak coordinates and their centroid (mean coordinate). We computed a 2-way (method, task) repeated-measure ANOVA with Euclidean distances as measures and a post- hoc Tukey-Kramer test was calculated assessing which me-thods performed significantly better in terms of dispersion reduction. The rationale is that better the registration, lower the final dispersion is.
3. Results
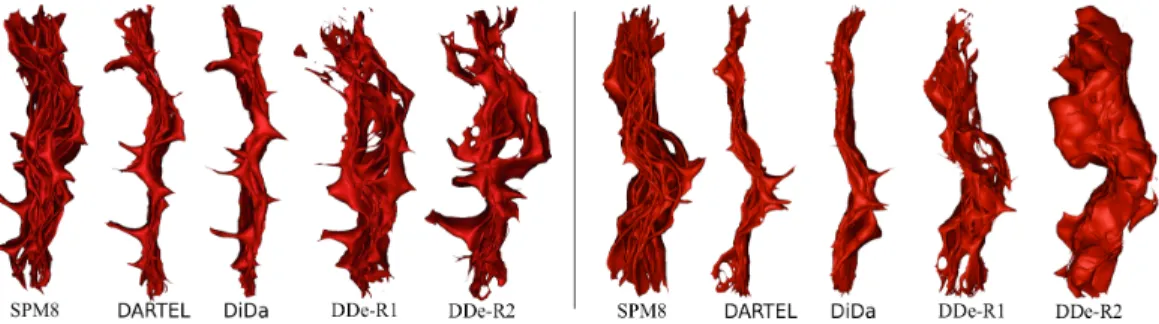
The common ROI considered for the analysis is superposed in red on one individual structural image in Figure 1. Figure 1 shows for a given subject (upper row) the deformed ROI after application of each regis-tration method. The mean structural, restricted to the common ROI, obtained after registration of the 13 subjects using each method is dis-played (lower row). The blurring obtained using SPM8 clearly indicates a poor realignment. Non-linear deformations introduced in SPM8 are clearly too limited to reach a satisfying registration of all brains for the considered population. The mean deformed ROI is sharper for the three diffeomorphic methods. For DDe, the mean shape is very close to the chosen reference image (not shown). Figure 2 displays the set of 13 deformed central sulci after registration. It illustrates how the
four methods deform locally the individual left and right CS. Note the persistent large dispersion of sulci after realignment with SPM8 and DDe. As expected, we note the strong influence of the reference used with DDe (see DDE-R1 vs DDe-R2).
Figure 1: Hand-knob region. Left : The common ROI (see text 2.3.3) surrounding the hand-knob is delineated by the red contour on each hemisphere of one subject. The top row shows for this subject, the ROI for each hemisphere after deformation with each registration method. On the bottom row : the mean image restricted to the common ROI after registration of the 13 subjects for each hemisphere and each method. L = left, R = right.
Figure 2: The deformed left (left) and right (right) sulci (13 subjects) after realignment by each method.
3.1. Anatomical alignment accuracy
3.1.1. Jaccard overlap and Hausdorff distance
Figure 3 shows the distribution across all pairs of subjects of the fuzzy Jaccard overlap for gray matter within the ROI and Hausdorff distance between CS. These quantitative measures confirm a clear improvement of the gray matter overlap when using diffeomorphic methods com-pared to SPM8. Both DARTEL and DiDa methods provided a low
Hausdorff mean distance and a good overlap of the GM around the hand-knob. Concerning Demons, in spite of the obtention of a relati-vely high overlap score and the apparent preservation of the hand-knob structure shape, as showed on the mean images (Figure 1), the Haus-dorff distances across CS remain relatively high compared to DARTEL and DiDa. We noted for some subjects (6) a local matching between central sulcus and precentral or postcentral sulci. This suggests that a local minimum in the energy term was achieved as a consequence of the large deformations tolerance without inserting explicit anatomical constraints. These quantitative measures also confirm the influence of the chosen reference on the accuracy of the method.
Figure 3: Boxplot of Hausdorff distances (upper row) and fuzzy Jaccard overlap for gray matter (bottom row) obtained for the four methods. Left column : left hemisphere, Right column : right hemisphere.
3.1.2. Deformation fields for diffeomorphic methods
Figure 4a illustrates the consistency of the spatial deformations across the subjects. For each voxel in the common ROI, we counted the num-ber of subjects sustaining relatively large compression (J<0.6) or large expansion (J>1.4). Figure 4b depicts the histogram of the Jacobian values across all voxels in the common ROI for the 13 subjects and for each hemisphere.
All Jacobian values are positive, a necessary condition for a transfor-mation to be diffeomorphic. However, their distribution varies signifi-cantly depending on the method. The histograms and spatial distribu-tion maps show clearly that DDe generates very strong deformadistribu-tions (especially compressions) distributed through the entire ROI. This is an expected outcome of the previously observed mismatch between the central sulcus and pre- and post-central sulci. Compared to DARTEL, more voxels sustained a deformation with DiDa, with similar compres-sions and more dilatations.
3.2. Functional alignment accuracy
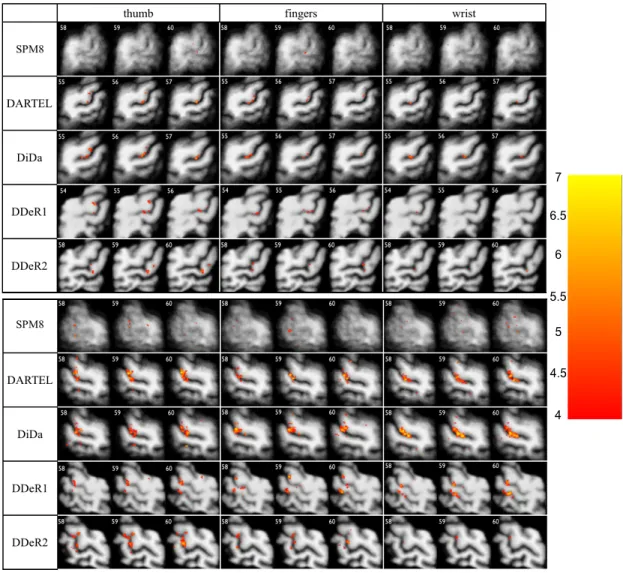
Figures 5 and 6 illustrate the localization of the main activated clus-ters derived from group analysis for extension and flexion respectively (p≤0.0001, voxel level uncorrected with no thresholding on cluster size), superimposed on the corresponding mean structural image computed for each method and restricted to the common ROI. With SPM8, ac-tivated spots cannot be identified as belonging to M1 or S1 because of the poor alignment. With DARTEL and DiDa, in all conditions, we could easily identify several spots along the hand-knob region which are coherent with the current knowledge about cortical representation of hand movement (Meier et al., 2008). Results provided by DDe-R1 seem coherent with the literature for the left hand (see especially the Figure 5) but incoherent for the right hand where activation foci are clearly found both along central and mostly along postcentral sulci. The activation pattern obtained with DDe (Figures 5 and 6) is highly dependent on the chosen reference (DDeR1 versus DDeR2).
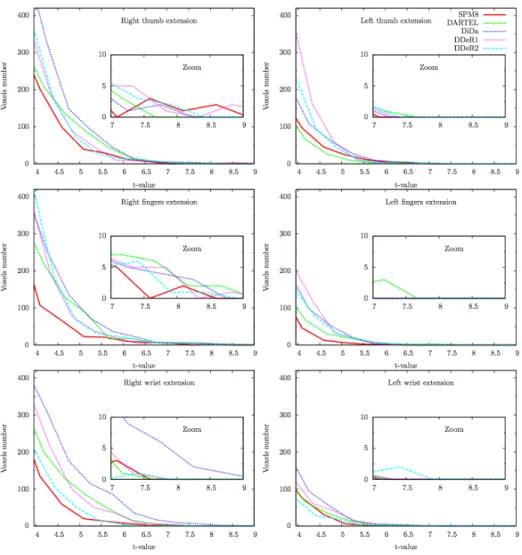
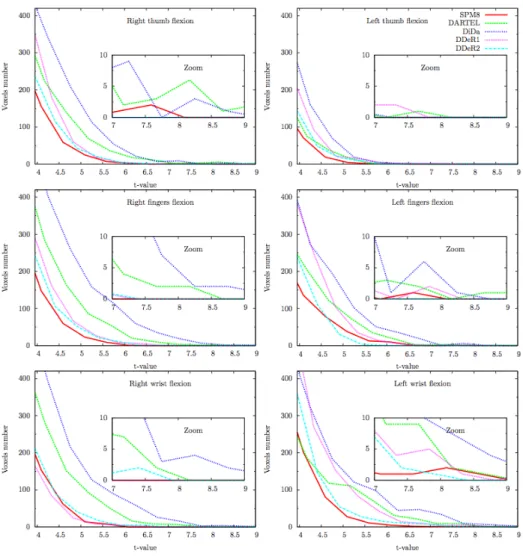
Figures 7 and 8 compare the histograms of the T-value maps for exten-sion and flexion respectively for each task and each hemisphere. These histograms confirm that the good alignment of CS obtained with DiDa and to a less extent with DARTEL is associated with a higher number of activated voxels compared to SPM8 and DDe.
Jointly with the bad registration of CSs, DDe provides low T-values for the left and right hand flexion in spite of a relatively good overlap of gray-matter in the left hemisphere (Figure 3). The bias induced by the choice of the reference subject between DDe-R1 and DDe-R2 appears clearly.
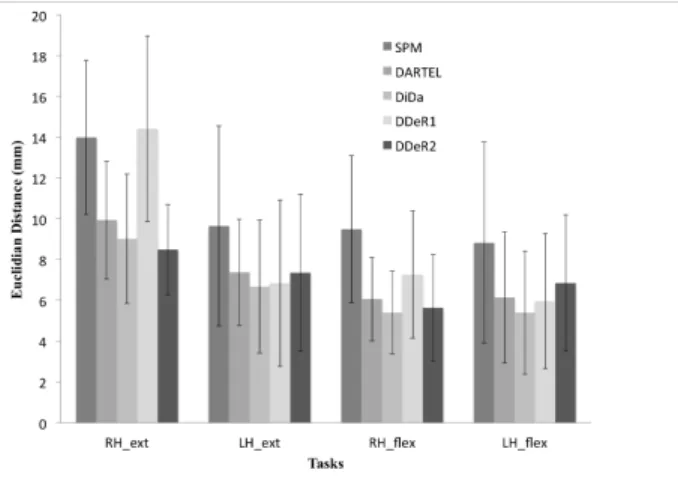
Figure 9 clearly shows the reduction of the spread of individual subject peak activity with DARTEL and DiDa compared to SPM8. There is a
Figure 4: Deformation fields for diffeomorphic methods. (a) The spatial distribution maps of the deformations across the subjects. They report for each voxel of the common ROI the number of subjects sustaining high compressions (J<0.6, top) and high dilatations (J>1.4, bottom) following DARTEL, DiDa, DDeR1 and DDeR2 registration. These values are superimposed on the corresponding mean structural image computed for each method and restricted to the common ROI. (b) Histograms of Jacobian values across every voxel in the common ROI and across all the subjects for the left hemisphere (left) and right hemisphere (right).
Figure 5: Activation maps obtained for extension tasks for left hand (top, right hemis-phere) and right hand (bottom, left hemishemis-phere) for each method. Three contiguous trans-verse slices are displayed to show the largest clusters around the right (resp. left) central sulcus for each method. Maps are superimposed on the corresponding mean structural image computed for each method and restricted to the common ROI. t≥4.0, p≤0.0001 voxel level uncorrected with no thresholding on the cluster size.
Figure 6: Activation maps obtained for flexion tasks for left hand (top, right hemisphere) and right hand (bottom, left hemisphere) for each method. Three contiguous transverse slices are displayed to show the largest clusters around the right (resp. left) central sulcus for each method. Maps are superimposed on the corresponding mean structural image computed for each method and restricted to the common ROI. t≥4.0, p≤0.0001 voxel level uncorrected with no thresholding on the cluster size.
Figure 7: Influence of registration techniques on group-averaged functional maps
for extension. The zoomed part emphasizes T-values greater than 7 (p≤ 10−5). Right hemisphere (right column) and left hemisphere (left column).
highly significant effect of the method on the dispersion (F2,10= 12) and a highly significant difference between SPM8 and DARTEL ( p≤0.001) or DiDa (p≤0.0003). No difference was significant between DARTEL and DiDa.
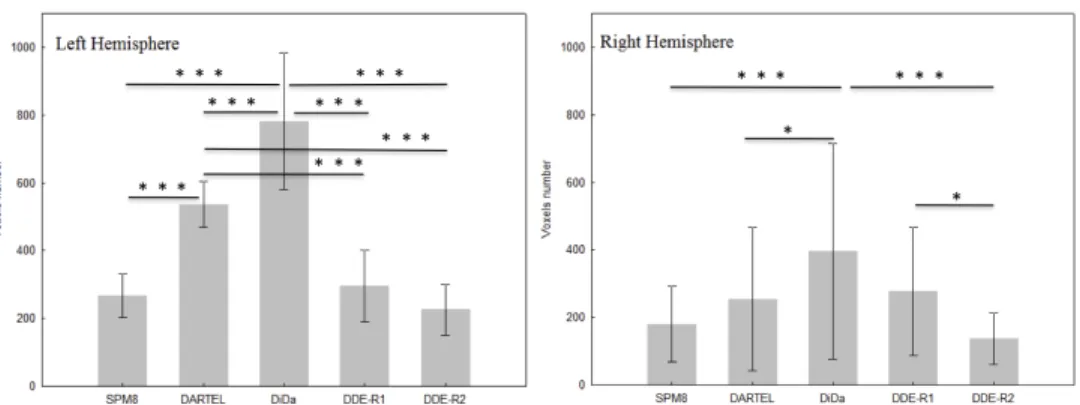
Figure 10 shows the total number of statistically significant voxels de-tected at the group level across all tasks for each hemisphere and for
Figure 8: Influence of registration techniques on group-averaged functional maps
for flexion. The zoomed part emphasizes T-values greater than 7 (p≤ 10−5). Right hemisphere (right column) and left hemisphere (left column).
each method. There is a highly significant effect of the method on the activation detectability (F4,20=16, partial eta-squared ηp2 = 0.76, p≤ 5.10−6), and a small but significant effect of the hemisphere (F=7, η2
p = 0.59, p≤ 4.10−2) and a significant interaction between hemisphere and method (F=19, ηp2 =0.79, p≤ 10−6). For the left hemisphere, differences between the methods in term of activation detectability are highly si-gnificant but for SPM8 versus DDE-R1 or DDE-R2 and for DDE-R1
versus DDE-R2. For the right hemisphere, the differences between me-thods are less significant except for DiDa versus DDe-R2.
Figure 9: Dispersion of individual subject peak activity coordinates. For each
me-thod one statistically significant cluster was selected in individuals respectively for right hand extension (RH ext, n = 10), left hand extension (LH ext, n=11), right hand flexion (RH flex, n=13) and right hand flexion (LH flex, n=13). We show the mean and standard deviation of Euclidian distance between each individual peak coordinates and their centroid (mean coordinate) after registration with SPM8, DARTEL, DiDa, DDeR1 and DDeR2.
4. Discussion
In an effort to improve the quality of the results provided at the popula-tion level using fMRI data, we investigated the combinapopula-tion of state-of-the-art registration methods with high resolution functional MR data imaging the motor cortex region.The use of high-resolution functio-nal MR images allowed to finely reveal the impact of the registration on the cortical assignment of the detected clusters. Our study clearly shows that the alignment quality provided by non-linear methods has a direct and strong impact on the detection of activated clusters, i.e. improvement of the statistical significance of the detected clusters, and
Figure 10:Activation detectability. For each method, we show the mean and
stan-dard deviation of the number of voxels significantly activated at the group level (t≥4.0, p≤0.0001 voxel level uncorrected) across the tasks for each hemisphere. The p values corresponding to significant differences between methods are indica-ted as follows : * p≤0.05, *** p≤0.001.
on their localization, i.e improvement of the accuracy of the clusters po-sition and reduction of their spatial dispersion. The gain we obtained in functional activation detection confirms our initial hypothesis that a good alignment of individual central sulci should improve the map-ping of individual functional M1 regions. Such a relationship between an anatomical landmark and a functional area is certainly less clear in non primary cortical areas as observed for instance by Tahmasebi et al (Tahmasebi et al., 2012) for early stages versus cognitively higher levels of auditory processing. The generalization of our results is then limited because spatial location of functional area may vary greatly across subjects within a cortical area (Frost and Goebel, 2012) and due to the use of possible individual strategy for high-level tasks. Note that despite the improvement in spatial resolution and functional alignment, we failed to separate the differential activation resulting from different movements.
Methological issues
Our study emphasizes that the accuracy of registration method should be assessed via complementary quantitative indexes that measure the accuracy of the anatomical alignment and the functional overlap. In accordance to (Hellier et al., 2003; Klein et al., 2009), anatomical
mea-sures showed that methods with high degree of freedom can increase overlap of cortical ribbons (Figure 3, bottom). However, this does not necessarily improve the alignment of central sulci (CS) (Figure 2 and Figure 3, up). Among the 4 registration methods evaluated here, only DARTEL and DiDa present both a low Hausdorff distance for CS and a high overlap for gray matter. These good performances (Figure 3) highlight the fact that DARTEL achieves a good alignment of CS, as already observed in (Klein et al., 2009). The anatomical constraint on sulci alignment brought by DISCO does not clearly improve the anatomical alignment measures. With the two methods that reduced distances between CS, i.e. DARTEL and DiDa, the functional T-value distributions (Figures 7 and 8), the activation detection (Figure 10) and the clusters localization (Figures 5 and 6) were clearly improved as compared to SPM8 and DDe. After realignment, the individual clus-ter coordinates dispersion was reduced using DARTEL, DiDa or DDe compared to SPM8 (Figure 9) but no significant difference was found between DDe, DIDA and DARTEL.
Indeed, the slight improvement in CS realignment obtained with DiDa has a significant positive effect on group statistics (Figures 7 and 8). This confirms that any change in deformation has an impact on func-tional group analysis, as reported in (Viceic et al., 2009) or (Tahmasebi et al., 2009, 2012) for auditory cortex. Note that effective smoothness as provided by SPM8 was not statistically different between the regis-tration methods used (average volumetric resolution = 3.2, σ =0.2). In (Viceic et al., 2009), the authors compared their local landmark based registration method –developed specifically for the supra tempo-ral plane and using sulci delimiting Heschl’s gyrus– to standard global affine and non-rigid methods. They showed the importance of local constraints they introduced on the accuracy of the alignment of indivi-dual Heschl’s regions. However, the standard spatial smoothing (6-mm full width at half maximum) they used limited the accuracy of the assignment of activated clusters to precise anatomical regions. In (Tah-masebi et al., 2009) the effect of spatial smoothing was investigated in auditory cortex, showing that smoothing degrades the localization of the activation and increases the magnitude of the peak activation for all studied methods. We used a high spatial resolution after smoothing equal to 1.5x1.5x1.5mm3. As expected, a larger resolution (3x3x3mm3),
after smoothing, comparable to image resolution (3.3x3.3x4mm3) used in Tahmasebi et al. (2009) improved the number of activated voxels (see Supplementary data, Figures 13 and 14) but hampered the sepa-ration of different foci of activation (see Supplementary data, Figures 11 and 12). In this case, the difference in activation detectability bet-ween DARTEL and Disco is no more significant (see Supplementary data, Figure 15).
Our study provides additional data about the effect of registration with the analysis of the Jacobian of the deformations. The spatial distribu-tion of the deformadistribu-tion (Figure 4a) indicates clearly that in the ab-sence of explicit anatomical constraints, such as gray- and white- mat-ter overlap for DARTEL and sulcal constraints for DiDa, DDe com-puted unsatisfactory deformations despite of a relatively good mea-sure of gray-matter overlap. DARTEL deformations remain relatively smooth (Figure 4b) while associated with good anatomical and func-tional measures. This suggests that DARTEL provides deformations that respect the anatomo-functional organization of the cortex. DiDa generated stronger deformations compared to DARTEL. The additio-nal compressions were mainly located between the left and right cen-tral sulci, indicating that the constraints from the two cencen-tral sulci competed in this region (Figure 4b). Indeed, unlike DDe, DiDa and DARTEL were not restricted to the common ROI and covered the en-tire brain volume such that the constraints between hemispheres could interact. More interestingly, voxels corresponding to relatively high di-latations were distributed on both banks of the central sulci and es-pecially around the hand-knob structure. This suggests that DiDa did integrate the information from the shape of the central sulcus while re-gistering the surrounding cortices between subjects. This supports the improvement observed with functional measures compared to DAR-TEL. In addition, our results with DDe also illustrate the bias induced by the chosen reference subject. This bias is likely to occur with any registration strategy relying on the arbitrary choice of a reference. In (Tahmasebi et al., 2009), the authors concluded that HAMMER (Shen and Davatzikos, 2002) outperformed DARTEL in the auditory cortex but the sensitivity of the former to the chosen reference was not re-ported. An extension of DDe (or HAMMER) to iteratively compute a mean image as a template, similarly to DARTEL or DiDa, could
be considered for the method improvement. DARTEL and DiDa used the same iteratively computed template and we can rule out the pos-sible influence of the template on the observed differences. Our re-sults clearly indicate the superiority of methods that iteratively built a group-specific template compared to the use of a predefined reference template. A drawback of the use of such templates is that comparisons of activated clusters position between literature is less straightforward. Our study could be interestingly extended using efficient non-linear methods such as IRTK, surface-based registration methods (e.g. Free-Surfer (Fischl et al., 1999; Yeo et al., 2009)) or recent combinations of volume and surface registration (Postelnicu et al., 2009; Du et al., 2011). Indeed, surface based analysis is attractive especially for functio-nal data afunctio-nalysis because it respects the essentially 2D-structure of the cortical ribbon facilitating for instance the affectation of activation to the right side of the bank of a sulcus. However, for registration purpose, surface-based and volume-based methods seem to perform with similar accuracies (Klein et al., 2010). Finally, the use of a specific EPI tem-plate such as proposed in (Huang et al., 2010) would not allow reaching the accurate localization in motor cortex we search for.
To conclude, our study demonstrates that combining high resolution fMRI with accurate realignment of the central sulcus of individuals provided by DARTEL or DiDa opens the way to non invasive func-tional exploration of the human hand motor cortex at the population level. Exploring cortical representation of simple hand movements at the healthy population level gives a reference to study mechanisms of brain plasticity under pathological conditions or after rehabilitation training following hand surgery.
Funding
This work received financial support from Cluster Handicap Vieilisse-ment Neurosciences of the R´egion Rhˆone-Alpes, France (grant number RA0000R175). F. P. was supported by a PhD grant from Minist`ere de la Recherche. G.A. was funded by the Agence Nationale de la Re-cherche (ANR-09-BLAN-0038-01, ’Brainmorph’).
Acknowledgement
Lamalle, Olivier Montigon and Ir`ene Tropr`es from the SFR RMN Biom´edicale et Neurosciences.
References
Ashburner J. A fast diffeomorphic image registration algorithm. Neu-roImage 2007 ;38(1) :95–113.
Ashburner J, Friston K. Unified Segmentation. NeuroImage 2005 ;26(3) :839–51.
Auzias G, Colliot O, Glaunes J, Perrot M, Mangin J, Trouve A, Baillet S. Diffeomorphic brain registration under exhaustive sulcal constraints. IEEE Trans Med Imaging 2011 ;30(6) :1214–27.
Beisteiner R, Windischberger C, Lanzenberger R, Edward V, Cunning-ton R, Erdler M, Gartus A, Streibl B, Moser E, Deecke L. Finger somatotopy in human motor cortex. NeuroImage 2001 ;13(1) :1016– 26.
Caulo M, Briganti C, Mattei P, Perfetti B, Ferretti A, Romani G, Tartaro A, Colosimo C. New morphologic variants of the hand motor cortex as seen with MR imaging in a large study population. Am J Neuroradiol 2007 ;28(8) :1480–5.
Crum W, Camara O, Rueckert D, Bathia K, Jenkinson M, Hill D. Ge-neralised overlap measures for assessment of pairwise and groupwise image registration and segmentation. Med Image Comput Assist Interv 2005 ;8(1) :99–106.
Dechent P, Frahm J. Functional somatotopy of finger representations in human primary motor cortex. Hum Brain Mapp 2003 ;18(4) :272–83. Deichmann R, Good C, Josephs O, Ashburner J, Turner R. Opti-mization of 3-D MP-RAGE sequences for structural brain imaging. NeuroImage 2000 ;12(1) :112–27.
Du J, Younes L, Qiu A. Whole brain diffeomorphic metric mapping via integration of sulcal and gyral curves, cortical surfaces, and images. NeuroImage 2011 ;56(1) :162–73.
Fischl B, Rajendran N, Busa E, Augustinack J, Hinds O, Yeo B, Mohl-berg H, Amunts K, Zilles K. Cortical folding patterns and predicting cytoarchitecture. Cereb Cortex 2008 ;18(8) :1973–80.
Fischl B, Sereno M, Tootell R, Dale A. High-resolution intersubject averaging and a coordinate system for the cortical surface. Human Brain ;apping 1999 ;8(4) :272–84.
Frost MA, Goebel R. Measuring structural-functional correspondence : spatial variability of specialised brain regions after macro-anatomical alignment. NeuroImage 2012 ;59(2) :1369–81.
Geyer S, Ledberg A, Schleicher A, Kinomura S, Schormann T, B¨urgel U, Klingberg T, Larsson J, Zilles K, PE R. Two different areas within the primary motor cortex of man. Nature 1996 ;382(6594) :805–7. Hellier P, Barillot C, Corouge I, Gibaud B, Le Goualher G, Collins
D, Evans A, Malandain G, Ayache N, Christensen G, Johnson H. Retrospective evaluation of intersubject brain registration. IEEE Trans Med Imaging 2003 ;22(9) :1120–30.
Huang C, , Lee S, Hsiao I, Kuan W, Wai Y, Ko H, Wan Y, Hsu Y, Liu H. Study-specific EPI template improves group analysis in functional MRI of young and older adults. J Neurosci Meth 2010 ;189(2) :257– 66.
Humphrey D. Representation of movements and muscles within the primate precentral motor cortex : historical and current perspectives. Fed Proc 1986 ;45(12) :2687–99.
Hyde J, , Biswal B, Jesmanowicz A. High-resolution fMRI using mul-tislice partial k-space GR-EPI with cubic voxels. Magn Reson Med 2001 ;46(1) :114–25.
Indovina I, Sanes J. Combined visual attention and finger mo-vement effects on human brain representations. Exp Brain Res 2001 ;140(3) :265–79.
Kakei S, Hoffman D, Strick P. Muscle and movement representations in the primary motor cortex. Science 1999 ;285(5436) :2136–9.
Klein A, Andersson J, Ardekani B, Ashburner J, Avants B, Chiang M, Christensen G, Collins D, Gee J, Hellier P, Song J, Jenkinson M, Le-page C, Rueckert D, Thompson P, Vercauteren T, Woods R, Mann J, Parsey R. Evaluation of 14 nonlinear deformation algorithms applied to human brain MRI registration. NeuroImage 2009 ;46(3) :786–802. Klein A, Ghosh S, Avants B, Yeo B, Fischl B, Ardekani B, Gee J, Mann J, Parsey R. Evaluation of volume-based and surface-based brain image registration methods. NeuroImage 2010 ;51(1) :214–20. Kleinschmidt A, Nitschke M, Frahm J. Somatotopy in the human
motor cortex hand area. a high-resolution functional mri study. Eur J Neurosci 1997 ;9(10) :2178–86.
Leow A, Yanovsky I, Chiang M, Lee A, Klunder A, Lu A, Becker J, Davis SW, Toga A, Thompson M. Statistical properties of Jacobian maps and the realization of unbiased large-deformation nonlinear image registration. IEEE Trans Med Imaging 2007 ;26(6) :822–32. Meier J, Aflalo T, Kastner S, Graziano M. Complex organization of
human primary motor cortex : a high-resolution fMRI study. J Neu-rophysiol 2008 ;100(4) :1800–12.
Oldfield R. The assessment and analysis of handedness : the edinburgh inventory. Neuropsychologia 1971 ;9(1) :97–113.
Penfield W. The principles of physiology involved in the management of increased intracranial pressure. Annals of surgery 1935 ;102(4) :548– 54. Penfield, W Ann Surg. 1935 Oct ;102(4) :548-54.
Postelnicu G, Zollei L, Fischl B. Combined volumetric and surface registration. IEEE Trans Med Imaging 2009 ;28(4) :508–22.
Rao S, Binder J, Hammeke T, Bandettini P, Bobholz J, Frost J, Myk-lebust B, Jacobson R, Hyde J. Somatotopic mapping of the human primary motor cortex with functional magnetic resonance imaging. Neurology 1995 ;45(5) :919–24.
Rathelot J, Strick P. Muscle representation in the macaque mo-tor cortex : an anatomical perspective. Proc Natl Acad Sci USA 2006 ;103(21) :8257–62.
Sanes J, Donoghue J, Thangaraj V, Edelman R, Warach S. Shared neu-ral substrates controlling hand movements in human motor cortex. Science 1995 ;268(5218) :1775–7.
Sanes JN, Schieber MH. Orderly somatotopy in primary motor cortex : does it exist ? NeuroImage 2001 ;13 :968–74.
Shen D, Davatzikos C. Hammer : hierarchical attribute matching mechanism for elastic registration. IEEE Trans Med Imaging 2002 ;21(11) :1421–39.
Strother L, Medendorp WP, Coros AM, Vilis T. Double representation of the wrist and elbow in human motor cortex. Eur J Neurosci 2012 ;36(9) :3291–8.
Sun Z, Kl¨oppel S, Rivi`ere D, Perrot M, Frackowiak R, Siebner H, JF M. The effect of handedness on the shape of the central sulcus. NeuroImage 2011 ;60(1) :332–9.
Tahmasebi A, Abolmaesumi P, Zheng Z, Munhall K, Johnsrude I. Re-ducing inter-subject anatomical variation : effect of normalization method on sensitivity of functional magnetic resonance imaging data analysis in auditory cortex and the superior temporal region. Neu-roImage 2009 ;47(4) :1522–31.
Tahmasebi AM, Davis MH, Wild CJ, Rodd JM, Hakyemez H, Abol-maesumi P, Johnsrude IS. Is the link between anatomical structure and function equally strong at all cognitive levels of processing ? Ce-reb Cortex 2012 ;22(7) :1593–603.
Thirion J. Image matching as a diffusion process : an analogy with Maxwell’s demons. Med Image Anal 1998 ;2(3) :243–60.
Vercauteren T, Pennec X, Perchant A, Ayache N. Diffeomorphic demons : efficient non-parametric image registration. NeuroImage 2009 ;45(1 Suppl) :S61–72.
Viceic D, Campos R, Fornari E, Spierer L, Meuli R, Clarke S, Thi-ran J. Local landmark-based registration for fmri group studies of nonprimary auditory cortex. NeuroImage 2009 ;44(1) :145–53.
Yassa M, Stark C. A quantitative evaluation of cross-participant re-gistration techniques for mri studies of the medial temporal lobe. NeuroImage 2009 ;44(2) :319–27.
Yeo B, Sabuncu M, Vercauteren T, Ayache N, Fischl B, Golland P. Spherical demons : Fast diffeomorphic landmark-free surface regis-tration. IEEE Trans Med Imaging 2009 ;29(3) :650–68.
Yousry T, Schmid U, Alkadhi H, Schmidt D, Peraud A, Buettner A, Winkler P. Localization of the motor hand area to a knob on the precentral gyrus. a new landmark. Brain 1997 ;120 ( Pt 1) :141–57.
5. Supplementary Data 5.1. Effect of Smoothing
A gaussian kernel of 3x3x3mm3 was applied on the functional data. Figures 11 and 12 illustrate the localization of the main activated clus-ters derived from group analysis for extension and flexion respectively (p≤0.0001, voxel level uncorrected with no thresholding on cluster size), superimposed on the corresponding mean structural image computed for each method and restricted to the common ROI.
Figures 13 and 14 compare the histograms of the T-value maps for flexion and extension respectively for each task and each hemisphere. The zoomed part emphasizes T-values greeter than 7 (p≤ 10−5). Figure 15 shows the total number of statistically significant voxels de-tected at the group level across all the tasks in each hemisphere and for each method. There is a highly significant effect of the method on the activation detectability (F4,20=12, partial eta-squared ηp2 = 0.70, p≤ 4.10−5 ), and a high significant effect of the hemisphere (F=18, ηp2 = 0.78, p≤ 8.10−3) and a significant interaction between hemisphere and method (F=10, η2
p =0.67, p≤ 10
−4). Differences between methods for each hemisphere are similarly to those obtained with data smoothed with a 1.5mm3 gaussian kernel. However, no difference between DAR-TEL and Disco appears significant for the right and the left hemisphere when using 3mm3 smoothing.
Figure 11: Activation maps obtained for extension tasks for left hand (top, right he-misphere) and right hand (bottom, left hehe-misphere) for each method. Three contiguous transverse slices are displayed to show the largest clusters around the right (resp. left) central sulcus for each method. Maps are superimposed on the corresponding mean struc-tural image computed for each method and restricted to the common ROI. t≥4.0, p≤0.0001 voxel level uncorrected with no thresholding on the cluster size.
Figure 12: Activation maps obtained for flexion tasks for left hand (top, right hemisphere) and right hand (bottom, left hemisphere) for each method. Three contiguous transverse slices are displayed to show the largest clusters around the right (resp. left) central sulcus for each method. Maps are superimposed on the corresponding mean structural image computed for each method and restricted to the common ROI. t≥4.0, p≤0.0001 voxel level uncorrected with no thresholding on the cluster size.
Figure 13:Influence of registration techniques on group-averaged functional maps
for extension. The zoomed part emphasizes T-values greater than 7 (p≤ 10−5). Right hemisphere (right column) and left hemisphere (left column).
Figure 14:Influence of registration techniques on group-averaged functional maps
for flexion. The zoomed part emphasizes T-values greater than 7 (p≤ 10−5). Right hemisphere (right column) and left hemisphere (left column).
Figure 15:Activation detectability. For each method, we show the mean and
stan-dard deviation of the number of voxels significantly activated at the group level (t≥4.0, p≤0.0001 voxel level uncorrected) across the tasks in each hemisphere. The p values corresponding to significant differences between methods are indicated as follows : * p≤0.05, *** p≤0.001.