HAL Id: hal-01212615
https://hal.archives-ouvertes.fr/hal-01212615
Submitted on 14 Oct 2015HAL is a multi-disciplinary open access archive for the deposit and dissemination of sci-entific research documents, whether they are pub-lished or not. The documents may come from teaching and research institutions in France or abroad, or from public or private research centers.
L’archive ouverte pluridisciplinaire HAL, est destinée au dépôt et à la diffusion de documents scientifiques de niveau recherche, publiés ou non, émanant des établissements d’enseignement et de recherche français ou étrangers, des laboratoires publics ou privés.
Distributed under a Creative Commons Attribution| 4.0 International License
Customers-Suppliers Relationship Management in an
Intelligent Supply Chain
Fouzia Ounnar, Patrick Pujo, Lynda Mekaouche, Norbert Giambiasi
To cite this version:
Fouzia Ounnar, Patrick Pujo, Lynda Mekaouche, Norbert Giambiasi. Customers-Suppliers Relation-ship Management in an Intelligent Supply Chain. Production Planning and Control, Taylor & Francis, 2007, 18 (5), pp.377-387. �hal-01212615�
Customers-Suppliers Relationship Management
in an Intelligent Supply Chain
F.Ounnar1, P. Pujo, L. Mekaouche, N. Giambiasi
Laboratoire des Sciences de l’Information et des Systèmes (LSIS) UMR CNRS 6128, Université Paul Cézanne
Avenue Escadrille Normandie Niemen 13397 Marseille Cedex 20 – France
Tel : (33) 4 91 05 60 10 Fax : (33) 4 91 05 60 33
{fouzia.ounnar, patrick.pujo, lynda.mekaouche, norbert.giambiasi}@lsis.org Abstract
Outsourcing is leading to more and more complex industrial organizations. This can be attributed to the fact that several decisions centres interact. As a consequence, changes in customers-suppliers relationships can be noticed. In recent years, these relations have strongly evolved to lead to better internal management of each partner and a better general performance to satisfy customers. These evolutions created a new approach of the relations between companies, called ‘industrial partnership’, in the form of a network. Networks induce a need at customers-suppliers relation control level. The contribution and participation of each of the partners are thus fundamental to make Supply Chain Management (SCM) a successful project. The control system of each actor partner must thus be adaptable enough to satisfy the production requirements. Our contribution to the improvement of customers-suppliers relationship is a decentralized self-organized control model. In this model, the decision system manages a group of actors’ operations who are in a partnership (part of companies network). In this paper, we, particularly discuss a process for the evaluation of the suppliers network.
Keywords
Customers-Suppliers Relationship, Self-Organization, AHP, Holonic System.
1 Introduction
The pressure of globalization, competition, reduced cycle times and increasing complexity have forced many to search for new forms of organizations, in particular to meet the increasing needs for responsiveness. Today, the customer is placed at the centre of the organisation. This is a long-term task, which requires not only the implementation of new customer-oriented processes, but also a modification of ways of thinking. This is part of what is called ‘supply chain management’. (Johannessen and Solem 2002) discuss how changing logistics organizations are viewed within various ideologies. The authors conclude that there is a need for improving the ability to deal with changes within logistics organizations. They also emphasise that this can be achieved by adopting new theoretical and practical perspectives into organizations’ established ideologies. To achieve the goal
of a company, this latter must control supply and demand in the economic system to which it belongs. The company is in relation with suppliers and customers, and the logistics of the company aim to optimize the relationships with upstream suppliers and downstream customers. The objective has been an improvement in the internal management of individual companies and in their shared performance in meeting the requirements of their customers. The customers-suppliers relationships are thus as essential to a company as its internal relationships. The control of relationships among partner companies involves all the actions they develop together to achieve their common objectives and to react at the right time to any failure on the part of any one of the partners. A negotiation among partners is thus required involving the management and organization of each partner’s production. Several research fields can be subsequently identified: management of the demand, partnership with suppliers, processing of orders, planning, performance indicators, introduction of new products, information system, control of the industrial and logistic flows, selection of suppliers, etc. (Jayaraman et al. 1999, Bonnefous and Courtois 2001, Burlat et al. 2003, Gunasekaran and Ngai 2003). The control system of each actor partner must thus be adaptable enough to satisfy the requirements of production. For this reason, we have proposed a decentralized self-organized control model in which the decision system manages the operation of a group of actors who are in a partnership and part of a network of companies (Ounnar and Pujo 2001, 2005). (Davenport and Brooks 2004) explain that this type of relations was enhanced. Indeed, the SCM has always been a challenge of information integration. The idea is to allow everyone involved in the flow of goods to make decisions based on the latest and best information from everyone else, both upstream and downstream. Earlier supply chain software helped firms manage and analyze their logistical and inventory management processes, but they were not well-integrated in other applications. Now, more powerful and integrated packaged solutions, in many cases using the Internet, are suddenly putting supply chain excellence within the reach of virtually every company, and making it a competitive imperative for businesses of all sizes. The authors assume that in the future, demand and supply chain planning applications will be more closely linked through Enterprise Systems and will begin to interact in real time, the human interactions being involved becoming less frequent. Distributed solutions promise to use the power of networks to optimize processes. Optimal scheduling and allocation decisions emerge from the interaction of enterprise systems and
negotiate commitments based on costs, resource availability, lead times, and other variables.
The decentralized approach of the decision-making mechanisms that we have proposed is based on the increasing autonomy of the actors of a production system and on their capacity to communicate with the other actors for a better reactivity (Mekaouche et al. 2005). The concept of self-organization depends on the use of a decentralized decision structure (Pujo and Brun-Picard 2001) as well as taking into consideration the behaviour of each of the actors (decision centres). The general principle of order assignment is based on a mechanism of search for the best Response to a Call For Proposal (RCFP) diffused beforehand. The customer launches a Call For Proposal (CFP) to all the suppliers, either in the case of a normal situation of supplying or subcontracting of goods or services, or in the case of internal or external disturbances. The suppliers then begin to negotiate with each other. The solution that appears to be the most efficient, considering the evaluation criteria, will be adopted. In the proposal, the decentralized self-organized control model is based on the concept of holon (Koestler 1989). Holon is the decision-making centre associated with the production system of the entity. It allows a supplier to become an intelligent production unit able to operate in self-organization with other companies. These holons are organised in a flat holonic form (Bongaerts et al. 2000). A number of primitives seem to be functionally invariant for a holon, and they can be grouped together in three main modules.
The Communication Module, which ensures the exchange of messages through the network. The
communication is structured around the communication protocol for sending messages, known as contract-net (Smith 1980).
The Interaction Module, which allows the assignment of orders to the various companies in the network. This
module uses a generic mechanism of self-organization of the companies network to be controlled.
It is the performance module that quantitatively estimates the capacity of an entity to execute the CFP. By means of this estimation, the interaction module will position itself with regard to the propositions resulting from the other holons and will decide to accept or to refuse the CFP according to the improvements that occurred.
estimate its own capacity to respond to the CFP and will deduce its own performance, according to criteria common to all the holons. This performance allows a real differentiation of the order assignment solutions, since the intrinsic behaviour of each enterprise in the network is taken into account in real time.
Companies have understood that, if they want to reduce total costs, they should not only make their suppliers compete with one another, but also improve the performances of the partnership they form with their suppliers. In the sequel, section two introduces AHP as the multi-criteria decision-making method chosen for this study. Section three builds up the system of criteria and indicators to apply the AHP method. Section four applies our findings to the example. Finally, in section five we state our conclusion and future works.
2 Suppliers evaluation processes
The objective of the process of evaluating suppliers is threefold: selecting suppliers who deliver low-cost products or services that meet the customers’ requirements, cheeking that the suppliers are reliable and that they satisfy the needs of the customer in terms of quality, quantity, delivery times, and so on, and also monitoring the ongoing relationship between the suppliers and the customer. Customers will have to optimize their own production and their relationships with their suppliers. Suppliers will have to position themselves in reply to the calls for proposals diffused by customers, and will have to demonstrate their capacity to utilize their assets for these customers. This section describes a process for the evaluation of suppliers network, which we have developed, and which is based on the 'Analytic Hierarchy Process' (AHP) method (Saaty 1980, Narasimhan 1983, Muralidharan et al. 2002, Rong et al. 2003). The method which is described in this paper has the advantage of leading to a more systematic evaluation of improvement opportunities.
2.1 How to decide which supplier will take the Call For Proposal?
Traditionally, the selection and evaluation of suppliers has been made by using a single criterion: product cost. Priority was assigned to the supplier who proposed the cheapest bid (D’Amours et al. 2001). Today, the selection of a supplier is made on the basis of multiple criteria and involves more than one person (Tan et al. 1998). The consideration of multiple conflicting objectives in a decision model has made the area of Multiple-Criteria Decision-Making (MCDM) very challenging (Muralidharan et al. 2002). A survey of methods using
multiple criteria (Ounnar 1999, Ounnar and Ladet 1999) has led the present authors to select a method called Analytic Hierarchy Process (AHP). AHP has advantages over other decision-making approaches (Vargas 1990, Wedley 1990) these include its ability to: (i) handle tangible and intangible attributes; (ii) structure the problems hierarchically to gain insights into the decision-making process; and (iii) monitor the consistency of the judgments of a decision-maker. The AHP was chosen as the multi-criteria method because of its capability to quantify and rank the alternatives using simple pair wise comparison of criteria (Harker 1989). The AHP has demonstrated robustness across a range of application domains (Saaty 1996). The AHP method was used for the supplier selection process and we can quote the contribution of (Narasimhan 1983, Nydick et al. 1992). The authors used this technique in order to classify the supplier and thus former an effective suppliers network. In our approach the AHP method is used, at the level of each supplier, in order to classify the CFPs the company can perform (Ounnar and Pujo 2005). Thus this multi-criteria method is used in order to choose, among several CFPs, the CFP which ensures the best performance for the company. If an other company provides a better performance according to this CFP, the company suppresses this CFP and uses AHP again in order to identify the next best CFP. AHP thus allows to classify the CFPs. The calculation of the performance is carried out for the CFP ranks first by the AHP method, for each supplier. It is then the interaction module which carries out the comparison of the performances with regard to a same CFP. The supplier having the best performance executes the CFP.
Thus, suppliers aim at evaluating their performance against a convenient call for proposal (the CFP ranked first by AHP). The first phase for the implementation of the multi-criteria algorithm based on AHP method is to derive an adequate system of indicators. Eventually, we are able to evaluate the performance of the call for proposal ranked first by each supplier.
2.2 Analytic Hierarchy Process (AHP): A multi-criteria method
The AHP is a method for complex multi-criteria problems involving multiple quantitative and qualitative criteria. This process involves four phases:
decision-makers to structure the significant components of a problem in a hierarchical structure. The hierarchy of the decision-making process is defined by a quadruplet <L1, L2, L3, L4>, where: Level 1 (L1) = General Objective; Level 2 (L2) = Criteria; Level 3 (L3) = Indicators; Level 4 (L4) = Alternatives (Calls For Proposals). We have used the following notations: Crk = Criterion k; Ik,j = Indicator j of Crk; Ali = Alternatives.
Phase 2: Pair wise comparison of the elements of each built hierarchical level: the central 'ingredient' of the
AHP method is comparisons. The pair wise comparison evaluates the relative importance of two elements for the decision maker. The AHP method’s scale of value is used (Saaty 1980). The aim of this comparison is to specify the importance of a given element compared to another one. The comparison value is noted A[i,j], accordingly, A[j,i]=1/A[i,j] and A[i,i]=1.
Phase 3: Calculation of the relative weight between the elements of each two adjacent levels: this phase
allows the calculation of the relative importance vector of a level with regards to a higher level. This vector of relative importance expresses the elements ranking at the same level compared to each element of the higher level. In this phase, it is possible to check the coherence of the judgments. Thus, AHP supplies the decision-makers with an incoherent measure and allows the reduction of incoherence.
Phase 4: Aggregation of the relative weights of the different hierarchical levels: this phase provides
classifications of the decision alternatives of the decision. It allows the calculation of the relative importance vector of the lowest level (alternatives) compared to the first level (general objective). This aggregation principle consists in carrying out matrix products. The final result is a classification of the alternatives that have been considered. Then, the supplier evaluates the best selected alternative (Call For Proposal).
Each supplier has this algorithm implemented in his decision centre thus the matrixes are filled by the supplier. It is also necessary to highlight that the proposed approach does not exclude man’s contribution of human. Human intervention is situated at several levels:
- Upstream, it is necessary to choose the criteria and indicators which are used in the performance evaluation of the suppliers. This choice is established by the partnership. In our study, there are five criteria. These criteria,
which are the most commonly used to evaluate suppliers, were chosen after a survey (Ounnar and Pujo 2005). In section 3, we explain how the indicators associated to each criterion were built;
- Each supplier can define his own preferences on the criteria and the indicators which are taken into account in the calculation of its performance, to select CFPs on which he wishes to negotiate. That enables him to define his own policy of search for customers, by giving for example more importance to the criteria representing his best assets;
- Each customer keeps the possibility of indicating that he prefers to work with supplier X. He then knows the loss of productivity that such a decision can possibly generate. This is achieved in the criteria named ‘Strategy’. - Each customer specifies his preferences concerning the criteria. This is done in the formula that allows to evaluate the performance of the supplier to respond to the customer needs. Indeed, in the performance formula, weights are given to the criteria, the greatest weight indicating the highest importance. These weights are specified by each customer.
2.3 Advantages of using AHP for the evaluation of the suppliers
The AHP is a suitable multi-criteria method for solving the problem of supplier evaluation. AHP can be used to determine both the importance of the weights for the criteria and the relative ranking of the alternative potential suppliers. The strength of the method lies in its ability to handle the judgmental factors (Narasimhan 1983). When applied to the supplier evaluation problem, AHP accomplishes the following: (1) it provides a systematic approach that focuses on commonly and evaluative criteria, such as delays, costs, quality, and so on). AHP makes it easier for suppliers to quantify their subjective evaluations. (2) By using a step-by-step approach to quantification, the difficult task of processing the information about suppliers is simplified. (3) The determination of weights criterion and supplier’s ratings and rankings is accomplished in one integrated procedure. In order to apply AHP to the problem of supplier evaluation, it is necessary to elaborate the criteria and the associated indicators, thus allowing each supplier to compare its own performance with the best performance, to make the best supplier emerge for each Call For Proposal.
3 Evaluation of the individual performance
The formalization of the various criteria is obtained by decomposing each of them in a set of indicators. For that it was necessary to review the various types of the existing indicators in order to extract the most commonly used criteria and then to formalize from them criteria that respond to our goal. This review (Ounnar and Pujo 2005) enables us to present a set of criteria which can be used to evaluate the performance of the suppliers belonging to a network of partnership. Indeed, (Dickson 1966) examined the importance of supplier evaluation criteria and presented 23 supplier attributes that managers consider in such an evaluation. Additionally, (Choi and Hartley 1996) presented 26 supplier selection attributes from a survey of US automotive companies. (Nakato and Michael 1998) presented 14 supplier selmection attributes from a survey of Japan automotive and electronic companies. (Dickson 1966) identified price, quality, and delivery performance as the three most important criteria in supplier evaluation. Moreover, (Weber et al. 1991) reviewed 74 articles from 1967 to 1990 based on the 23 vendor selection presented by (Dickson 1966) and conclude that quality was the most important factor, followed by delivery performance and price on supplier evaluation.
The review was also based on work relating to the selection of suppliers (D’Amours et al. 2001). This work is classified to be on a level higher than that of our work, because the work dealing with the selection of suppliers allows to select the suppliers that we are evaluating. This evaluation is carried out in the framework of a partnership network. (Pearson and Ellram 1995) examined supplier selection and evaluation criteria in small and large electronics firms and concluded that quality was the most important criterion in supplier selection and evaluation for both small and large electronic firms. Furthermore, (Thomas and Janet 1996) surveyed purchasing managers of US automotive companies and concluded that quality and delivery remained the most important criteria across all levels, even 30 years after the study of (Dickson 1966) on supplier selection. (Olhager and Selldin 2004) investigated supply chain management strategies and practices in a sample of 128 Swedish manufacturing firms and concluded that many aspects are important when companies choose supply chain partners. (Chen et al. 2005) indicates that from a survey conducted in 1998 on ‘Excellent supplier’, the weights of elements involved in supplier assessment are 44% quality, 36% delivery on time, 24% overall costs,
19% services, 6% technology and less than 5% for the remainder, including innovation, problem solving, knowledgeable personnel, good communication.
The aim of our research in this field was to initiate the development of a methodology for evaluating suppliers in the framework of a decentralized and self organized approach. The proposed process will not change if one decides to add criteria and/or to change certain criteria.
3.1 Elaboration of criteria and indicators system
The application of the multi-criteria method requires the elaboration and formalization of an adequate system of indicators. In order to elaborate this system, we have exploited an existing and reliable method. In their book, (Cerruti and Gattino 1992) suggest a multi-step method of indicator construction. This method more particularly addresses the construction of indicators for production management, but the principles and the steps we followed remain perfectly suited for the indicators defined and formalized for the supplier evaluation problem ‘As seen in figure 1’.
3.1.1. Definition of field of measurement
Identifying a field of measurement involves defining the frame and the limits of the measurement. Our field of measurement within the frame of the establishment of a supplier evaluation method is defined as ‘the capacity
of a supplier to meet the needs of a customer’. 3.1.2. The choice of objectives
The objectives make the measurement meaningful. In our case, it is defined as ‘the selection of the best CFP’.
3.1.3. Identification of variables and choice of measurable parameters
It is necessary to define one or several elements that will enable us to know where we are with regard to this objective during the measurement. These elements are the variables. Once listed, these various parameters will help us to select relevant indicators.
3.1.4. Selection of indicators
The selection of indicators can easily be done, since the measurable parameters of variables are represented by data. Figure 1 presents the selected indicators to determine the capacity of a supplier to respond to customer
needs.
3.1.5. Validation of selected indicators
It is necessary to validate the relevance of the selected indicators. The obvious question is then: when reading the indicators, are we really capable of reviewing the chosen field with regard to the objectives?
The next section will identify the indicators that will allow to estimate the suppliers according to criteria.
[Insert figure 1 about here] 3.2 Identification of criteria and indicators
Though the indicator is a promising tool in theory, it still remains complex in practice. Indeed, it is necessary to formalize the criteria to allow the performance estimation of each potential supplier. All the selected indicators are used in the composition of five criteria: delay, cost, quality, reliability and strategy.
3.2.1. Delay criterion ‘C1‘
The objective of this criterion is to ensure that the customer receives delivery as quickly as possible. The delay is the time between the expression of a need by the customer and the actual satisfaction of this need. This criterion can be reduced to two indicators:
Lead time ‘I11’: I11 is a quantitative evaluation of the order preparation and\or completion delay. It can be
defined as the sum of the operating times necessary for the processing of the order (Ounnar 1999).
Delivery time‘I12‘: I12 is a quantitative evaluation of the transfer time or order shipping from the supplier to
the customer (Shin et al. 2000).
3.2.2. Cost criterion ‘C2‘
The objective of this criterion is to ensure delivery at the best price. This criterion is a quantitative criterion that takes into account the various costs in the acquisition of goods. The cost criterion can be reduced to two indicators:
Cost of order ‘I21‘: I21 is a quantitative evaluation of before-tax prices of the order delivery, which excludes
the cost of the delivery (D’Amours et al. 2001). This cost can consist of the cost of raw materials, hourly cost, consumables, etc. …
Cost of order delivery ‘I22‘: I22 is a quantitative evaluation of the net of tax order delivery price. It should
be noted that the invoicing method could differ a lot from a supplier to the other. Indeed, it can be a fixed price depending on the order weight or quantity. The delivery cost can depend on the distance between the production site and the delivery site. Some suppliers deliver the order without invoicing.
3.2.3. Quality criterion ‘C3‘
The objective of this criterion is to guarantee that the delivered products are of good quality and in accordance with specifications (D’Amours et al. 2001), that is, the criterion aims to minimize ‘unquality’. The indicators for this criterion can be quantitative or qualitative, and aim at describing continuity of service, compliance with the rules and compliance with expectations concerning the product. This criterion can be reduced to three indicators:
Rate of conformity ‘I31‘: I31 is a quantitative evaluation of the number of products’ ratio manufactured
without defect and in accordance with the customer specifications to the total number of products manufactured (Shin et al. 2000, D’Amours et al. 2001, Movahedkhah and Thiel 2001).
Respect of a referential ‘I32‘: I32 is a qualitative evaluation of the technical performance, of the compliance
to standards by the product as well as of the level of quality assurance of the supplier (Selmer 1998, D’Amours
et al. 2001). This qualitative evaluation is performed by summarizing the quality points obtained. So, the
company is granted a certain number of points each time it is accredited.
Rate of customer satisfaction ’I33‘: I33 is a quantitative evaluation of the number of deliveries from a
supplier to his customer with a quality of service. It is the ratio of the deliveries that aren’t returned to the total number of deliveries (Berrah and Vernadat 2001).
3.2.4. Reliability criterion ‘C4‘
Reliability is the ability of any device to carry out a required function, under given conditions, for a given duration. The objective of this criterion is to guarantee that the delivered products are reliable. This criterion can also be used to evaluate the capacity of the company to meet deadlines. This criterion can be reduced to two indicators:
Conformity in quantity of the orders ‘I41‘: I41 is a quantitative evaluation of the number of orders
delivered in time in the right quantity. It is the ratio, based on the history of the deliveries, of the number of deliveries in the right quantity to the total number of deliveries (Berrah and Vernadat 2001, D’Amours et al. 2001).
Respect for delivery times ‘I42‘: I42 is a quantitative evaluation of the number of complete deliveries in
time. It is the ratio, based on the history of the deliveries, of the number of deliveries carried out in time to the total number of deliveries (Cerruti and Gattino 1992, Berrah and Vernadat 2001).
3.2.5. Strategy criterion ‘C5‘
In the evaluation of each supplier’s performance, qualitative criteria are taken into account. For example, privileged relationships link the customer and supplier. This criterion can be reduced to two indicators:
Allowance of differed payment ‘I51‘: I51 is a qualitative evaluation of the terms of payment granted to the
customer (before delivery, on the day of delivery, one month after delivery, more than one month after delivery, etc.). These terms can differ from a supplier to another (Selmer 1998). They mean a big financial advantage for the customer.
Degree of privilege ‘I52‘: it is the qualitative evaluation of the privileged or competitive relationship that
exists between a customer and a supplier (Ounnar and Pujo 2001). The evaluation of degree of privilege between two companies is based on a scale of preference notation fixed by the customer.
This section defined a system of indicators for the application of the multi-criteria decision method (AHP) to the evaluation of each potential supplier. The application of the proposed multi-criteria method provides the alternative (the Call For Proposal) for which the supplier is the best.
4 Applying AHP to supplier evaluation: an illustration
In the sequel an example is described in order to illustrate previous comments. In this example a partners network, consisting of a customer C and three suppliers: S1, S2 and S3, is considered. The customer launches three Calls For Proposal CFP1, CFP2 and CFP3. Each CFP includes a set of information such as: broadcasting holon, required quantity by the customer, expected delivery period, negotiation delay, ‘As seen in table 1’.
[Insert table 1 about here]
The performance module of each holon (potential supplier), having received these Calls For Proposal uses the multi-criteria algorithm. This last one enables the classification of the CFPs.
4.1 Phase 1: Building a hierarchical process for supplier evaluation
The first phase in applying the AHP method is to build a hierarchical process for supplier evaluation. This is a key phase as it determines the purpose of the decision-making process (the general objective (L1)), on which criteria will be chosen for the evaluation (L2), which indicators will be used for each criterion (L3) and the calls for proposals that will be included (the alternatives (L4)), ‘As seen in figure 2’. Each supplier has the same hierarchical structure (Phase 1 of the AHP algorithm) since whole criteria and indicators are the same for all the partners.
[Insert figure 2 about here] - Level 1: The general objective level
The general objective is to find out the best call for proposal that will be evaluated in order to allow the supplier to be the best one on this CFP. In other words, AHP will classify a set of calls for proposals according to a best compromise between all the criteria we consider as important for the evaluation process.
- Levels 2 and 3: The criteria and their indicators
We have identified in section 3 a number of criteria that influence the choice of a call for proposal for the evaluation: delay, cost, quality, reliability and strategy criterion. Each criterion can be decomposed into a set of indicators.
- Level 4: The alternatives level
Level 4 identifies the different calls for proposals (called alternatives in AHP) to be classified. Calls for proposals are sent by the different customers.
4.2 Phases 2 & 3: Pair wise comparison of the elements of each built hierarchical level & Calculation of the relative weight between the elements of each two adjacent levels
which criterion is really important when choosing the best call for proposal. AHP requires the use of a scale of appreciation of 1 to 9. We have summarized the assessment in table 2. In this table, for example, ’Delay, Cost, and Quality‘ are indicated as equally important (value 1). ‘Delay’ is indicated as strongly more important than ‘Reliability‘ (value 5) and ‘Cost’ is indicated as strongly more important than ‘Strategy’ (value 1/5).
[Insert table 2 about here]
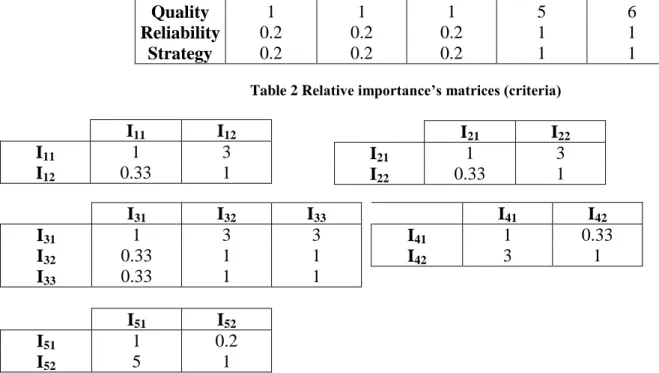
In this phase we also assess for each criterion the importance of the indicators against each other (pair wise comparison). That shows which indicators are really important when we consider each criterion separately. The results are described in the table below.
[Insert table 3 about here]
In this phase we also assess for each alternative (call for proposal) the appropriate values for the different criteria and their indicators ‘As seen in table 4’. The information are used in phase 2 of the AHP algorithm regarding the binary comparisons of the alternatives (CFPs) level that have been made.
[Insert table 4 about here]
In what follows we apply phases 2, 3 and 4 to the decision-making process for supplier S1: - The vector of relative importance of the criteria with regards to the general objective:
05626 0 0583 0 3026 0 2914 0 2914 0 . . . . . CrOg
- The vectors of relative importance (ICrk: k=1, 2, …, 5) of the indicators of each criterion with regards to the
corresponding criteria Ck: 25 . 0 75 . 0 1 ICr ; 25 . 0 75 . 0 2 ICr ; 20 . 0 20 . 0 60 . 0 3 ICr ; 75 . 0 25 . 0 4 ICr ; 83 . 0 17 . 0 5 ICr
- The vectors of relative importance of the alternatives (Ali; i=1,2,3) (calls for proposals (CFPi; i=1,2,3)) with
29 . 0 29 . 0 43 . 0 1 , 1 AlI ; 23 . 0 05 . 0 93 . 0 2 , 1 AlI ; 23 . 0 05 . 0 93 . 0 1 , 2 AlI ; 23 . 0 47 . 0 93 . 0 2 , 2 AlI ; 33 . 0 33 . 0 33 . 0 1 , 3 AlI ; 33 . 0 33 . 0 33 . 0 2 , 3 AlI ; 33 . 0 33 . 0 33 . 0 3 , 3 AlI ; 33 . 0 33 . 0 33 . 0 1 , 4 AlI ; 33 . 0 33 . 0 33 . 0 2 , 4 AlI ; 33 . 0 33 . 0 33 . 0 1 , 5 AlI ; 33 . 0 33 . 0 33 . 0 2 , 5 AlI
4.3 Phases 4: Aggregation of the relative weights of the different hierarchical levels
Phase 5 of the AHP algorithm allows to obtain the vector of relative importance of the alternatives (CFPs) with regards to the general objective. From the obtained results in phases 2, 3, 4 by carrying out matrix products we obtain the following matrix which provides the importance of the alternatives (CFP1, CFP2, CFP3) (represented by the rows in the above AlCr matrix) with regards to each criterion (C1, C2, …, C5) (represented by the columns in the above AlCr matrix).
33 . 0 33 . 0 33 . 0 33 . 0 33 . 0 33 . 0 33 . 0 02 . 0 22 . 0 33 . 0 05 . 0 23 . 0 33 . 0 93 . 0 55 . 0 AlCr 4.4 Results
Considering this matrix and the vector of relative importance of the criteria (CrOg), above obtained, the following results are obtained from the performance module of each holon ‘As seen in table 5’. It allows the calculation of the relative importance vector of the latest level (Alternatives (CFPs) : Al) compared to the first level (General Objective : GOb):
21 . 0 22 . 0 57 . 0 AlGOb
The same calculations are done for suppliers S2 and S3. Table 5 presents the final result for all suppliers. As one can notice on the table, supplier S1 is capable of answering CFP1. It is thus placed on the first rank of its priority vector. Supplier S2 is more competent for CFP3 and supplier S3 is more successful in CFP2. Each of the suppliers proceeds to the calculation of its individual performance for the CFP classified as the first one in the preferences vector to send its answer on the network.
The performance of the Call For Proposal classified as the first in the preferences vector of each supplier allow the supplier to bid only if he is ranked as the best in comparison of the answer circulating on the network. The associated performance to this kind of Calls For Proposals allows assigning Calls For Proposals, obtained by emergence, to the various suppliers participating in the negotiation. The first supplier who bids is considered to be the best until another provides a better answer. In this example, supplier S1 is better with regard to CFP1. He calculates the individual performance and he sends his bid with his performance on the network. The same process will be followed by the other suppliers S2 and S3.
5 Conclusion and discussions
If the optimization of logistic networks is to be implemented efficiently, a change in attitude and philosophy is needed. We have proposed a decentralized self-organized control model based on the concept of holarchic system that aims at improving the customers-suppliers relationship. The decentralized self-organized control model allows a balance to be achieved between load and capacity at the supplier level, and produces a smoothing of the load curve among the various suppliers with the long-term objective of establishing a fair system among the suppliers on the network. The proposed approach also produces a sharing of the earnings, an optimizing of resources, reduced dysfunctions, and increased productivity in the whole supply chain from the supplier to the customer.
This paper details more particularly the Performance Module of a holon. Indeed, the notion of industrial performance is complex. Besides productivity other forms of performance have gradually imposed themselves, induced by a competitiveness based not only on the costs but also on the quality of the products / services and especially on the delays. In this context, the performance cannot any longer be restricted to cost reduction and to
an increase of the volume of production. It requires a multi-criteria approach. This paper, proposes quantifying an individual evaluation of each potential supplier biding to Calls For Proposals emitted by the customer, according to rules and criteria that are impartial and common to all. Each supplier has therefore become self organized.
Improving customers-suppliers relationships is of paramount importance to stay competitive in today’s market. Over the last years, companies have been forced to improve their customers-suppliers relationships because customers are demanding better and better products and services. And if customers do not receive what they want from one supplier, they have many others to choose from. In this paper, the proposed approach involves company reorganization. Thus, it is necessary to guide companies in order to help them to manage change effectively. As it is known change can be viewed from two perspectives: from those implementing the change and from the recipients of change. With our proposal we deal with those that will be the executive demanding the change and with those that will be the front line employee who may be unsure why a change is even needed. Like any change, the proposed approach also implies a socio-cultural challenge resulting from the severe organizational effects on the involved people, which many lead them to react against those changes (Reijers and Limam Mansar 2004). This challenge is also found in Business Process Reengineering (BPR).
The proposed approach is an innovative approach; it involves changes in the customers-suppliers relationships practices. An industrial case study requires that several companies, of the same economic sector, in direct competition, accept to belong to a system of partnership. Currently, we work on this point in order to obtain the necessary data but it is a work of long duration. The goal of this paper is to make clear, through the presented example, the relevance of the proposal to industrial practice. We detailed the operation in order to help managers to apply our proposal. As BPR was introduced in manufacturing/service industries with the objective of changing the management of the supply chain (Gunasekaran and Nath 1997), we can study the possible link between BPR and the application of the proposal. The business process has to undergo fundamental changes to improve productivity and quality. It is also the case with the proposed approach. The companies are not opposed with our proposal, but as BPR, it requires time to be applied. Many papers present their ideas and findings on BPR through a focus on
logistics; partnership sourcing and electronic data interchange (Maull and Childe 1994). So in the future we will work on linking BPR with our approach in order to facilitate the application of our proposal.
Currently, we mainly work, on:
The communication module: indeed, we have to manage the communications between the different holons as well as the sharing of data allowing to implement the communication of the information. The complete system being distributed we exploit the communication environment using the standard HLA (High-Level Architecture) which furthermore responds to the question of search for interoperability.
The addition of a simulation module to the performance module: the evaluation of performance is based on a multi-criteria analysis. The criteria are of qualitative and\or quantitative nature and require a knowledge of the past, present and future state of the system. The values of the criteria concerning the future state of the system could be obtained by simulating the model of this system (initialized by its present state). The simulation can generate and test several solutions and compare them, to obtain the best possible respond that the supplier can hold.
6 References
BERRAH, L., and VERNADAT, F., 2001, Perception et évaluation de la production, approche de la performance dans le pilotage. In. Hermes (ed) Pilotage des systèmes de production, pp. 1–26.
BONGAERTS, L., MONOSTORI, L., MCFARLANE, D., and KADAR, B., 2000, Hierarchy in distributed shop floor control. Computers In Industry, 43, 123–137.
BONNEFOUS, C. and COURTOIS, A. 2001, Indicateurs de performances (Hermes ed.).
BURLAT, P. BESOMBES, B., DESLANDRES, V., 2003, Constructing a typology for networks of firms. Production
Planning & Control, 14, (5), 399–409.
CHEN, K.L., CHEN, K.S., and LI, R.K., 2005, Suppliers capability and price analysis chart. International Journal of
Production Economics, 98, 315–327.
CHOI, T.Y., and HARTLEY, J.L., 1996, An exploration of supplier selection practices across the supply chain. Journal of
Operations Management, 14, 333–343.
D’AMOURS, S., JABIRI, A., and BOUCHER, S., 2001, Les processus de Sélection, de Certification et d’Evaluation de la Performance des Fournisseurs au sein des Entreprises de Classe Mondiale. 4e Congrès International
Franco-Québécois de Génie Industriel, pp. 875–887.
DAVENPORT, T.H., and BROOKS, J.D., 2004, Enterprise systems and the supply chain. Journal of Entreprise
Information Management, 17, (1), 8–19.
DICKSON, G.W., 1966, An analysis of vendor selection systems and decisions. Journal of Purchasing, 2, (1), 5–17. GUNASEKARAN, A., NATH B., 1997, The role of information technology in business process reengineering.
International Journal of Production Economics, 50, 91–104.
GUNASEKARAN, A., and NGAI, E. W. T., 2004, Virtual supply-chain management. Production Planning & Control, 15, (6), 584–595.
HARKER, P.T. 1989, The art and science of decision making: The Analytic Hierarchy Process: Applications and Studies (Springer-Verlag ed.).
JAYARAMAN, V., SRIVASTAVA, R., and BENTON, W.C., 1999, Supplier selection and order quantity allocation: A comprehensive model. Journal of Supply Chain Management, 35, (2), 50–58.
JOHANNESSEN, S., and SOLEM, O., 2002, Logistics Organizations: Ideologies, Principles and Practice. International
Journal of Logistics Management, 13, (1), 31–42.
KOESTLER, A. 1989, The ghost in the machine, (Arkana ed.), London.
MEKAOUCHE, L., OUNNAR, F., PUJO, P., GIAMBIASI, N., 2005, Self Evaluation of Company’s Performance in Partnership Network. IEMC’05, International Engineering Management Conference, St. John’s, Newfoundland,
Canada, IEEE Catalog Number: 05CH37681C, ISBN: 0-7803-9140-3.
MOVAHEDKHAH, M., and THIEL, D., 2001, Interdépendance causale des indicateurs de performance des industries alimentaires et proposition de modèles dynamiques d’aide à la decision. 3ème Conférence Francophone de
Modélisation et Simulation Conception, Analyse et Gestion des Systèmes Industriels, pp. 949–956.
MAULL, R., AND CHILDE, S., 1994, Business Process Re-engineering: An example from the Banking Sector.
International Journal of Service Industry Management, 5, (3), 26–34.
MURALIDHARAN, C; ANANTHARAMAN, N., and DESHMUKH, S.G., 2002, A multi-Criteria Group Decision-making Model for supplier Rating. Journal of Supply Chain Management, 22–33.
NAKATO, H., and MICHAEL, K., 1998, The relative importance of supplier selection criteria: The case of electronic components procurement in Japan. Journal of Purchasing and Materials Management, April, 19–24.
NARASIMHAN, R., 1983, An analytic approach to supplier selection. Journal of Purchasing and Materials Management, 19, (4), 27–32.
NYDICK R.L., and HILL R.P., 1992, Using the Analytic hierarchy Process to structure the Supplier Selection Procedure.
Journal of Purchasing and Materials Management, Spring, 31–37.
OLHAGER, J., and SELLDIN, E., 2004, Supply chain management survey of Swedish manufacturing firms. International
Journal of Production Economics, 89, 353–361.
OUNNAR, F., 1999, Prise en compte des aspects décision dans la modélisation par réseaux de Petri des systèmes flexibles de production. Thèse Institut National Polytechnique de Grenoble.
OUNNAR, F., and LADET, P., 1999, Managing breakdowns machines: A Petri net model and decision making process.
European Journal of Automation, 33, (8-9), 977–994.
OUNNAR, F., and PUJO, P., 2001, Décentralisation des mécanismes de pilotage de la relation donneurs d’ordres / fournisseurs. 4e Congrès International de Génie Industriel, pp. 1175–1185.
OUNNAR, F., and PUJO, P., 2005, Supplier evaluation process within a self-organized logistical network. International
Journal of Logistics Management, 16, (1), 159–172.
PEARSON, J.N., and ELLRAM, L.M., 1995, Supplier selection and evaluation in small versus large electronics firms.
Journal of Small Business Management, October, 53–65.
PUJO, P., and BRUN-PICARD, D., 2001, Pilotage sans création de plan prévisionnel, ni d’ordonnancement préalable. In. Hermes (ed.) Méthodes du Pilotage des Systèmes de Production, pp. 130–162.
REIJERS, H.A., LIMAM MANSAR, S., 2005, Best practices in business process redesign: an overview and qualitative evaluation of successful redesign heuristics. Omega, 33, (4), 283–306.
RONG, C., TAKAHASHI, K., and WANG, J., 2003, Enterprise waste evaluation using the analytic hierarchy process and fuzzy set theory. Production Planning & Control, 14, (1), 90–103.
SAATY, T.L. 1980, The Analytic Hierarchy Process, (Mc Hill).
SAATY, T.L. 1996, Multicriteria Decision Making: The Analytic Hierarchy Process, (RWS Publications Pittsburgh). SELMER, C. 1998, Concevoir le tableau de bord, Outil de contrôle, de pilotage et d’aide à la décision, (Dunod Ed.). SHIN, H., COLLIER, D., and WILSON, D., 2000, Supply Management orientation and Supplier/buyer performance.
Journal of Operation Management, 18, 317–333.
SMITH, R.G., 1980, The contract net protocol: high level communication and control in a distributed problem solver. IEEE Trans. on Computers, 29, 1104–1113.
TAN, K.C., KANNAN, V.R., AND HANDFIELD, R.B., 1998, Supply Chain Management: Supplier performance and firm performance. International Journal of Purchasing and Materials Management, 34, (3), 2–9.
THOMAS, Y.C., and JANET, L.H., 1996, An exploration of supplier selection practices across the supply chain. Journal
of Operations Management, 14, 333–343.
VARGAS, L.G., 1990, An Overview of the Analytic Hierarchy Process and its Applications. European Journal of
Operational Research, 48, 2–8.
WEBER, C.A., Current, J.R., and Benton, W.C., 1991, Vendor selection criteria and methods. European Journal of
Operational Research, 50, 2–18.
WEDLEY, W.C., 1990, Combining Qualitative and Quantitative Factors – An Analytic Hierarchy Approach. Socio
Economic Planning Sciences, 24, (1), 57–64.
7 List of figures and tables
Figure 1 Choice and selection of indicators
Figure 2 Example hierarchical process of decision-making
Table 1 CFPs characteristics
CFP1 CFP2 CFP3
Broadcasting entity Customer Customer Customer
Negotiation delay 1 2 2 Delivery delay 10 15 20 Quantity 1000 2000 2000 G_Ob C1 C2 C3 C4 C5 I11 I12 I21 I22 I31 I32 I33 I41 I42 I51 I52 CFP1 CFPi … ….. CFPn General Objective Criteria level Indicators level Alternatives level
(Calls For Proposals) …..
… A l l o w a n c e o f a m a n u fa c t u r in g c o s t A llo w a n c e o f a d e liv e r y c o s t A llo w a n c e o f d e liv e r y t im e s C o m p lia n c e t o a r e f e r e n t ia l R a t e o f c u s t o m e r s a t is f a c t io n R e s p e c t o f d e liv e r y t im e s A llo w a n c e o f a d e f e r r e d p a y m e n t C o n f o r m it y in q u a n t it y o f t h e o r d e r s A llo w a n c e o f a le a d t im e R a t e o f c o n f o r m it y D e g r e e o f p r iv ile g e C o s t o f t h e o r d e r C o s t o f t h e d e l i v e r y D e l i v e r y t i m e L e a d t i m e C o n f o r m i t y o f p r o d u c t s / s e r v i c e s E v a l u a t i o n o f t h e i n t e r n a l q u a l i t y s y s t e m s P u n c t u a l i t y R e s p e c t f o r t h e q u a n t i t i e s o r d e r e d E a s y t e r m s C o n f o r m i t y o f t h e o r d e r s E v a l u a t i o n o f t h e p a r t n e r r e l a t i o n s h i p E f f i c i e n c y o f t h e m a n a g e m e n t o f t h e o r d e r s E f f i c i e n c y o f t h e o r d e r i n t e r m o f C o s t E f f i c i e n c y o f t h e o r d e r i n t e r m o f D e l a y E f f i c i e n c y o f t h e o r d e r i n t e r m o f Q u a l it y E f f i c i e n c y o f t h e p a r t n e r c o m p a n i e s C a p a c i t y o f a s u p p lie r to m e e t t h e n e e d s o f a c u s to m e r D e liv e r y a t t h e b e s t p r ic e D e liv e r y a s s o o n a s p o s s ib le D e liv e r y in q u a lit y R e s p o n s e t o t h e d e m a n d F ie ld o f m e a s u r e m e n t O b je c t i v e s V a r ia b l e s P a r a m e t e r s I n d i c a t o r s A l l o w a n c e o f a m a n u fa c t u r in g c o s t A llo w a n c e o f a d e liv e r y c o s t A llo w a n c e o f d e liv e r y t im e s C o m p lia n c e t o a r e f e r e n t ia l R a t e o f c u s t o m e r s a t is f a c t io n R e s p e c t o f d e liv e r y t im e s A llo w a n c e o f a d e f e r r e d p a y m e n t C o n f o r m it y in q u a n t it y o f t h e o r d e r s A llo w a n c e o f a le a d t im e R a t e o f c o n f o r m it y D e g r e e o f p r iv ile g e C o s t o f t h e o r d e r C o s t o f t h e d e l i v e r y D e l i v e r y t i m e L e a d t i m e C o n f o r m i t y o f p r o d u c t s / s e r v i c e s E v a l u a t i o n o f t h e i n t e r n a l q u a l i t y s y s t e m s P u n c t u a l i t y R e s p e c t f o r t h e q u a n t i t i e s o r d e r e d E a s y t e r m s C o n f o r m i t y o f t h e o r d e r s E v a l u a t i o n o f t h e p a r t n e r r e l a t i o n s h i p C o s t o f t h e d e l i v e r y D e l i v e r y t i m e L e a d t i m e C o n f o r m i t y o f p r o d u c t s / s e r v i c e s E v a l u a t i o n o f t h e i n t e r n a l q u a l i t y s y s t e m s P u n c t u a l i t y R e s p e c t f o r t h e q u a n t i t i e s o r d e r e d E a s y t e r m s C o n f o r m i t y o f t h e o r d e r s E v a l u a t i o n o f t h e p a r t n e r r e l a t i o n s h i p E f f i c i e n c y o f t h e m a n a g e m e n t o f t h e o r d e r s E f f i c i e n c y o f t h e o r d e r i n t e r m o f C o s t E f f i c i e n c y o f t h e o r d e r i n t e r m o f D e l a y E f f i c i e n c y o f t h e o r d e r i n t e r m o f Q u a l it y E f f i c i e n c y o f t h e p a r t n e r c o m p a n i e s C a p a c i t y o f a s u p p lie r to m e e t t h e n e e d s o f a c u s to m e r D e liv e r y a t t h e b e s t p r ic e D e liv e r y a s s o o n a s p o s s ib le D e liv e r y in q u a lit y R e s p o n s e t o t h e d e m a n d F ie ld o f m e a s u r e m e n t O b je c t i v e s V a r ia b l e s P a r a m e t e r s I n d i c a t o r s
Delay Cost Quality Reliability Strategy Delay 1 1 1 5 5 Cost 1 1 1 5 5 Quality 1 1 1 5 6 Reliability 0.2 0.2 0.2 1 1 Strategy 0.2 0.2 0.2 1 1
Table 2 Relative importance’s matrices (criteria)
I41 I42
I41 1 0.33
I42 3 1
Table 3 Relative importance’s matrices (indicators)
Supplier 1 Supplier 2 Supplier 3
CFP1 CFP2 CFP3 CFP1 CFP2 CFP3 CFP1 CFP2 CFP3 I11 1 10 20 10 20 1 20 1 10 I12 1 10 20 10 20 1 20 1 10 I21 1 10 20 10 20 1 20 1 10 I22 1 10 20 10 20 1 20 1 10 I31 0,99 0,75 0,5 I32 9 5 3 I33 0,99 0,75 0,5 I41 0,99 0,75 0,5 I42 0,99 0,75 0,5 I51 9 9 5 5 3 3 I52 9 9 5 5 3 3
Table 4 Indicators’ values
Customer Supplier 1 Supplier 2 Supplier 3 Emit Calls For
Proposals CFP1, CFP2 and CFP3 3 2 1 CFP CFP CFP 2 1 3 CFP CFP CFP 3 1 2 CFP CFP CFP
Table 5 Classification of Calls For Proposals (CFPs)
I11 I12 I11 1 3 I12 0.33 1 I21 I22 I21 1 3 I22 0.33 1
I31 I32 I33
I31 1 3 3 I32 0.33 1 1 I33 0.33 1 1 I51 I52 I51 1 0.2 I52 5 1