HAL Id: halshs-00178583
https://halshs.archives-ouvertes.fr/halshs-00178583
Submitted on 11 Oct 2007HAL is a multi-disciplinary open access archive for the deposit and dissemination of sci-entific research documents, whether they are pub-lished or not. The documents may come from teaching and research institutions in France or abroad, or from public or private research centers.
L’archive ouverte pluridisciplinaire HAL, est destinée au dépôt et à la diffusion de documents scientifiques de niveau recherche, publiés ou non, émanant des établissements d’enseignement et de recherche français ou étrangers, des laboratoires publics ou privés.
EMU enlargement towards CEEC’s : risks of
sector-based and geographic asymmetric shocks
Jérôme Trotignon
To cite this version:
Jérôme Trotignon. EMU enlargement towards CEEC’s : risks of sector-based and geographic asym-metric shocks. 2003. �halshs-00178583�
GATE
Groupe d’Analyse et de Théorie
Économique
UMR 5824 du CNRS
DOCUMENTS DE TRAVAIL - WORKING PAPERS
W.P. 03-09
EMU enlargement towards CEEC’s : risks of
sector-based and geographic asymmetric shocks
L’Elargissement de l’UEM aux PECO : quels risques de
chocs asymétriques
sectoriels et géographiques ?
Jérôme TROTIGNON
Décembre 2003
GATE Groupe d’Analyse et de Théorie Économique
UMR 5824 du CNRS
93 chemin des Mouilles – 69130 Écully – France B.P. 167 – 69131 Écully Cedex
Tél. +33 (0)4 72 86 60 60 – Fax +33 (0)4 72 86 60 90 Messagerie électronique [email protected]
EMU enlargement towards CEEC’s : risks of sector-based and geographic asymmetric shocks
L’Elargissement de l’UEM aux PECO : quels risques de chocs asymétriques sectoriels et géographiques ?
Jérôme Trotignon
Keywords : Central and Eastern European countries, external asymmetric shock, Kenen’s
criterion, optimum currency area, symmetry of export structures.
Mots-clés : critère de Kenen, chocs asymétriques externes, Pays d’Europe centrale et orientale,
symétrie des structures d’exportation, zone monétaire optimale.
JEL Classification : F15, F33, F36 Abstract
The future membership of CEECs in the eurozone involves the risk of external asymmetric shocks, due to too strong a dependence on one sector or one customer country. By defining two indicators - sector-based and geographic - of exposure to shocks, taking into account the symmetry of the export structures of a candidate state with the EMU and the opening rate of the candidate state, we are able to draw up a classification of countries according to the fulfillment of Kenen’s criterion, revised and transposed to the geographic variety of exports. The results, compared with those of the two countries of the EMU which are most sensitive to sector-based and geographic shocks (Finland and Ireland), testify to a generally pronounced exposure to shocks. An inventory of the pairs country / branch and country / destination at the origin of shocks with strong macroeconomic impact shows that Bulgaria and Slovakia, and even more Estonia and Latvia, are exposed to major risks. Thus, these two small economies would be well advised to create a cyclical stabilization fund before envisaging joining the EMU. Against the thesis of the endogeneity of the OCAs (optimum currency areas), this recommendation remains valid, insofar as the increase in the share of intra-industry trade between the EMU and a candidate state does not necessarily entail a convergence of multilateral sector-based export structures.
Résumé
La future adhésion des pays de l’Est à la zone euro met en avant le risque de choc asymétrique externe, dû à une trop forte dépendance sur un secteur ou un pays client. Nous construisons deux indicateurs – sectoriel et géographique - d’exposition aux chocs, à partir de la symétrie des structures d’exportation d’un pays candidat avec l’UEM et du taux d’ouverture du pays candidat. Cela nous permet d’établir un classement des pays en fonction de la réalisation du critère de Kenen reformulé, et transposé à la diversité géographique des exportations. Les résultats, comparés à ceux des deux pays de l’UEM les plus sensibles aux chocs sectoriel et géographique (la Finlande et l’Irlande), témoignent d’une exposition généralement prononcée. Un inventaire des couples pays/branche et pays/destination à l’origine des chocs à fort impact macroéconomique montre que la Bulgarie et la Slovaquie, et plus encore l’Estonie et la Lettonie, concentrent les risques majeurs. Ces deux petites économies auraient donc intérêt à créer des fonds de stabilisation conjoncturels avant d’envisager leur adhésion à l’UEM. Contraire à la thèse de l’endogénéité des ZMO (zones monétaires optimales), cette recommandation reste valable, dans la mesure où l’augmentation de la part du commerce intrabranche entre l’UEM et un pays candidat ne se traduit pas nécessairement par une convergence des structures sectorielles multilatérales d’exportation.
Introduction
The European Union’s (EU) enlargement towards Central and Eastern European countries (CEECs) paves the way for their participation in the European Monetary Union (EMU). One of the criteria for EU membership is the acceptance of the judicial community framework, which will lead them to apply the provisions of the Treaty of Maastricht concerning the preparation for the EMU. The CEECs’ joining the EMU depends mainly on the fulfillment of nominal convergence criteria. But there is no prerequisite on the traditional real criteria defining the optimality of a currency area, whether it be criteria of prevention of asymmetric shocks (such as sector-based diversification in P. Kenen), or criteria of absorption of these shocks (such as labor mobility in R. Mundell). The more recent approaches to the theory of optimum currency areas (OCAs), which estimate the symmetry of shocks and the correlation of economic cycles between member states of the same monetary union, are not taken into account either.
This gap could have serious consequences : in case of an asymmetric shock with strong macroeconomic impact, CEECs, once they have become members of the EMU, will no longer have the room for maneuver afforded today by the economic policy. It will no longer be possible to absorb a eurozone-related asymmetric shock, either by cutting national central banks’ prime interest rates, or by depreciating national currencies. As for the budget policy, it will be constrained by the provisions of the Stability and Growth Pact, and in particular by the ceiling for public deficit of 3 per cent of GDP, which will limit the action of automatic tax stabilizers. Joining the EMU could then mean shock adjustments being made to the detriment of employment. It would therefore be necessary to examine if each candidate state forms an OCA with the eurozone, so as to assess if, within the frame of the monetary union, they will have the means to prevent or to absorb asymmetric shocks, each of these means corresponding to the fulfillment of a particular OCA criterion.
However, this approach, which takes into consideration each country and each criterion in turn, is not really satisfactory. In practice, none of the criteria can be perfectly fulfilled. And it is impossible to define a degree of minimal satisfaction for each of them, beyond which joining the monetary union would be desirable (for example, a given figure for the indicator of sector-based diversification of exports or of labor mobility). This reflects the non-operational character of the OCA theory. The best we can do is to observe a tendency towards the fulfillment of the criteria, expressing a tendency as regards the sustainability of participation in the union. It is, however, appropriate to set up a classification of candidate states for a monetary union, according to the degrees of satisfaction of the various conditions of optimality.
This paper follows such a method. We propose a classification of the 10 Central and Eastern candidate states for the EU and of Turkey. This classification is based on the fulfillment of Kenen’s criterion. This single choice enables us to further develop this author’s original approach. We will revise the criterion of sector-based diversification of exports, and we transpose the method adopted to the geographic variety of foreign sales. In this way, it will be possible to estimate the risk of asymmetric external shocks, whether they be sector-based (due to strong dependence on one or several products), or geographic (due to strong dependence on one or several customer countries).
We will begin by defining two indicators of exposure to external asymmetric shocks, by balancing two indicators of symmetry (sector-based and geographic) of the sales of the candidate state and of the EMU with the candidate state’s ratio of exports to GDP. Both indicators are then calculated for the period 1993-2000 and for the 11 countries mentioned, following the CHELEM1 database. We thus bring out the economies whose sales by branch and/or by destination have an asymmetric general profile. The classification established enables us to isolate countries that had obviously better wait before integrating the monetary union. We will then determine for which products and which particular customers these economies are most exposed. Each of these products or customers represents a potential source of external asymmetric shock, a measure of the macroeconomic impact of which we propose.
Such an approach is original. The symmetry of trade geography within monetary unions is not the subject of systematic study, while the asymmetries noticed can be very significant, as shown by the Irish case. The symmetry of production structures is most often envisaged from the angle of the progression of intra-industry trade, which does not necessarily testify to a convergence of multilateral export structures.
Elaboration of indicators and classification of candidate states according to
their exposure to shocks
From Hirschman’s index to the indicator of exposure to external asymmetric shocks
The theory of optimum currency areas was developed in the 60s, each author putting forward a specific criterion of optimality. In « The theory of optimum currency area : an eclectic view », P. Kenen (1969) echoes the contributions of R. Mundell (1961) and of R. MacKinnon (1963). His idea is that the diversification in production of a member state of a single-currency group, which is reflected in that of its exports to the whole world, minimizes the macroeconomic impact of an external shock. Many sector-based shocks occur, such as shocks of external demand, but they only call for minor adjustments. Furthermore, because of the presence of a large number of sectors, on average positive shocks compensate for negative shocks. Therefore, economies with a multiform structure of production are good candidates for monetary unions, whereas economies concentrated on a small number of activities are prone to strong macroeconomic disturbances in case of a sector-based shock.
1
Symmetry of export structures by branch and by destination
A direct application of Kenen’s thesis consists in calculating national indicators of multilateral sector-based diversification of exports, following Hirschman’s method2. It is however partly inadequate.
Comparing the Hirschman indexes of candidate states and of the EMU can be misleading. If some national indicators turned out to be close to that of the EMU by showing a low concentration, we might conclude that there are no risks of a sector-based asymmetric shock. But such a conclusion would be incorrect : a similar measure of diversification for two economies can indeed mask asymmetries of the two structures of export by branch. It is thus advisable to calculate another indicator, bilateral this time, and which makes it possible to estimate, for every candidate state, the symmetry of the structure of its exports with that of the EMU. The Finger index meets these expectations (cf. its mode of calculation in box 1).
Box 1 The indicator of symmetry of exporting branches
The symmetry indicator S1 of the exporting branches of two countries A and B, or of a
country A in relation to the group of its partners B (i.e. a candidate state and the EMU in the case studied), is calculated as follows.
Let Ai = Xai/Xa
.
be the sales of country A in products of branch i on its total exports.Let Bi = Xbi/Xb
.
be the sales of country or zone B in products of branch i on its total exports. nS1 = ½ ∑| Ai - Bi | i = 1
S1 varies from 0 to 1. If A and B exported the same share (Ai = Bi whatever i) for each branch,
the sum of the absolute values and thus S1 would equal 0 (perfect symmetry and absence of asymmetric branch shocks). If the exports of A (or B) systematically came from a branch including no product exported by B (or A), the sum of the absolute values would equal 2 and S1 would equal 1 (perfect asymmetry and strong exposure to shocks).
The indicator S1 (just like the indicator S2 of box 2) is in accordance with J. M. Finger’s
approach. Finger’s index equals the sums of the minima for A and B of the shares of each branch in total exports, which corresponds to (1 – S1). A value of 0 then signals perfect
asymmetry and a value of 1 indicates perfect symmetry.
Kenen’s analysis is based on the sole diversification of exporting branches. It is nevertheless easily transposable to the diversification of foreign markets. Just as an economy strongly
2
The Hirschman index (H) is equal to the square root of the sum of squares of the shares of all exports attributable to every product. It is contained between 0 and 1, from perfect diversification to concentration on a single product.
n
H =
[
∑(xi)2]
1/2 i = 1exposed to a small number of branches is prone to strong macroeconomic disturbances, a country which has few trading partners is sensitive to a recession hitting one of them. The higher the geographic concentration of exports, the more damaging the fall in a partner’s demand. Just like branch diversification, the geographic diversification of exports minimizes the adjustments required by this type of shock. In the long run, it also allows a compensation of negative shocks by positive shocks.
Hirschman’s method could be used to calculate an indicator of multilateral diversification of foreign markets, but with the drawbacks underlined above. A similar result of indicator for an Eastern country and the eurozone would not necessarily mean an identical list of export destinations, nor an equivalent percentage of sales allotted to each partner. We shall thus use an indicator that measures the symmetry of the structures of exports by destination of a candidate state and of the EMU (cf. box 2 for its mode of calculation).
Box 2 The indicator of symmetry of exporting destinations
The indicator S2 of geographic symmetry of exports of two countries A and B, or of a country
A in relation to the group of its partners B (in our case a candidate state and the EMU), is calculated according to the same method as the indicator S1 of symmetry of exporting
branches.
Let Aj = Xaj/Xa
.
be the exports of country A to country J on its total exports (except exportsto the partner or the group of partners).
Let Bj = Xbj/Xb
.
be the exports of country or zone B to country J on its total exports (exceptexports towards the partner).
n
S2 = ½ ∑| Aj - Bj | j = 1
S2 varies from 0 to 1. If A and B exported the same share (Aj = Bj whatever j) to every
destination elsewhere in the world, the sum of the absolute values and thus S2 would equal 0
(perfect symmetry and absence of geographic asymmetric shocks). If A (or B) systematically exported to a destination to which B (or A) did not export, the sum of the absolute values would equal 2 and S2 would equal 1 (perfect asymmetry and strong exposure to shocks).
Taking into account ratios of exports to GDP
The indicators of a sector-based and geographic symmetry of exports allow a more reliable measure of asymmetries between partners than the comparison of Hirschman’s indexes. But if we wish to analyze the risk of an external asymmetric shock for a candidate state in relation to the EMU, it is necessary to introduce ratios of export to GDP3 into the reasoning. Indeed, the
3
We could consider the difference in the ratios of exports to GDP between a candidate state and the EMU. But our objective is to establish a classification of the eleven countries concerned, and the latter is not affected by the sole consideration of the candidate state’s ratio of exports to GDP.
macroeconomic impact of an external shock depends just as much on the asymmetry of the distribution of foreign sales than on the ratio exports / GDP of the economy which is affected. A high asymmetry will not be too worrying if it is combined with a low ratio, but it will be doubly so should the opposite occur. We thus define two indicators of exposure to external – sector-based and geographic – asymmetric shocks, by balancing the two previous indicators of symmetry by the candidate state’s ratio of exports to GDP (cf. box 3).
Box 3 Indicators of exposure to external asymmetric shocks
The two previous indicators (boxes 1 and 2) give the synthesis of asymmetries existing between the export structures, by branch and by destination, of a candidate state and of the EMU. To estimate the risk of an external asymmetric shock, it is necessary to balance these indicators by the candidate state’s ratio of exports to GDP, because the macroeconomic impact of a sector-based or geographic shock is all the greater as the ratio of exports to GDP is high.
By taking the ratio exports / GDP in percentage, we obtain the indicators E1 of exposure to
sector-based external shocks and E2 of exposure to geographic external shocks :
E1 = 100
.
S1.
(Xcw / GDPc )E2 = 100
.
S2.
(Xc (w-z) / GDPc )Where GDPc is the candidate state’s GDP.
And where Xcw and Xc(w-z) are respectively the candidate state’s exports to the whole world
and to the whole world except the eurozone.
Taking into account extra-EMU exports for the calculation of E2 can be justified as follows :
when one or several member states of the EMU experience a sudden recession leading to a drop in their partners’ exports, the asymmetric shock within the monetary union hits the former and not the latter, just as the necessity for adjustment is incumbent upon the former and not the latter. It is thus advisable to exclude candidate states’ sales to the EMU to appreciate their risk of geographic asymmetric shocks.
If we admit theoretical borders from 0 to 100 % for the ratio of exports to GDP, with indicators S1 and S2 varying within the interval [0,1], indicators of exposure to shocks vary
within the interval [ 0,100 ] (from the smallest exposure to the strongest exposure).
An often pronounced exposure to shocks
Indicators of exposure to external asymmetric shocks depend on the convergence of the export structures of the EMU and of candidate states, as well as on the latter’s trade opening. Both of these factors are greatly influenced by a series of agreements coinciding with the decay of the centralized system of economic planning and with the dismantling of the COMECON, which have resulted in a fall in Central and Eastern countries’ trade with the ex-USSR. These agreements contribute to liberalizing these countries’ foreign trade and to developing their exchanges, in particular with the EU : first-generation economic and trade
agreements variously concluded from the late 80s onwards, granting by the Union of the clause of the most favored nation for tariffs, extension of the SGP community mechanism (System of Generalized Preferences), and second-generation agreements signed over the period 1991-93. The latter, also known as « European agreements », set up, over a 10-year period, bilateral free trade areas for manufactured goods, between the Union and each of its future members. Beyond trade transactions, they liberalize the FDIs between partners.
Non-convergent production structures of exports (1993-2000)
The situation is thus propitious for a renovation of industrial fabrics and a redefining of specializations thanks to the impetus given by West-European firms, which take an active part in privatization programs, create joint ventures with local companies, or integrate them into their sales network by transfer of technology. During the 90s, the most dynamic sectors of export to the European Union were those for which foreign presence was particularly significant (Freudenberg M. and Lemoine F., 1999). We should thus observe, in the middle and long term, a movement of trade opening for countries in transition accompanied by a convergence of their production structures with the Union.
If the movement of trade opening was confirmed from the period 1993-1996 to the period 1997-2000, the same is not true of the convergence of production structures with the EMU, considered here from the angle of the structure of exports by branch. With the exception of Poland (and also of Turkey), the indicators of symmetry of exports by branch stagnated or experienced a slight decrease from one period to the next (cf. table 1). Such a result may seem surprising, since the integration of Central and Eastern economies within the networks of European multinational companies suggests an increase in their intra-industry exchanges with the EMU, which could testify to a growing similarity between production structures. Six CEECs saw their intra-industry trade increase from the period 1993-1996 to the period 1997-2000 4 (in order of absolute progression of the intra-industry indicator : Rumania, Slovenia, the Czech Republic, Latvia, Poland, and Lithuania5). But there is no real contradiction, since the indicators do not follow the same logic : bilateral in the case of intra-industry exchanges, and multilateral for the symmetry of exports by branch. It simply shows that the convergence of bilateral export structures does not necessarily extend to multilateral export structures.
4
When considering the annual average for the period 1997-2000 as against the annual average for the period 1993-1996. Calculations of the author based on a Grubel-Lloyd index - trade balance adjusted - and from the breaking up into 71 branches of the CHELEM database. The method of calculation and all the results are given in appendix.
5
When considering the evolution of the Grubel-Lloyd index – trade balance adjusted – from 1993 to 2000, seven CEECs out of ten experienced an increase in the share of intra-industry exchanges with the UEM, Slovakia being added to the list of the six countries mentioned.
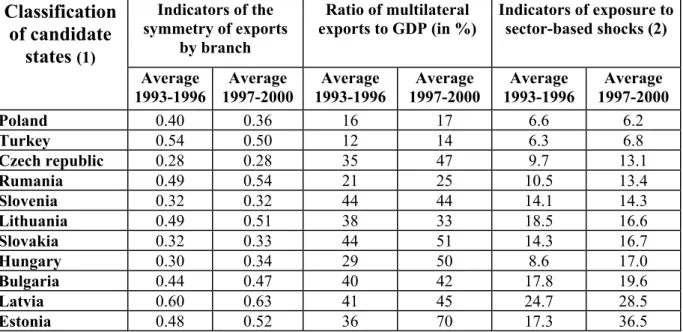
Table 1 Indicators of exposure to sector-based asymmetric shocks
Classification
of candidate
states
(1) Indicators of the symmetry of exports by branch Ratio of multilateral exports to GDP (in %) Indicators of exposure to sector-based shocks (2) Average 1993-1996 Average 1997-2000 Average 1993-1996 Average 1997-2000 Average 1993-1996 Average 1997-2000 Poland 0.40 0.36 16 17 6.6 6.2 Turkey 0.54 0.50 12 14 6.3 6.8 Czech republic 0.28 0.28 35 47 9.7 13.1 Rumania 0.49 0.54 21 25 10.5 13.4 Slovenia 0.32 0.32 44 44 14.1 14.3 Lithuania 0.49 0.51 38 33 18.5 16.6 Slovakia 0.32 0.33 44 51 14.3 16.7 Hungary 0.30 0.34 29 50 8.6 17.0 Bulgaria 0.44 0.47 40 42 17.8 19.6 Latvia 0.60 0.63 41 45 24.7 28.5 Estonia 0.48 0.52 36 70 17.3 36.5(1) From the least to the most exposed country, based on the result of the annual average of the most recent period (1997-2000).
(2) The indicator of exposure to shocks is limited by the values 0 and 100. It equals the product of the indicator of the symmetry of exports by branch, by the ratio of multilateral exports to GDP (expressed in percentage). The column’s results give, for each country, the average of the annual indicators for the two periods. They therefore slightly differ from those that would result from the product of the values of the 1st and 3rd columns and from the product of the values of the 2nd and 4th columns (i.e. the product of the averages for the two periods).
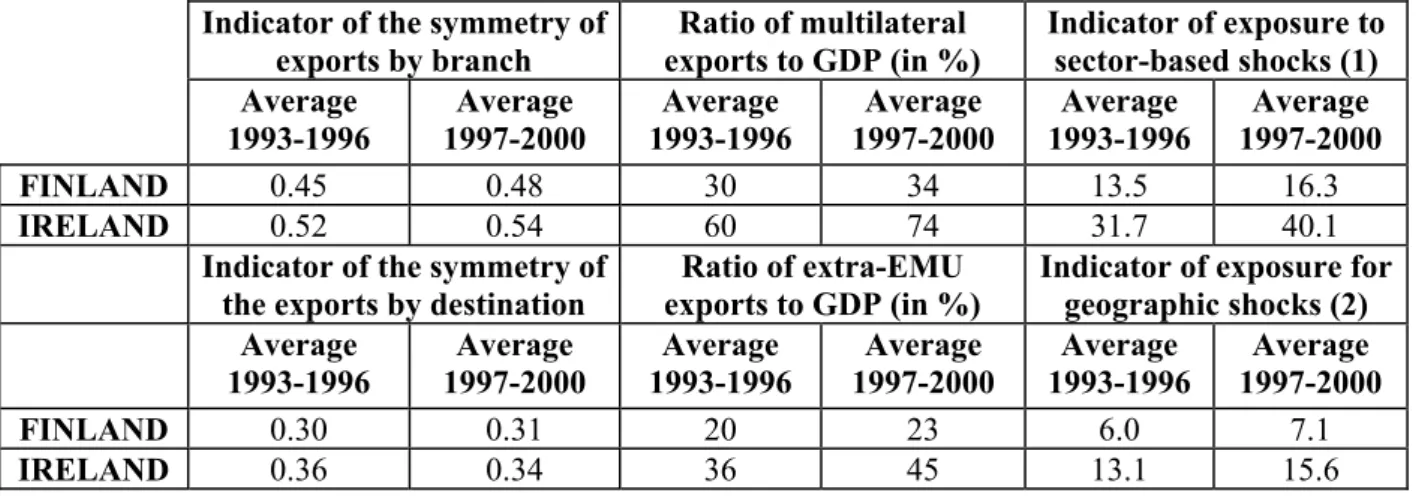
As a general rule, with no improvement of the indicators of symmetry and with a trade opening which intensifies, exposure to sector-based shocks becomes more marked from one period to the next (cf. table 1). The levels reached show strong disparities, but without the traditional cleavage between countries from Central and Balkan Europe. They can be compared with the situation of the two member states of the EMU that are considered most fragile as regards exposure to sector-based and geographic shocks, that is Finland and Ireland (cf. table 3). A majority of CEECs have a degree of exposure which is similar or superior to that of Finland, while remaining lower than that of Ireland.
Baltic States and Slovakia : a strong sensitivity to geographic shocks
Unlike the symmetry of exports by branch, the symmetry of exports by destination generally improves from one period to the next, Poland excluded (cf. table 2). The ratios of extra-EMU exports to GDP do not necessarily go up. In most cases, exposure to shocks does not experience significant change. But the levels reached again reflect significant differences, and with no possible distinction between Central and Balkan European countries. Furthermore, a majority of countries have a pronounced degree of exposure, superior to that of Finland, even far superior in the case of Slovakia and of the three Baltic States. These four countries also have a degree of exposure which is close to or higher than that of Ireland. They already found themselves ranked among the bottom states for sensitivity to sector-based shocks. We shall return to this point in our second part when we shall detail the branches and destinations concerned by the risks of shocks with strong macroeconomic impact.
Table 2 Indicators of exposure to geographic asymmetric shocks
Classification
of candidate
states
(1) Indicators of the symmetry of exports by destination Ratio of extra-EMU exports to GDP (in %) (2) Indicator of exposure to geographic shocks (3) Average 1993-1996 Average 1997-2000 Average 1993-1996 Average 1997-2000 Average 1993-1996 Average 1997-2000 Bulgaria 0.54 0.53 6 5 3.3 2.7 Turkey 0.40 0.38 7 8 2.7 3.0 Poland 0.41 0.46 7 7 2.8 3.3 Rumania 0.50 0.40 12 11 5.8 4.3 Hungary 0.43 0.36 11 18 4.8 6.4 Czech republic 0.56 0.49 17 19 9.3 9.3 Slovenia 0.56 0.55 16 17 9.1 9.3 Lithuania 0.63 0.60 26 22 16.7 13.2 Slovakia 0.76 0.68 27 24 20.5 16 .1 Latvia 0.58 0.51 27 32 15.5 16.3 Estonia 0.64 0.57 23 44 14.9 24.8(1) From the least to the most exposed country, based on the result of the annual average of the most recent period (1997-2000).
(2) Exports to the whole world, eurozone excluded, to GDP, in percentage.
(3) The indicator of exposure to shocks is limited by the values 0 and 100. It equals the product of the indicator of symmetry of exports by destination, by the ratio of extra-EMU exports to GDP (expressed in percentage). The column’s results give, for each country, the average of the annual indicators for the two periods. They therefore slightly differ from those that would result from the product of the values of the 1st and 3rd columns and from the product of the values of the 2nd and 4th columns (i.e. the product of the averages for the two periods).
Table 3 Finland’s and Ireland’s indicators of exposure to sector-based and
geographic shocks
Indicator of the symmetry of exports by branch Ratio of multilateral exports to GDP (in %) Indicator of exposure to sector-based shocks (1) Average 1993-1996 Average 1997-2000 Average 1993-1996 Average 1997-2000 Average 1993-1996 Average 1997-2000 FINLAND 0.45 0.48 30 34 13.5 16.3 IRELAND 0.52 0.54 60 74 31.7 40.1
Indicator of the symmetry of the exports by destination
Ratio of extra-EMU exports to GDP (in %)
Indicator of exposure for geographic shocks (2) Average 1993-1996 Average 1997-2000 Average 1993-1996 Average 1997-2000 Average 1993-1996 Average 1997-2000 FINLAND 0.30 0.31 20 23 6.0 7.1 IRELAND 0.36 0.34 36 45 13.1 15.6
(1) See note (2) on table 1. (2) See note (3) on table 2.
The measure of the potential impact of asymmetric shocks : what are the
major risks ?
Both indicators of exposure to shocks used in the previous part take into account all the existing asymmetries between a candidate state and the EMU, whatever the size of such asymmetries. Their synthetic character does not allow a detailed analysis, branch per branch, or destination per destination. We now propose to isolate the branches and destinations for which the potential macroeconomic impact of an external asymmetric shock is significant, by clarifying at first how to measure the maximal impact of such a shock.
The measure of the maximal macroeconomic impact of a sector-based or geographic shock
To measure the macroeconomic impact of an external asymmetric shock, let us suppose the extreme case of a shock bringing about, from one year to the next, a total interruption of the exports of a candidate state and of the EMU, for a branch or a given destination. In this case, both partners undergo losses equivalent to the ratio of foreign sales corresponding to its GDP (in percentage). Let us consider a shock affecting the candidate state. The degree of asymmetry of the shock is then measurable by the difference between the candidate state’s and the EMU’s ratios. This difference represents in percentage of the GDP the effort of adjustment that the candidate state has to make in relation to the eurozone. Considering our initial supposition, it measures the maximal impact of a shock (see box 4).
Box 4 Maximal impact of a sector-based or geographic asymmetric shock
Export structures differentiated by destination and by branch between each candidate state and the eurozone can be at the origin of asymmetric shocks. We propose to estimate their potential impact. The following formula allows to measure, in percentage of the GDP, the maximal impact (MI) of a sector-based or geographic shock for a given year :
MIczi =
(
(Xci / GDPc)- (Xzi / GDPz))
.
100Where :
- i represents the branch or the destination which causes a fall in exports.
- Xci and Xzi respectively correspond to the exports of the candidate state and of the eurozone
for branch or destination i.
- GDPc and GDPz are the respective gross domestic products of the candidate state and of the
eurozone.
MIczi is the maximal impact of an asymmetric shock relative to branch or destination i. As we
consider the shocks affecting a candidate state with regard to the single currency zone, we obtain a result in percentage of the GDP for the candidate state, which represents the maximal effort of adjustment to be made in case of a shock relative to branch or destination i. The shocks that have the highest impact are listed in graphs 1 and 2.
The calculation of the maximal impact of a shock is based on the hypothesis of a complete interruption of exports by branch or destination, from one year to the next. The results obtained are thus only theoretical ceilings, the impact of a shock depending on the proportion of exports affected, and this proportion never reaching 100 %.
Estonia and Latvia are exposed to major risks
When we make an inventory of the pairs country / branch (graph 1) and country / destination (graph 2) which are likely to be at the origin of shocks with strong macroeconomic impact, Estonia and Latvia are widely represented. As a general rule, these shocks would be more intense than those that would affect Finland but less intense than those that would affect Ireland (cf. graph 3).
The shocks would tend to concern traditional branches
A majority of traditional branches with low technological intensity are concerned by sector-based shocks, such as the ready-made clothes industry for Bulgaria and Rumania or the iron-steel industry for Slovakia. Refined oil products represent a risk for the three Baltic States, and a particularly important one for Estonia and Latvia. Only two branches connected with new technologies appear among the highest potential risks, telecommunication equipment for Estonia and computer equipment for Hungary. The dynamism of Estonian exports of telephones and telecommunication equipment can largely be accounted for by foreign, and notably Finnish, direct investments, which take advantage of differences in wage costs and taxation of profits. Foreign investments, which sharply increased towards Hungary in the electronic sector, also account for potential shocks on computer products. This situation recalls that of Ireland, which was particularly dynamic in the field of electronic FDIs thanks to its integration in the community market, and for which the intensity of a shock on computer equipment would be three times as high as for Hungary (cf. graph 3).
Graph 1 The greatest potential asymmetric shocks Candidate state / Major branch in crisis
In % of the candidate state’s GDP, annual average for 1996-2000
0 2 4 6 8 10 12
Bulgaria / Non fe r. m e tal ind.
Bulgaria / Re ady-m ade clothe s
Es tonia / Té lé com . e quip.
Es tonia / Re f. oil prod.
Es tonia / Non-e dible farm prod.
Hungary / Com pute r e quip. Latvia / Re f. oil products
Latvia / Non-e dible farm prod. Lithuania / Re f. oil prod. Rum ania / Re ady-m ade prod.
Slovak ia / Iron and s te e l
Note : the graph’s results present in percentage of the GDP the measure of the maximal impact (cf. box 4) that a candidate state would undergo in case of a crisis affecting one of its dominant export branches. Only average annual impacts superior to 3 per cent of the GDP over the period 1996-2000, with a minimum of 2 per cent of the GDP a year (with the exception of Hungary / computer equipment in 1996 and of Estonia / telecommunication equipment in 1996 and 1997), have been recorded.
Critical destinations mostly concern future members of the EMU
With the exception of Estonia’s dependence on Russia, which incidentally sharply decreased in the 90s owing to a reorientation of the exchanges with the West6, the destinations implying potential asymmetric shocks concern only countries which, in the short or long run, should join the EMU. The greatest risks reflect the preservation of intense exchanges between Slovakia and the Czech republic, as well as the persistence of trade links between Estonia and Sweden, whose multinationals’ subsidiaries largely contribute to bilateral exchanges.
Candidate states which are most sensitive to geographic shocks (that is those appearing on graph 2) are all part of the first round of enlargement of 2004. It is likely that their upcoming participation in the single market will contribute to diversifying their European partners, by leveling the risk of shock. Should the opposite occur, and in the hypothesis of all current and future member states of the European Union joining the EMU, the problem will take the form of a derived geographic asymmetric shock. The core of the crisis will already be localized within the EMU, and it will be first and foremost the affected country’s task to adjust with regard to its partners of the eurozone. The extent of the adjustment for the country affected by a derived shock, i.e. a drop in exports to the partner hit by the initial shock, will inevitably be of a lesser degree.
Derived shocks may also intervene in case of a crisis affecting the current member states of the EMU. Neither the method of calculation of the indicators of exposure to geographic asymmetric shocks (cf. box 3), nor the research undertaken to discover the greatest potential shocks (cf. graph 2), took this point into account. But if we calculate the indicators of exposure with the ratio of multilateral exports to GDP instead of the ratio of extra-EMU exports to GDP, then the classification of candidate states (cf. table 2) changes noticeably for Bulgaria, which drops from first to sixth place, and for Slovenia and the Czech republic, which both move two places back. This is due to very strong exposure on the Greek market (Bulgaria), the Italian market (Bulgaria and Slovenia) and the German market (the Czech republic).
6
The share of Estonia’s exports to Russia on its total exports gradually decreased from 14 % in 1993 to 3 % in 2000 (versus 1 % for the EMU). It is moreover difficult to distinguish, in the fall in Estonia’s exports to Russia from 1997 to 1998, what was caused by the long-term movement of reorientation of exchanges from what was caused by the sharp decline in the Russian GDP (about 5 % in 1998). The drop in Estonian exports to Russia in 1998 was largely compensated by an increase in its total exports.
Graph 2 The greatest potential asymmetric shocks Candidate state / Major partner in crisis
In % of the candidate state’s GDP, annual average for 1996-2000
0 2 4 6 8 10 12 Slovenia / Croatia
Czech republic / Slovakia
Slovakia / Czech republic
Latvia / United Kingdom
Latvia / Sw eden Latvia / Lithuania Estonia / Sw eden Estonia / Latvia Estonia / Russia Estonia / Lithuania Estonia / United Kingdom
k
Note : the graph’s results present in percentage of the GDP the measure of the maximal impact (cf. box 4) that a candidate state would undergo in case of a crisis affecting a major trade partner. Only average annual impacts superior to 2.5 per cent of the GDP over the period 1996-2000, with a minimum of 2 per cent of the GDP a year, have been recorded.
Graph 3 Finland’s and Ireland’s most intense potential sector-based and geographic shocks
In % of the candidate state’s GDP, annual average for 1996-2000
0 2 4 6 8 10 12 14 16 Finland / Sw eden
Ireland / United States
Ireland / United Kingdom
Ireland / Com puter equipm ent
Ireland / basic org. chem istry Ireland / Pharm aceutical
products Finland / Paper Finland / Telecom . equipm ent
Note : for graph 3, the method of graph 1 has been applied to sector-based shocks and that of graph 2 for geographic shocks.
Conclusion
The results obtained reveal the future EU members’ generally pronounced exposure to external asymmetric shocks with the EMU. Half of the candidate states show a degree of exposure to sector-based or geographic shocks which is more marked than that of Finland, whose export structures are the most concentrated of the eurozone after those of Ireland. Allowing for exceptions, critical destinations all concern future EMU members. Poland and Turkey rank high for both types of shocks, which is more easily explained by their low trade opening than by a convergence of export structures with the EMU. At the bottom of the list, Estonia and Latvia present such sensitivity to trade shocks that it should dissuade them from hastening to join the EMU, even if they are about to meet the nominal convergence criteria. In the absence of a consensus on the creation of a budgetary mechanism of automatic adjustment on the level of the EMU (Italianer A. and Vanheukelen M, 1993), these small economies should, like Finland, create a national stabilization fund that can be activated in case of a shock before joining the EMU.
Such a recommendation goes counter to the thesis of the endogeneity of optimum currency areas. Frankel J. and Rose A. K. (1998, 2000) show that using a single currency is at the origin of an intensification of trade links between partners, which is itself at the origin of a better synchronization of their cycles. It is all the more likely as new exchanges fall within the category of intra-industry trade. The very act of creating a monetary union or joining a union would thus create the conditions of its own success, by reducing the asymmetry of shocks in an endogenous way. For the European Union, this result is qualified but remains valid when we take into account the vertical differentiation of intra-industry exchanges, which are liable to be at the origin of asymmetric shocks of range (Fontagné L., 1999). This paper has shown that the increase in the share of intra-industry trade between a CEEC and the EMU does not entail a convergence of their multilateral export structures in every case. The intensification of intra-industry trade does not represent a guarantee against external sector-based asymmetric shocks. Thus, the idea of an endogenous reduction of the asymmetry of shocks cannot be applied in this case.
Bibliography
Eichengreen B. (1994), “The Optimum Currency Dilemma”, International monetary arrangements for the 21st century - Integrating national economies, The Brookings Institution.
Bayoumi T., Eichengreen B. (1997), “Ever closer to heaven ? An optimum-currency area-index for European countries”, European Economic Review, 41.
Bayoumi T. and Eichengreen B. (1994), “One Money or Many ?”, Princeton Studies in International Finance, n° 76, Princeton University Press.
Bénassy-Quéré A. et Lahrèche-Révil A. (1998), « Pegging the CEECs currencies to the euro », Working paper, CEPII, n° 4.
Boone L. et Maurel M. (1999), « L’Ancrage de l’Europe centrale et orientale à l’Union européenne », Revue économique, vol. 50, n° 6, novembre.
Finger J. M. and Kreinin M. E. (1979), “A Measure of Export Similarity and its Possible Uses“, The Economic Journal, vol. 89, n° 356, December.
Fontagné L. (1999), « Spécialisation et asymétrie des chocs en union monétaire », Revue française d’économie, volume XIV, 2.
Fontagné L. et M. Freudenberg M. (1999), “ Marché unique et développement des échanges ”, Economie et statistique, n° 326-327.
Frankel J. A. (1999), “No Single Currency Regime is Right for All Countries or All Times”, NBER Working Paper, n° 7338, September.
Frankel J. A., Rose A. K. (1998), “ The Endogeneity of the Optimum Currency Area Criteria ”, The Economic Journal, vol. 108, n° 449, July.
Freudenberg M. et Lemoine F. (1999), « Les Pays d’Europe centrale et orientale dans la division du travail en Europe » , Economie internationale, n° 80, 4ème trimestre.
Grubel H. and Lloyd P. (1975), Intra-Industry Trade, MacMillan.
Ishiyama Y. (1975), “The theory of optimum currency areas : a survey”, International monetary fund staff papers, 22.
Italianer A. and Vanheukelen M. (1993), “Proposals for community stabilization mechanisms : some historical applications”, European economy, “The Economics of community public finance”, Reports and studies, n° 5.
Kenen P. (1969), “ The Theory of optimum currency areas : an eclectic view ”, Monetary problems of the international economy, R. Mundell and K. Swoboda, The University of Chicago press.
Krugman P. (1991), Geography an trade, Mit press.
McCallum B. T. (1999), “Theorical Issues Pertaining to Monetary Unions”, NBER Working Paper Series, 7393.
MacKinnon R. I. (1963), “ Optimum currency areas ”, American economic review, vol. 53, June.
Masson P. R. an Taylor M. P. (1993), “Currency Unions : a Survey of the Issues”, in Policy issues in the operation of currency unions, Cambridge University Press.
Mongelli F. P. (2002), “New views on the optimum currency area theory : what is EMU telling us ?”, Working paper, European central bank, n° 138, April.
Mundell R. A. (1961), “ A Theory of Optimum Currency Areas ”, American economic review, vol. 51.
Rose A. K. (2000), “ One money, one market : estimating the effect of common currencies on trade ”, Economic policy, February, Forthcoming.
Tavlas G. (1993), “The “New” Theory of Optimum Currency Areas”, World Economy, 16 (6), November.
APPENDIX
THE EVOLUTION OF CEECs’ INTRA-INDUSTRY TRADE WITH THE EMU - Grubel-Lloyd index (trade balance adjusted) -
1993-1996 (annual average) 1997-2000 (annual average)
Latvia 0.27 0.38 Lithuania 0.31 0.45 Rumania 0.45 0.47 Bulgaria 0.55 0.48 Turkey 0.38 0.49 Estonia 0.60 0.58 Slovakia 0.61 0.61 Hungary 0.72 0.67 Poland 0.56 0.69 Slovenia 0.73 0.75 Czech republic 0.77 0.81
Source : author’s calculations based on 71 branches of the CHELEM database.
The calculation of intra-industry exchanges is traditionally based on the following Grubel-Lloyd index :
GL = 1 - ∑|Xi - Mi| , i varying from 1 to n
∑ (Xi + Mi)
Where Xi and Mi respectively stand for the exports and the imports of branch i.
In case of a trade deficit or surplus, a part of the imports or the exports is not compensated by reciprocal trade. Yet, in the strict sense, to be able to speak of intra-industry (or inter-industry) exchange, it is necessary that similar (or different) products be swapped. The trade balance thus distorts the calculation of the shares of intra-industry and inter-industry trade. The share of intra-industry trade calculated by GL will be all the lower as the trade balance is high. The indicator is thus biased downward. We can correct this bias by calculating the indicator GL’, from which the results of the table above are taken :
GL’ = GL / (1 – k)
With k = |∑ Xi - ∑ Mi|
∑ (Xi + Mi)
If the trade balance (numerator) equals zero, k = 0 and GL = GL’. The higher the trade balance, the closer k is to 1 and the more different GL’ is from GL.