HAL Id: hal-01571288
https://hal.inria.fr/hal-01571288
Submitted on 2 Aug 2017
HAL is a multi-disciplinary open access
archive for the deposit and dissemination of
sci-entific research documents, whether they are
pub-lished or not. The documents may come from
teaching and research institutions in France or
abroad, or from public or private research centers.
L’archive ouverte pluridisciplinaire HAL, est
destinée au dépôt et à la diffusion de documents
scientifiques de niveau recherche, publiés ou non,
émanant des établissements d’enseignement et de
recherche français ou étrangers, des laboratoires
publics ou privés.
Bare-Metal Reservation for Cloud: an Analysis of the
Trade Off between Reactivity and Energy Efficiency
Marcos Dias de Assuncao, Laurent Lefèvre
To cite this version:
Marcos Dias de Assuncao, Laurent Lefèvre. Bare-Metal Reservation for Cloud: an Analysis of the
Trade Off between Reactivity and Energy Efficiency. Cluster Computing, Springer Verlag, In press,
pp.1-12. �10.1007/s10586-017-1094-y�. �hal-01571288�
(will be inserted by the editor)
Bare-Metal Reservation for Cloud: an Analysis of
the Trade Off between Reactivity and Energy Efficiency
Marcos Dias de Assun¸c˜ao · Laurent Lef`evre
Received: – / Accepted: –
Abstract In this work, we investigate factors that can impact the elasticity of bare-metal resources. We anal-yse data from a real bare-metal deployment system to build a deployment time model, then use it to deter-mine how long it takes to deliver requested resources to cloud users. Simulation results show that reservations can help reduce the time to deliver a provisioned cluster to its customer, by enabling machines to be started in advance or be kept powered on when there are impend-ing reservations. Such an approach, when compared to strategies that switch-off idle resources, shows that sim-ilar energy savings can be achieved with much smaller impact on the time to deliver the provisioned clusters.
1 Introduction
Cloud computing has become a popular model for pro-viding IT resources and services to organisations of all sizes [1]. The workload consolidation that clouds pro-vide by virtualising resources and enabling customers to share the underlying physical infrastructure brings benefits such as energy efficiency and better system util-isation. Most cloud providers enable their customers to request resources on demand and pay for their use on a per-hour basis. Such elasticity allows for adjusting the allocated capacity dynamically to meet fluctuating demands.
Though this consolidated model suits most of the to-day’s use cases, certain applications such as those that demand High Performance Computing (HPC) or spe-cialised resources, are not fully portable to this scenario
Inria Avalon, LIP Laboratory ´
Ecole Normale Sup´erieure de Lyon University of Lyon, France
E-mail: {name.surname}@ens-lyon.fr
as they are generally resource intensive and sensitive to performance variations. Many applications still demand homogeneity among computing nodes and predictable network performance. Moreover, certain customers pre-fer bare-metal resources over shared ones for security reasons. The means used by cloud providers to offer cus-tomers with high and predictable performance mostly consist in deploying bare-metal resources or grouping Virtual Machines (VMs) where high network through-put and low latency can be guaranteed. This model contrasts with traditional cloud use cases as it is costly and provides little flexibility regarding workload con-solidation and resource elasticity. Using public clouds or co-locating HPC applications on the same physical
hardware, however, have proven difficult [16,21,30,33].
Over the past, HPC users have been tolerant to the time needed for resources to become available as they generally share large clusters to which exclusive access is made by submitting a job that may wait in queue for a period often longer than the job execution itself. Users of bare-metal services also commonly accept pro-visioning delays that can vary from hours to several days. We do not consider that clouds should adopt a similar queuing model, but we believe that a compro-mise between wait time and on-demand access could be exploited for bare-metal resources in the cloud via resource reservations. Reservations provide means for reliable allocation and allow customers to plan the ex-ecution of their applications, which is key to many use cases that require bare-metal and specialised resources. Current reservation models of public clouds rely on re-questing resources in advance for a long period (i.e. from one to three years) or bidding for virtual machine instances in a spot market.
In this work, we analyse historical data on the pro-vision of bare-metal resources from a real system and
attempt to model the time required by bare-metal de-ployment. Results from discrete-event simulations then demonstrate (i) the energy-saving potential of strate-gies that switch off unused resources and (ii) how reser-vations can help reduce the time to deliver provisioned clusters to their customers, by enabling servers to be started in advance or be kept powered on when there are impending reservations. In summary, the main con-tributions of this paper are to:
– Present an analysis on deployment of bametal re-sources and model the deployment time.
– Evaluate the impact of reservations on the time to deliver clusters of bare-metal resources to customers and the potential energy savings.
The rest of this paper is organised as follows. Section
2 presents background on bare-metal provisioning and
the motivation for resource reservation of bare-metal resources in the cloud. The analysis of historical data on bare-metal deployment and the model are presented
in Section3. Section 4 describes reservation strategies,
whereas Section5presents the experimental setup and
obtained results. Section 6 discusses related work on
resource reservations, whereas Section 7 concludes the
paper.
2 Background and Motivation
Grid’5000 [4] — an experimental platform comprising several sites in France and Luxembourg — provides users with single-tenant environments enabled by bare-metal provisioning and reservations. To utilise the plat-form, a user can either make a request for an advance reservation of computing resources or submit a best-effort request which grants the user access to required resources whenever they become available. Reservations take precedence over effort requests so that a best-effort job can be cancelled if its resources are reserved by another user.
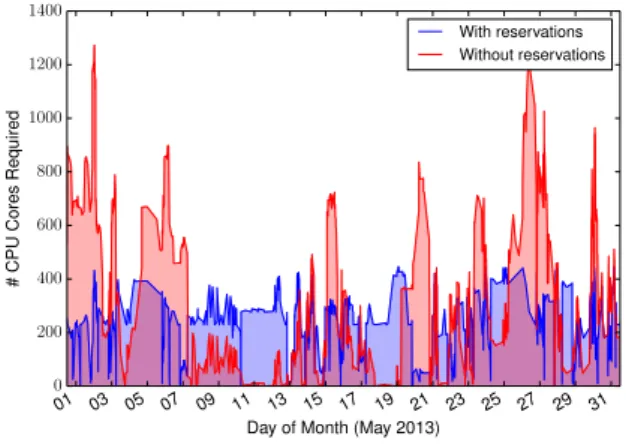
We considered a simple experiment to estimate the impact of reservations on the utilisation of a data cen-tre. We used the advance-reservation log from the sched-uler [5] of a Grid’5000 site (i.e. the data centre located in Lyon) and simulated a scheduling under two sce-narios: the current scheduling where users make reser-vations to use resources at a time in the future; and an extrapolation where all requests are treated as im-mediate reservations where resources are allocated as they arrive, hence emulating a more elastic cloud-like
scenario. Figure 1 shows the number of cores required
to handle requests over time under each scenario. Al-though this is an extreme scenario where all requests
are treated as they arrive, we believe that if users knew resources were available whenever they wanted, certain users who currently reserve resources in advance would have changed their behaviour; particularly users that currently use the platform over weekends or at night.
01 03 05 07 09 11 13 15 17 19 21 23 25 27 29 31
Day of Month (May 2013) 0 200 400 600 800 1000 1200 1400 # CPU Cores Required With reservations Without reservations
Fig. 1 Maximum number of CPUs needed at the Grid’5000 Lyon site.
Grid’5000 is an experimental platform, but studies of other system logs revealed similar bursts of requests during working hours [9]. Providing bare-metal or spe-cialised VMs with the elasticity with which cloud cus-tomers are familiar can be costly, and reservations may be explored to help minimise these costs.
3 Modelling Bare-Metal Deployment
Workload traces that provide information on the time taken to perform operations required to deploy resources, such as switching resources on, cloning operating sys-tem images, and partitioning physical disks are diffi-cult to come by. To model the time required for de-ployment, we use traces gathered from Grid’5000 which have been generated by Kadeploy3 [14]; a disk imaging and cloning tool that takes a file containing the operat-ing system to deploy (i.e. an environment) and copies it to target nodes. An environment deployment by Kade-ploy3 consists of three phases:
1. Minimal environment setup, where nodes reboot into a minimal environment with tools for partitioning and disks and creating the necessary file systems. 2. Environment installation, when the environment is
broadcast and copied to all nodes, and post-copy operations are performed.
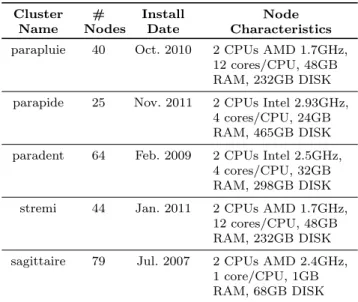
We gathered several years of Kadeploy3 traces from five clusters on three Grid’5000 sites and evaluated the time to execute the three phases described above.
Ta-ble1 details the considered clusters.
Table 1 Clusters whose deployment logs were considered. Cluster Name # Nodes Install Date Node Characteristics parapluie 40 Oct. 2010 2 CPUs AMD 1.7GHz,
12 cores/CPU, 48GB RAM, 232GB DISK parapide 25 Nov. 2011 2 CPUs Intel 2.93GHz,
4 cores/CPU, 24GB RAM, 465GB DISK paradent 64 Feb. 2009 2 CPUs Intel 2.5GHz,
4 cores/CPU, 32GB RAM, 298GB DISK
stremi 44 Jan. 2011 2 CPUs AMD 1.7GHz,
12 cores/CPU, 48GB RAM, 232GB DISK sagittaire 79 Jul. 2007 2 CPUs AMD 2.4GHz,
1 core/CPU, 1GB RAM, 68GB DISK
We considered all deployments from Jan. 2010 through Dec. 2013. The first step towards building a model con-sisted in creating time histograms and visually examin-ing probability distributions that were likely to fit the data. Scott’s method was used to determine the size of histogram bins [24]. After considering some distri-butions, we found that log-normal, gamma and
gener-alised gamma were most likely to fit the data. Figure2
depicts the results of fitting these distributions to the deployment time information of each cluster. In gen-eral, deployment presents an average completion time with occasional failures overcome by executing other routines and performing additional server reboots.
The goodness of fit of the distributions has also been submitted to the Kolmogorov–Smirnov test (KS test), whose D-statistic quantifies the distance between the distribution function of empirical values and the cumu-lative distribution function of the reference distribution.
Although the results summarised in Table2do not
dif-fer much, log-normal provides slightly better fit to most clusters, and is hence used to model deployment time.
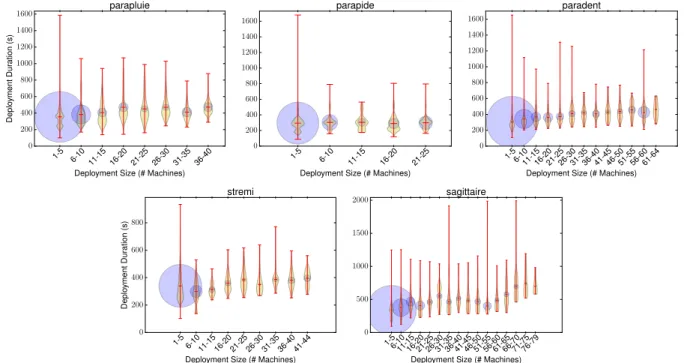
We also have analysed how the deployment time changes according to the number of machines simulta-neously configured per deployment (i.e. the deployment
size). Figure 3 summarises the information on
deploy-ment for several deploydeploy-ment sizes and the considered clusters. The bubbles illustrate the distribution of de-ployments across the intervals of required numbers of
Table 2 Kolmogorov-Smirnov test for goodness of fit. Cluster
Name
D-Statistics
Log-normal Gamma Gen. Gamma
parapluie 0.051 0.066 0.059
parapide 0.111 0.095 0.091
paradent 0.041 0.046 0.043
stremi 0.051 0.036 0.039
sagittaire 0.067 0.076 0.070
machines, whereas Table3 presents the number of
de-ployments in the largest and smallest groups for each cluster.
Table 3 Number of deployments per group. Cluster
Name
Number of Deployments Largest Group Smallest Group
parapluie 9722 143
parapide 6654 235
paradent 10000 9
stremi 6939 21
sagittaire 9271 5
The violin graphs in Figure3show that, with a few
exceptions, the time taken by most deployments lies be-tween the mean and the lower outliers, hence demon-strating the tendency that deployment time exhibits a lognormal behaviour. Moreover, the average deploy-ment time increases proportionally to deploydeploy-ment size, which is expected as multiple simultaneous data trans-fers are carried out (e.g. copy of the OS image to nodes), hence competing for network resources. The bubbles show that most deployments require between 1 and 4 machines, while the corresponding violin graphs indi-cate that these deployments present the largest vari-ations in deployment time. Further investigation re-vealed that this behaviour stems from the fact that Grid’5000 is an experimental platform. Most users, when creating customised environments and testing their de-ployments, do so by experimenting with a small number of machines (from 1 to 5). Under certain cases, some deployment phases are retried a few times before the request is considered successful.
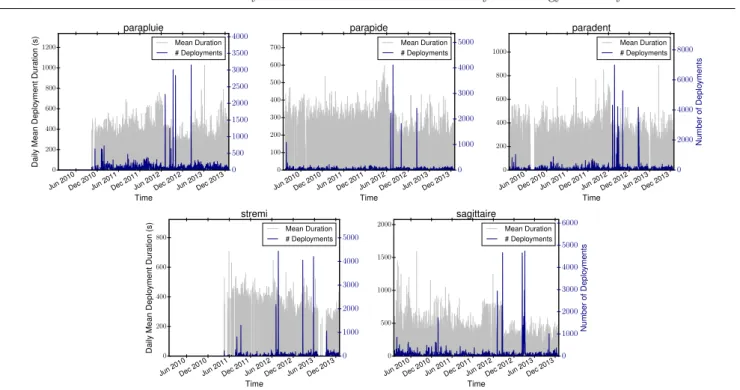
Figure4shows the daily mean deployment time and
the number of deployments for the considered clusters. One can notice a significant number of deployments for a few days. Further investigation revealed that these cases result from automated tests performed after up-dates of the bare-metal deployment system and
plat-0 500 1000 1500 Deployment Time (seconds) 0.000 0.001 0.002 0.003 0.004 0.005 0.006 Density Deployment on parapluie lognorm gamma gengamma 0 100 200 300 400 500 600 700 Deployment Time (seconds) 0.000 0.002 0.004 0.006 0.008 0.010 0.012 0.014 Deployment on parapide lognorm gamma gengamma 0 500 1000 1500
Deployment Time (seconds) 0.000 0.001 0.002 0.003 0.004 0.005 Deployment on paradent lognorm gamma gengamma 0 100 200 300 400 500 600 700 800 Deployment Time (seconds) 0.000 0.001 0.002 0.003 0.004 0.005 0.006 Density Deployment on stremi lognorm gamma gengamma 0 200 400 600 800 1000 1200 Deployment Time (seconds) 0.000 0.001 0.002 0.003 0.004 0.005 0.006 0.007 Deployment on sagittaire lognorm gamma gengamma
Fig. 2 Deployment time histograms and distribution fitting.
1-5 6-10 11-15 16-20 21-25 26-30 31-35 36-40
Deployment Size (# Machines) 0 200 400 600 800 1000 1200 1400 1600 Deplo yment Dur ation (s) parapluie 1-5 6-10 11-15 16-20 21-25
Deployment Size (# Machines) 0 200 400 600 800 1000 1200 1400 1600 parapide 1-56-1011-1516-2021-2526-3031-3536-4041-4546-5051-5556-6061-64
Deployment Size (# Machines) 0 200 400 600 800 1000 1200 1400 1600 paradent 1-5 6-1011-1516-2021-2526-3031-3536-4041-44
Deployment Size (# Machines) 0 200 400 600 800 Deplo yment Dur ation (s) stremi 1-56-1011-1516-2021-2526-3031-3536-4041-4546-5051-5556-6061-6566-7071-7576-79
Deployment Size (# Machines) 0
500 1000 1500
2000 sagittaire
Fig. 3 Deployment time under various numbers of simultaneously configured machines; the bubbles illustrate the number of deployments in each interval.
form maintenance. Moreover, for certain clusters (e.g. parapluie, parapide and sagittaire) the daily mean de-ployment time decreases substantially from July 2012. After discussions with engineers responsible for the plat-form maintenance, we discovered that over time there had been changes in the last phase of environment de-ployment performed by Kadeploy. Instead of
perform-ing a full system reboot to initialise the newly deployed
environment, some machines utilise kexec1 to load the
new Linux kernel into memory and boot the new sys-tem, hence avoiding a hardware reboot and its firmware stage.
Jun2010Dec2010Jun2011Dec2011Jun2012Dec2012Jun2013Dec2013 Time 0 200 400 600 800 1000 1200 Daily Mean Deplo yment Dur ation (s) parapluie Mean Duration # Deployments 0 500 1000 1500 2000 2500 3000 3500 4000
Jun2010Dec2010Jun2011Dec2011Jun2012Dec2012Jun2013Dec2013
Time 0 100 200 300 400 500 600 700 parapide Mean Duration # Deployments 0 1000 2000 3000 4000 5000
Jun2010Dec2010Jun2011Dec2011Jun2012Dec2012Jun2013Dec2013
Time 0 200 400 600 800 1000 paradent Mean Duration # Deployments 0 2000 4000 6000 8000 Number of Deplo yments
Jun2010Dec2010Jun2011Dec2011Jun2012Dec2012Jun2013Dec2013
Time 0 200 400 600 800 Daily Mean Deplo yment Dur ation (s) stremi Mean Duration # Deployments 0 1000 2000 3000 4000 5000
Jun2010Dec2010Jun2011Dec2011Jun2012Dec2012Jun2013Dec2013
Time 0 500 1000 1500 2000 sagittaire Mean Duration # Deployments 0 1000 2000 3000 4000 5000 6000 Number of Deplo yments
Fig. 4 Daily mean deployment duration and number of deployments over time for the various clusters.
The deployment time model is used in Section 5
to estimate how much time is required for initialising resources and configuring them to serve user requests.
4 Resource Allocation Strategies
This section discusses reservation strategies that a cloud provider can implement for reducing the energy con-sumed by computing resources, whereas their
perfor-mance is investigated later in Section5.
4.1 Power-Off Idle Resources
This strategy checks resources periodically, and if a re-source remains idle during a given time (i.e. idleness in-terval ), it is powered off. As shown later, this strategy though simple and efficient from an energy consump-tion perspective, can lead to performance degradaconsump-tion if resources are continuously switched off or on.
4.2 Reservation-Based Power-Off
This approach is similar to powering-off idle resources, but when assessing a resource idleness, it also deter-mines whether the resource is likely to remain unused over a time horizon. The strategy also initialises re-sources in advance to serve previously scheduled reser-vations. The average deployment time and a small safety
margin are used to determine how long in advance re-sources must be deployed. Previous work evaluated lengths of idleness interval and the time horizon over which a server needs to remain unused to be considered a can-didate to be switched off [20]. These intervals must be long enough so that frequent resource reinitialisation does not eclipse the potential energy savings achieved by powering idle resources off. Here idleness time and the horizon are 5 and 30 minutes respectively.
4.3 Reservation With Minimum Capacity Estimation In addition to delaying when resources are made avail-able to users, frequent server initialisation and shut down can be detrimental to energy efficiency. A typ-ical server exhibits peaks of power consumption during boot and shut down phases [20], which we seek to avoid by using a technique proposed in our previous work [2] to configure a minimum resource pool, with a capac-ity below which decisions to switch resources off are ignored.
Resource utilisation is used for determining when the minimum capacity must be adjusted. Utilisation at
time t, denoted by υt, is the ratio between the number of
resource hours used to handle requests and the number of hours resources were powered on (i.e., switched-off resources are not considered). The provider sets param-eters H and L, 0 ≤ L ≤ H ≤ 1, indicating utilisation lower (L) and upper (H) thresholds according to which additional capacity is required or powered-on resources
are not needed, respectively. In this work, L = 0.4, H = 0.9.
The minimum pool capacity should ideally be mod-ified before utilisation reaches undesired levels, which requires a prediction on the future number of resources required. Here this estimation is based on the measure-ments performed over the past i measurement
inter-vals. Namely, after measuring υt at time t, weighted
exponential smoothing is used to predict the utilisa-tion for step t + 1. If the past v ≤ i measurements (i.e., υt−v, υt−v+1, . . . , υt) and the forecast utilisation
are below (above) the lower (upper) threshold L (H), the minimum capacity must be adjusted. We employ i = 5 and v = 10. We use an exponential moving aver-age of past numbers of required resources to compute the new minimum capacity.
4.4 Exploiting Workload Periodicity
Whereas strategies for aperiodic workloads are inher-ently more versatile as they can be applied to any work-load, periodicity does provide valuable insights to ad-just the number of resources that must be made avail-able at a given time. We employ a technique derived from previous work [11] to explore workload periodic-ity and leverage information to determine the minimum number of resources required over the horizon.
The periodicity of a workload can be determined us-ing historical data usus-ing techniques such as Fast Fourier Transform [11], autocorrelation and Discrete Fourier Transform [29]. The average utilisation from multiple periods can be used for estimating the minimum num-ber of resources required during an interval.
The technique employed here creates variable-sized intervals instead of using fixed-length intervals. The technique simulates the scheduling of requests and de-termines the number of resources needed to handle the incoming request-rate. We measure the number of re-sources required to manage the load at fixed time steps, which provides us with a time series with the demand values at various time steps during a period. Then, we use K-means++ to classify the demand data points into groups to which they mostly resemble. We use k = 3 considering three distinct load levels, namely low, medium and high.
Once measurement points have been clustered into demand-level groups, we walk through the demand time series and divide it into intervals in a manner that most measurements within an interval are in the same demand group. Whenever we find a sequence of mea-surements in a demand group followed by another se-quence in a different group, we put the two sese-quences
into distinct intervals. The minimum resource capacity required during each interval is the average of demand points obtained during the interval. More detailed in-formation on the technique can be found in the litera-ture [11].
This strategy hence uses a hybrid approach to con-figure a minimum pool of resources. It employs the load level intervals described above to set the minimum pool and at every time step t, adjusts the minimum capacity based on historical load and resource utilisation method
described in Section4.3.
5 Performance Evaluation
We evaluate the impact of reservations on the potential for energy savings and time to deliver servers to users.
5.1 Experimental Setup
A discrete-event simulator is used to model and
sim-ulate resource allocation and request scheduling2. As
traces of cloud workloads with reservations are very difficult to come by, two sets of request traces were adapted to model cloud users’ resource demands; one set extracted from Grid’5000’s scheduler and another based on Google workload logs [22].
Despite using workloads from clusters, which may at first more related to private clouds, we believe that pub-lic clouds may present similar usage patterns. Systems with global presence when deployed on public clouds, use techniques such as redirection via DNS, content de-livery optimisations, among others, to redirect clients to the nearest region/zone and hence minimise delays and improve response time. By doing so, each region may, in fact, be serving customers who are more geo-graphically close and hence exhibit some of the diurnal patterns considered here.
5.1.1 Grid’5000 Reservation Trace
Request traces were collected from two Grid’5000 sites, Lyon and Reims, spanning six months, from Jan. 2014 to Jun. 2014. There are essentially two types of requests that users of Grid’5000 can make, namely reservations and best-effort ; the latter is ignored in this work. Under normal operation, resource reservations are conditioned to available resources. For instance, a user willing to al-locate resources for an experiment will often check a site’s agenda, see what resources are available and will eventually make a reservation during a suitable time
frame. If the user cannot find enough resources, she will either relax her requirements — e.g. change the number of required resources, and reservation start or/and fin-ish time — or choose another site with available capac-ity. The request traces, however, do not capture what the users’ initial requirements were before they made their requests. For each site we consider the original trace, referred to as reservation, and another version termed as cloud where the original trace is modified as follows:
1. Requests whose original submission time is within working hours and start time lies outside these hours are considered on-demand requests starting at their original submission time.
2. Remaining requests are considered on-demand, both submitted and starting at their original start time. 3. The resource capacity of a site is modified to the maximum number of CPU cores required to honour all requests, plus a safety factor.
Change (1) adapts the behaviour of users who
cur-rently exploit resources during off-peak periods, whereas
(2) alters the current practice of planning experiments
in advance and reserving resources before they are taken by other users. Although the changes may seem extreme at first, they allow us to evaluate what we consider to be our worst case scenario where reservations are not possible. Moreover, as mentioned earlier, we believe that under the model adopted by existing clouds, where short-term reservations are not allowed, and prices of on-demand instances do not vary over time, users would have little incentives to exploit off-peak periods or plan
their demand in advance. Change (3) reflects the
indus-try practice of provisioning resources to handle peak demand including a safety margin.
5.1.2 Google Workload Trace
The original Google workload trace provides data over a month-long period in May 2011 from a 12k-machine set used by the Exploratory Testing Architecture [22]. The trace contains a log of job submissions, their schedule, and execution, where each job comprises one or mul-tiple tasks that are executed on containers deployed on one or multiple machines. The original resource de-mands (e.g. memory, CPU, disk) are normalised by the configuration of the largest machine. To determine the
number of physical machines mj that a job j requires,
we obtain the maximum set of simultaneous tasks in
ex-ecution Tj over the duration of job j. Then we compute
mj = min{a, c ∗Pt∈Tjt/mac
mem
t }, where macmemt is
the normalised capacity of the machine that executed task t; c is a constant representing the available host’s
memory capacity allocated to containers, set to 0.85; and a is a constant that specifies the maximum num-ber of machines per request. The constant a is set to 50 to prevent creating workloads that are extremely bursty and can hinder strategy comparison.
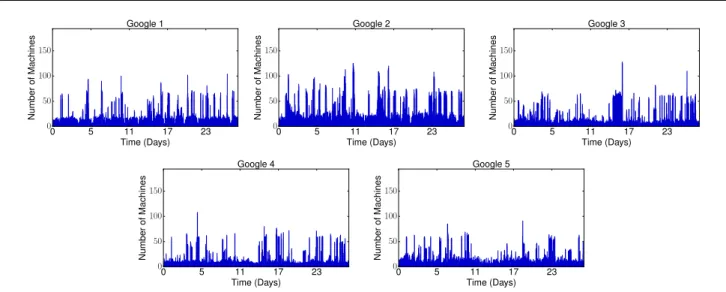
Certain jobs are very short and probably part of submission bursts for which we consider a user would make a single reservation. Hence jobs are grouped using a technique proposed for bag-of-tasks applications [12]. The continued submission grouping scheme is applied with ∆ = 180 seconds as longer running jobs would more closely represent bare-metal deployment. From the original trace that contains jobs submitted by a to-tal of 933 services, we crafted five different workloads, each comprising job submissions from 250 randomly
se-lected services; these traces, depicted in Figure 5, are
taken as the cloud workloads. As the original trace does not contain reservations, we create reservation work-loads by randomly selecting requests that require reser-vations, where the reservation ratio varies as described later. Original job start time is used as the reservation start time and how long in advance the reservation is made is uniformly drawn from an interval of 0 to 24h.
5.1.3 User Behaviour
We believe that users of a cloud would plan their re-source demands in advance and use reservations if enough incentives were provided. These incentives could mate-rialise in the form of discount prices for resource allo-cation or information on how their behavioural changes affect resource allocation and maximise energy savings [20]. In this work, we do not focus on devising the proper incentives for users to adhere to reservations. The experiments consider that at least some users find enough incentives to change their allocation decisions and reserve resources in advance. A more detailed study on incentives is left for future work.
5.1.4 Modelled Scenarios
Two scenarios were modelled, where infrastructure ca-pacity and resource requests are expressed in number of machines. The maximum number of machines avail-able at each site is computed by simulating the request scheduling of their corresponding cloud workloads un-der a large number of machines, so that each request is treated as it arrives and no request is rejected. The maximum number of machines used during this evalua-tion is taken as the site capacity. Based on the deploy-ment information from Kadeploy, we model the time in seconds required to boot powered-off machines re-quested by a reservation using a log-normal distribution
0 5 11 17 23 Time (Days) 0 50 100 150 Number of Machines Google 1 0 5 11 17 23 Time (Days) 0 50 100 150 Number of Machines Google 2 0 5 11 17 23 Time (Days) 0 50 100 150 Number of Machines Google 3 0 5 11 17 23 Time (Days) 0 50 100 150 Number of Machines Google 4 0 5 11 17 23 Time (Days) 0 50 100 150 Number of Machines Google 5
Fig. 5 Overview of Google cloud workloads.
whose scale is 6 and shape is 0.4. We take 25 minutes as the time a machine must remain idle to be a candidate for switch off and 30 minutes as the future horizon to check whether it is committed to reservations. The eval-uation of candidates for switch off is performed every 5 minutes.
To evaluate the potential energy savings resulting from including reservations, we considered the following schemes for resource provisioning:
– Cloud Always On: baseline scenario that uses the cloud workloads and maintains all servers con-stantly on. It is also used to determine the resource capacity to handle requests in an on-demand, cloud-like manner.
– Cloud Switch Off: does not consider reservations, employs the cloud workloads and the policy that switches servers off if they remain idle for a given interval.
– Reservation Switch Off: uses the reservation traces and the reservation policy that switches off servers that remain idle for an interval and that are not committed to requests over a time horizon. It also boots servers in advance to fulfil previously sched-uled reservations.
– Reservation Minimum Pool: similar to the reser-vation with switch off but maintains a minimum resource pool available using the historic resource
utilisation mechanism described in Section4.3.
– Reservation Periodic: this strategy configures the minimum resource pool using the hybrid approach
presented in Section4.4. The first week of the
work-load traces is employed to compute the periodic work-load levels used to calculate the minimum resource pool.
5.2 Performance Metrics
Two metrics are considered, namely energy saving po-tential and request aggregate delay, which respectively measure how much of the total server idleness is used for server switch-off and how powering off resources af-fects the time to deliver requested servers to users.
5.2.1 Energy Saving Potential
The total server idleness si under the Cloud Always On scenario corresponds to the maximum time during which servers could potentially be switched off, and it is therefore considered the upper bound on potential energy savings. The si of a site is given by:
si = Z tlast
t0
stotal− suseddt (1)
where t0is the start of the evaluation, tlast is when the
last request is submitted, stotal is the total number of
servers available at any time, and sused is the number
of machines in use at time t. The potential for energy saving is the percentage of si during which servers are switched off.
5.2.2 Request Aggregate Delay
This metric quantifies the impact that switching servers off has on the QoS users perceive; it measures the time users have to wait to have their requests serviced. The aggregate delay ad of requests whose Quality of Service
(QoS) has been impacted (Rdelay) is given by:
ad = X
r∈Rdelay
where rdeploy end is when the last server became ready
to use, and rstart time is the time when the request
was supposed to start; that is, when the user expected the servers to be available. The distributions of deploy-ment time obtained while inspecting Kadeploy traces give a conservative estimate to evaluate ad. Certain public cloud providers publicise provisioning times of bare-metal resources much higher than those found in Grid’5000.
5.3 Evaluation Results
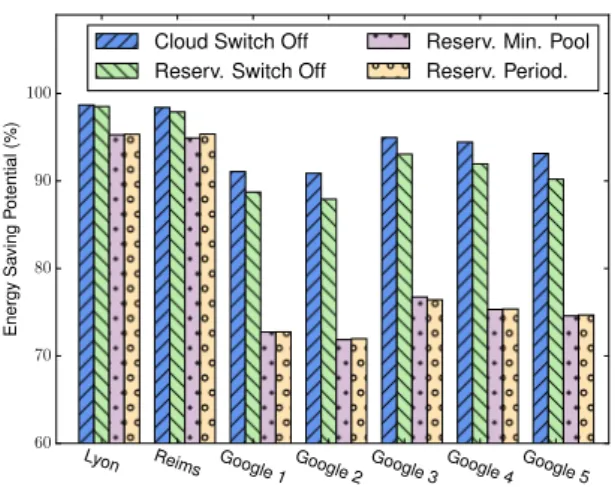
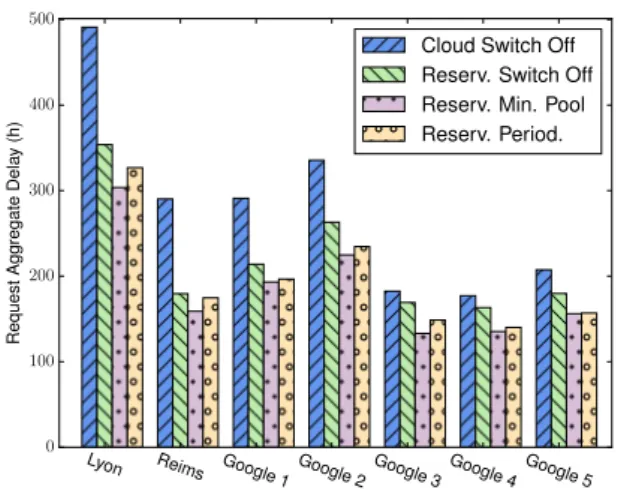
Figures6and Figure7summarise the results on
poten-tial energy savings and request aggregate delay. Here 40% of requests of each Google workload are randomly selected to require reservations. As the Cloud Switch Off scheduling strategy switches servers off almost im-mediately once it determines that they have remained idle, it is able to achieve higher energy saving poten-tial. This simple policy, however, does not consider the cost of powering off/on resources and hence presents the largest request aggregate delay. The Reservation Switch Off scenario, on the other hand, exploits less idle time,
but as shown in Figure7leads to smaller QoS
degrada-tion. In addition, reservation provides some advantages with respect to peak capacity planning. For instance, when handling requests in a cloud manner, Lyon and Reims Grid’5000 sites require peak capacities of respec-tively 194 and 136 machines; when accepting reserva-tions, the peak capacities are respectively 89 and 78 servers, which is over 45% less servers than the Cloud scenario.
Lyon Reims Google
1Google2Google3Google4Google5
60 70 80 90 100 Energy Sa ving Potential (%)
Cloud Switch Off Reserv. Switch Off
Reserv. Min. Pool Reserv. Period.
Fig. 6 Energy saving potential for the various scenarios.
As shown in Figure6, reservation with a minimum
resource pool presents smaller energy savings compared
to the simple reservation strategy, but it reduces the request aggregate delay. In the case of Google work-loads, although reservation reduces the aggregate
re-quest delay as shown in Figure7, this reduction results
in smaller energy saving potential. Further investiga-tion of this issue revealed that the exponential smooth-ing applied to forecast required server capacity leads to a minimum number of resources being kept on during longer periods than under other strategies. Although at first one may assume that other strategies can always better exploit the bursty behaviour of the Google work-loads, it is important to note that we use conservative bare-metal deployment times. We believe that when considering the times reported by the industry – where servers take several hours to be provisioned or recycled – the smoother behaviour of reservation with minimum pool is preferable. When compared to Reservation Min-imum Pool, the Reservation Periodic strategy achieves very minor gains in potential energy savings under cer-tain workloads, but it worsens the aggregate request delay. The reason for the greater request delay is that under certain cases the minimum resource pool is set to a larger number than what is in fact used, thus resulting in lower resource utilisation. This lower utilisation af-fects the size of the minimum pool over subsequent peri-ods when the periodic approach demands a low number of resources and sudden request bursts arise.
In order to evaluate the impact of using reserva-tion on the request aggregate delay, we performed an-other experiment with the Google workloads by varying the reservation ratio from 0.1 to 0.9 (i.e. from 10% to 90% of requests are selected to require reservations).
Figure 8 shows that in general the aggregate delay is
inversely proportional to the reservation ratio. It is im-portant to highlight that the impact of reservations on the aggregate request delay could have been higher if grouped jobs from the original trace had not been grouped to build what we believe is a more realistic scenario of bare-metal deployment.
6 Related Work
The benefits and drawbacks of resource reservations have been extensively studied for various systems, such as clusters of computers [13,15,17,23,25], meta-schedulers
[26], computational grids [7,8,10], virtual clusters and
virtual infrastructure [6]; and have been applied under multiple scenarios including co-allocation of resources [19], and improving performance predictability of cer-tain applications [32].
Smith et al. [25] evaluated the impact of including support for advance reservations on scheduling systems. They concluded that the mean wait time of submitted
Lyon Reims Google
1Google2Google3Google4Google5
0 100 200 300 400 500 Request Agg regate Dela y (h)
Cloud Switch Off Reserv. Switch Off Reserv. Min. Pool Reserv. Period.
Fig. 7 Request aggregate delay in resource/hour.
Reser vation Ratio 0.10.2 0.30.4 0.50.6 0.70.8 0.9 1.0 Google 1 Google 2 Google 3 Google 4 Google 5 Request Agg regate Dela y(h) 0 50 100 150 200 250
Fig. 8 Request delay in resource/hour for Google workloads.
applications might increase when supporting reserva-tions and that the increase depends on how reservareserva-tions are supported (i.e. whether queued requests have pri-ority or not). They also identify that reservations may lead to fragmentation of system resources.
Margo et al. [17] also confirm that wait times can in-crease, but highlight the needs for reservations when co-allocating resources from multiple sites for applications such as workflows [32]. They also describe techniques to mitigate the impact of reservations on traditional man-agement. The need for reservations as a means to en-able jobs that require resource co-allocation is also high-lighted by Snell et al. [26] who describe algorithms for scheduling meta-jobs. A brokering service also capable of performing meta-scheduling and supporting reserva-tions is described by Elmroth and Tordsson [7].
Lawson and Smirni [15] aim at reducing fragmen-tation by providing a non-FCFS policy that schedules jobs using multiple queues. Farooq et al. [8] attempt to
reduce the performance cost of reservations by adding laxity to the reservation window and hence giving more flexibility to the scheduling system. Flexible or lax reser-vations is a concept also explored by Netto et al. to support resource co-allocation [19].
Previous work also provided techniques for placing reservations into a schedule. Approaches such as those
provided by R¨oblitz and Rzadca [23] attempt to decide
on the placement of a reservation by executing what-if schedules in case the reservation is accepted. The what-if scenarios often simulate backfilling scheduling sched-ules trying to (re)accommodate the already accepted jobs.
Most previous work, however, has either ignored the time to provision reserved resources or employed pro-visioning models that not always reflect reality. Shi-rako [13] is a system that considers the setup and tear-down phases of resource provisioning. Reservation users often bear the costs of resource setup leaving teardown costs to successors (i.e. the next users to use the re-sources). The work, however, does not attempt to model the time required to deploy bare-metal resources.
Amazon Web Services (AWS)3 offers cloud services
that suit several of today’s use cases and provides the richest set of reservation options for VM instances. AWS offers four models for allocating VM instances, namely on-demand, reserved instances, spot instances and ded-icated; the latter are allocated within a Virtual Private Cloud (VPC). Under all models AWS allows users to request HPC instances, optimised for processing, mem-ory use, I/O, and instances with Graphical Processing Units (GPUs). Reserved instances can be requested at a discount price under the establishment of long-term contracts. Dedicated instances, provided at a premium, are those that most closely resemble bare-metal provi-sioning, as two instances requested by a given service do not share a physical host.
Wang et al. [31] have exploited the use of reserva-tions in the cloud by considering a cloud brokerage ser-vice that reserves a large set of VM instances from cloud providers and the serves user requests at discount price. While considering a cloud provider’s revenue maximi-sation, Toosi et al. [28] present a stochastic dynamic programming technique for determining the maximum number of reservations that the provider can accept. The present work evaluates the energy savings that could be achieved if short-term reservations were ac-cepted, and how the time required to configure the re-sources affect how long it takes for the rere-sources to become available to reservation users.
OpenNebula [18] and Haizea [27] support multiple types of reservations (e.g. immediate, advanced and
best-effort) and consider the time required to prepare and configure the resources used by VMs (e.g. time to transfer VM images). Climate, a reservation system
conceived during the FSN XLCloud4project, and later
renamed Blazar when incorporated into OpenStack5
enables reserving and deploying bare-metal resources whilst taking into account their energy efficiency [3].
7 Conclusion and Future Work
This article discussed the impact of reservation sup-port in the provision of bare-metal resources in Clouds. The work analysed historical information on the deploy-ment of bare-metal resources and evaluated strategies for switching off servers in a cloud data centre. Results show the impact of adding resource reservations on the number of machines required to handle peak load and the time used to deploy environments such as operating system and software stack required by customers. Un-der the evaluated environments and workloads, reserva-tions can reduce the time to deliver resources to users when compared to allocation strategies that naively switch off idle servers. Moreover, when using reserva-tions, the maximum number of machines required to handle peak load at the examined Grid’5000 sites was over 45% smaller compared to handling requests in an on-demand, cloud-like fashion.
In future work, we would like to gain more insights on user behaviour on how they would exploit reserva-tion of bare-metal resource in the cloud. We would like to obtain request traces that can tell us more about users’ habits and the patterns of resource requests. We also intend to conduct user surveys to understand how users would utilise short-term reservations.
Acknowledgements
This research is partially supported by the CHIST-ERA STAR project. Some experiments presented in this pa-per were carried out using the Grid’5000 expa-perimental testbed, being developed under the Inria ALADDIN de-velopment action with support from CNRS, RENATER and several Universities as well as other funding bodies (seehttps://www.grid5000.fr).
References
1. Armbrust, M., Fox, A., Griffith, R., Joseph, A.D., Katz, R.H., Konwinski, A., Lee, G., Patterson, D.A., Rabkin,
4 http://xlcloud.org
5 https://wiki.openstack.org/wiki/Blazar
A., Stoica, I., Zaharia, M.: Above the clouds: A Berkeley
view of Cloud computing. Tech. Report UCB/EECS-2009-28, Electrical Engineering and Computer Sciences, University of California at Berkeley, Berkeley, USA (2009)
2. Assuncao, M.D., Cardonha, C.H., Netto, M.A., Cunha, R.L.F.: Impact of user patience on auto-scaling resource capacity for cloud services. Future Generation Computer Systems 55, 41–50 (2016). DOI http://dx.doi.org/10. 1016/j.future.2015.09.001
3. Assuncao, M.D., Lefevre, L., Rossigneux, F.: On the im-pact of advance reservations for energy-aware provision-ing of bare-metal cloud resources. In: 12th International Conference on Network and Service Management (CNSM 2016) (2016)
4. Bolze, R., Cappello, F., Caron, E., Dayd´e, M., Desprez, F., Jeannot, E., J´egou, Y., Lant´eri, S., Leduc, J., Melab, N., Mornet, G., Namyst, R., Primet, P., Quetier, B., Richard, O., Talbi, E.G., Ir´ea, T.: Grid’5000: a large scale and highly reconfigurable experimental Grid testbed. Int. J. of High Perf. Comp. Applications 20(4), 481–494 (2006)
5. Capit, N., Costa, G.D., Georgiou, Y., Huard, G., Martin, C., Mouni´e, G., Neyron, P., Richard, O.: A batch sched-uler with high level components. In: CCGrid’05, vol. 2, pp. 776–783. Washington, USA (2005)
6. Chase, J.S., Irwin, D.E., Grit, L.E., Moore, J.D., Spren-kle, S.E.: Dynamic virtual clusters in a Grid site manager. In: HPDC 2003, p. 90. Washington, USA (2003) 7. Elmroth, E., Tordsson, J.: A standards-based Grid
re-source brokering service supporting advance reservations, coallocation, and cross-Grid interoperability. CCPE 21(18), 2298–2335 (2009)
8. Farooq, U., Majumdar, S., Parsons, E.W.: Impact of lax-ity on scheduling with advance reservations in Grids. In: MASCOTS 2005, pp. 319–322 (2005)
9. Feitelson, D.G., Tsafrir, D., Krakov, D.: Experience with the parallel workloads archive. JPDC To appear 10. Foster, I., Kesselman, C., Lee, C., Lindell, B.,
Nahrst-edt, K., Roy, A.: A distributed resource management architecture that supports advance reservations and co-allocation. In: IWQoS’99, pp. 27–36. London, UK (1999) 11. Gandhi, A., Chen, Y., Gmach, D., Arlitt, M., Marwah, M.: Hybrid resource provisioning for minimizing data center SLA violations and power consumption. Sustain-able Comp.: Informatics and Systems 2(2), 91–104 (2012) 12. Iosup, A., Jan, M., Sonmez, O., Epema, D.: The char-acteristics and performance of groups of jobs in grids. In: A.M. Kermarrec, L. Bouge, T. Priol (eds.) Euro-Par 2007 Parallel Processing, LNCS, vol. 4641, pp. 382–393. Springer (2007)
13. Irwin, D., Chase, J., Grit, L., Yumerefendi, A., Becker, D., Yocum, K.G.: Sharing networked resources with bro-kered leases. In: USENIX Annual Technical Conf., pp. 199–212. Berkeley, USA (2006)
14. Jeanvoine, E., Sarzyniec, L., Nussbaum, L.: Kadeploy3: Efficient and Scalable Operating System Provisioning. USENIX ;login: 38(1), 38–44 (2013)
15. Lawson, B.G., Smirni, E.: Multiple-queue backfilling scheduling with priorities and reservations for parallel systems. In: JSSPP 2002, LNCS, pp. 72–87. Springer, London, UK (2002)
16. Marathe, A., Harris, R., Lowenthal, D.K., de Supinski, B.R., Rountree, B., Schulz, M., Yuan, X.: A comparative study of high-performance computing on the cloud. In: HPDC 2013, pp. 239–250. ACM, New York, USA (2013)
17. Margo, M.W., Yoshimoto, K., Kovatch, P., Andrews, P.: Impact of reservations on production job scheduling. In: JSSPP 2007, LNCS, vol. 4942, pp. 116–131. Springer, Berlin/Heidelberg, Germany (2007)
18. Milojicic, D., Llorente, I.M., Montero, R.S.: OpenNebula: A cloud management tool. IEEE Internet Comp. 15(2), 11–14 (2011)
19. Netto, M.A.S., Bubendorfer, K., Buyya, R.: SLA-Based advance reservations with flexible and adaptive time QoS parameters. In: 5th Int. Conf. on Service-Oriented Comp. (ICSOC 2007), pp. 119–131. Springer, Berlin, Heidelberg, Germany (2007)
20. Orgerie, A.C., Lef`evre, L., Gelas, J.P.: Save watts in your Grid: Green strategies for energy-aware framework in large scale distributed systems. In: ICPADS’08, pp. 171–178. Melbourne, Australia (2008)
21. Ostermann, S., Iosup, A., Yigitbasi, N., Prodan, R., Fahringer, T., Epema, D.: A performance analysis of EC2 cloud computing services for scientific computing. In: Cloud Comp., LNCS, vol. 34, pp. 115–131. Springer (2010)
22. Reiss, C., Wilkes, J., Hellerstein, J.L.: Google cluster-usage traces: Format + schema. Tech. report, Google Inc., Mountain View, USA (2011)
23. R¨oblitz, T., Rzadca, K.: On the placement of reservations into job schedules. In: Euro-Par 2006 Parallel Processing, LNCS, vol. 4128, pp. 198–210. Springer (2006)
24. Scott, D.W.: On optimal and data-based histograms. Biometrika 66(3), 605–610 (1979)
25. Smith, W., Foster, I., Taylor, V.: Scheduling with ad-vanced reservations. In: 14th Int. Parallel and Dist. Pro-cessing Symp. (IPDPS 2000), pp. 127–132. Cancun, Mex-ico (2000)
26. Snell, Q., Clement, M., Jackson, D., Gregory, C.: The per-formance impact of advance reservation meta-scheduling.
In: JSSPP 2000, LNCS, vol. 1911, pp. 137–153. Springer (2000)
27. Sotomayor, B., Keahey, K., Foster, I.: Combining batch execution and leasing using virtual machines. In: HPDC 2008, pp. 87–96. New York, USA (2008)
28. Toosi, A.N., Vanmechelen, K., Ramamohanarao, K., Buyya, R.: Revenue maximization with optimal capac-ity control in infrastructure as a service cloud markets. IEEE Transactions on Cloud Computing 3(3), 261–274 (2015). DOI 10.1109/TCC.2014.2382119
29. Verma, A., Dasgupta, G., Nayak, T.K., De, P., Kothari, R.: Server workload analysis for power minimization us-ing consolidation. In: USENIX Annual Technical Confer-ence, p. 28. USENIX Association (2009)
30. Wang, G., Ng, T.S.E.: The impact of virtualization on network performance of Amazon EC2 data center. In: 29th Conf. on Information Communications (INFO-COM’10), pp. 1163–1171. IEEE Press, Piscataway, USA (2010)
31. Wang, W., Niu, D., Liang, B., Li, B.: Dynamic cloud in-stance acquisition via iaas cloud brokerage. IEEE Trans-actions on Parallel and Distributed Systems 26(6), 1580– 1593 (2015). DOI 10.1109/TPDS.2014.2326409
32. Wieczorek, M., Siddiqui, M., Villazon, A., Prodan, R., Fahringer, T.: Applying advance reservation to increase predictability of workflow execution on the Grid. In: 2nd IEEE Int. Conf. on e-Science and Grid Comp. (E-Science 2006), p. 82. Washington, USA (2006)
33. Younge, A.J., Henschel, R., Brown, J.T., von Laszewski, G., Qiu, J., Fox, G.C.: Analysis of virtualization tech-nologies for high performance computing environments. In: IEEE Int. Conf. Cloud Comp. (CLOUD 2011), pp. 9–16 (2011)