HAL Id: hal-02275177
https://hal.archives-ouvertes.fr/hal-02275177
Submitted on 30 Aug 2019
HAL is a multi-disciplinary open access
archive for the deposit and dissemination of
sci-entific research documents, whether they are
pub-lished or not. The documents may come from
teaching and research institutions in France or
abroad, or from public or private research centers.
L’archive ouverte pluridisciplinaire HAL, est
destinée au dépôt et à la diffusion de documents
scientifiques de niveau recherche, publiés ou non,
émanant des établissements d’enseignement et de
recherche français ou étrangers, des laboratoires
publics ou privés.
sound source separation process
Simon Fargeot, Olivier Derrien, Gaetan Parseihian, Mitsuko Aramaki,
Richard Kronland-Martinet
To cite this version:
Simon Fargeot, Olivier Derrien, Gaetan Parseihian, Mitsuko Aramaki, Richard Kronland-Martinet.
Subjective evaluation of spatial distorsions induced by a sound source separation process. EAA Spatial
Audio Signal Processing Symposium, Sep 2019, Paris, France. pp.67-72, �10.25836/sasp.2019.15�.
�hal-02275177�
SUBJECTIVE EVALUATION OF SPATIAL DISTORTIONS INDUCED BY A
SOUND SOURCE SEPARATION PROCESS
Simon Fargeot
1Olivier Derrien
2Ga¨etan Parseihian
1Mitsuko Aramaki
1Richard Kronland-Martinet
1 1Aix Marseille Univ, CNRS, PRISM, Marseille, France
2
Universit´e de Toulon, Aix Marseille Univ, CNRS, PRISM, Marseille, France
ABSTRACT
This paper presents a new methodology to perceptually evaluate the spatial distortions that can occur in a spatial remix context, when using sound sources degraded by a source separation process. It consists in comparing lo-calization performances on complex sound scenes com-posed of synthetic musical instruments in both clean and degraded cases. The localization task takes into account perceived position or positions of each instrument, as well as their perceived size and shape. In order to deal with this complex task, the test is performed through a virtual environment, using head-mounted gear. This methodol-ogy has been tested to evaluate spatial image distortions induced by an NMF source separation algorithm devel-oped by Simon Leglaive [1]. The present study reveals that the source separation process leads to perceptible degra-dations of the spatial image. Three main kinds of spatial distortions have been characterized, including ”phantom” sources emergence, source widening and increasing of the localization blur.
1. INTRODUCTION
The fields of video games, simulations and virtual reality are now tending to develop increasingly high-performance, realistic and immersive technologies. Efforts are made in terms of sound devices and sound processing to synthe-size realistic sound scenes in a 3-D environment [2]. One challenge is the ability to analyze a 3-D audio stream cor-responding to a complex sound scene in its basic compo-nents (i.e. individual sound sources), to modify the spa-tial scene (e.g. to change sound sources position) and to resynthesize a modified 3-D audio stream. This situation is referred to as spatial remix. Performing a spatial remix supposes reliable source separation algorithms. Such al-gorithms already exist but they are not perfect: recovered source signal suffer from several distortions. Objective and
c
Simon Fargeot, Olivier Derrien, Ga¨etan Parseihian, Mit-suko Aramaki, Richard Kronland-Martinet. Licensed under a Creative Commons Attribution 4.0 International License (CC BY 4.0). Attribu-tion: Simon Fargeot, Olivier Derrien, Ga¨etan Parseihian, Mitsuko Ara-maki, Richard Kronland-Martinet. “Subjective Evaluation of Spatial Dis-tortions Induced by a Sound Source Separation Process”, 1st EAA Spatial Audio Signal Processing Symposium, Paris, France, 2019.
subjective evaluation of separation artifacts have been con-ducted [3], [4] and according to Emiya [5], three types of separation artifacts have been characterized, including al-teration of the target source and rejections of other sources into the target source. These criteria can be determined us-ing two Matlab toolboxes: Perceptual Evaluation methods for Audio Source Separation (PEASS)[5] and Blind Source Separation Evaluation (BSS-Eval)toolbox [6]. However, these studies usually consider the separated source sig-nals alone, i.e. when each source is listened to separately. This is different form the spatial remix problem, where all sources are rendered simultaneously. Liu et al. proposed a method for evaluating the quality of source separation in a spatial remix context using standard objective criterions only [7]. However as the finality of this work is intended to humans, it is important to subjectively evaluate spatial distortions induced by these separation artifacts. The main difficulty with subjective evaluations is the ability to objec-tivate the perception of auditors in terms of spatial soud-scape, such that the results can be aggregated over a large number of subjects.
This paper aims to characterize and quantify perceptu-ally these spatial distortions by conducting a localization test on both degraded and clean versions of the same poly-phonic musical extract. Localization performances in both cases are then compared taking the clean sources case as a reference. The methodology is applied to assess the qual-ity of Non-Negative Matrix Factorization source separa-tion algorithm developped by Leglaive [1] which performs separation on convolutive mixtures. This algorithm is in-troduced in the first section. Then, the experimental design and results of this study are presented followed by a dis-cussion.
2. AUDIO SOURCE SEPARATION
Source separation is a major research theme in signal pro-cessing. The basic principle is to estimate a number N components of a mixture from a number P of observations of this mixture. It is defined in the literature according to different criteria relating to the nature of the observed mixture: instantaneous (e.g. at the exit of a mixer) or con-volutive (e.g. during a recording in a concert hall, with room effects), but also to the nature of the observations of this mixture: over-determined or under-determined as well
varying sources. Depending on these criteria, several sep-aration techniques can be applied [8].
2.1 Source separation using Non-negative Matrix Factorization
For under-determined convolutive recording of a musical piece, Non-negative Matrix Factorization methods seems to be a suitable choice [9]. It relies on the analysis of the energy of the mixture in the time-frequency domain, as-suming that the phase of the signal is invariant over time. This involves approximating the time-frequency matrix Sij
of the energy sources j by the product of a spectral compo-nent matrix Φjk(f ) by a time activation matrix ejk(n), as
follows: |Sij|2' | ˜Sij|2= Kj X k=1 ejk(n)Φjk(f ) (1)
where ejkand Φjkare non-negative. The k components
of each source are estimated from the time-frequency rep-resentation (TFCT) of the mixture energy using its parsi-monious and non-negative properties. In practice, NMF-based algorithms use an iterative process to best estimate the k components of the e and Φ matrices of each source. 2.2 Leglaive’s NMF algorithm
The separation toolbox used in this study is provided by S. Leglaive, R. Badeau and G. Richard in [1]. It is devel-oped for Matlab and requires a couple of data regarding the mixture: audio file of the mixture, number of sources to be estimated, number of observations of the mixture. In addition, this algorithm does not perform a blind source separation since it requires strong prior knowledge of the nature of the mixture. Practically, source separation is per-formed in ”oracle” mode. It requires to initialize the algo-rithm with a good approximation of the mixture filters im-pulse responses. They contain spatial cues of the sources in relation to the measurement device as well as informa-tion on the room in which the recording is performed. In this study, we wish to remain as close as possible to real use-cases. We consider the separation of acoustic mixes. Thus, the impulse responses must be estimated a priori be-fore running the separation algorithm.
2.3 The acoustic mixes
The acoustic mixes are composed of three sound sources distributed in space and picked up by two cardioid micro-phones in ORTF conguration, as shown in Fig. 1.
Concerning mixture filters IR, these correspond to the transfer functions of the acoustic channel between the sources and the microphones. Under concert conditions, the number of sound sources on stage can be high and their position can vary over time. Measuring impulse responses at any point in the scene is tedious and unrealistic. How-ever, a measurement of impulse responses at any location can already provide us with information on the late room
Figure 1. Apparatus for the production of real mixtures, composed by three sources and recorded by two cardioid microphones in ORTF configuration.
effect. If the positions of each source and microphones are known, it is possible with a single IR measurement to ap-proximately build the corresponding impulse responses, by applying the right gain / delay matrix to the original IR. As-suming that they are correctly estimated, differences with the real case remain in the error of estimating the early room effects which actually depend on the position of the sources, especially at low frequencies. From the impulse responses of the central source (see Fig. 1) and by apply-ing correct gain/delay pairs for the two peripheral sources, their impulse responses have been estimated. These fabri-cated responses were then used to initialize the algorithm and separation have been performed on four different mu-sical extracts recorded in Fig. 1 conditions.
2.4 Spatial remix
In order to guide the implementation of the perceptual test, an informal listening session was conducted on the sepa-rate sources of the four mixes. The artifacts induced by the separation process are perceptible. The timbre and tran-sients of the separate sources are slightly damaged and re-jections are also present. Spatial remixes of the recovered source signals are then performed according to the spatial configuration presented in Fig. 2.
For each of the four mixes, the three recovered instru-ments are displayed in a ”real source” format: one source per loudspeaker. This way, each mix can be rendered in three different spatial configurations obtained by changing the order of sources with respect to the loudspeaker set-up. Thus, the subjective evaluation of spatial distortions in-duced by spatial remix of separated sources by Leglaive’s NMF algorithm can be performed.
3. EXPERIMENTAL DESIGN
The purpose of this perceptual experience is to verify if the spatial image of a spatial remix performed with separated sources is perceived as significantly degraded and to char-acterize these distortions. According to perceptual mech-anisms involved in spatial hearing [10], one can assume
Figure 2. Spatial configuration of the sound scenes pre-sented for the perceptual experience. The sources are placed on a circle with a radius R = 1.5m, on the azimu-tal plane. S1, S2and S3, are the three sources composing
a sound scene. One source per speaker. The blue arrows represent the permutations of the sources corresponding to the different spatial configurations of an extract.
that distortions of the spatial image can be characterized in terms of :
• change in the perceived source position, • change in the perceived source extent, • unstable source position in time,
• virtual sound sources in false positions (phantom sources).
Therefore, the design of the experimental system has to allow people to report these phenomena, through a simple task.
3.1 Experimental set-up
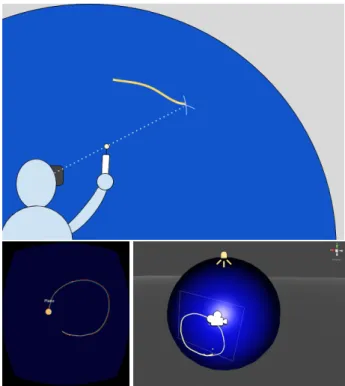
The subject of the experiment is placed in the center of 3m diameter sphere equipped with 42 loudspeakers [11]. The spatial remix is carried out by 3 loudspeakers in the spatial configuration illustrated in Fig. 2. He or she is equipped with a virtual reality headset in which a virtual scene is pro-jected. The visual environment was developed with Unity. It looks like a dark blue sphere with the same dimensions as the loudspeaker sphere. Using a Wiimote, the subject is able to draw in this virtual space, as shown in Fig. 3. Posi-tions of the head of the subject and the Wiimote are tracked using the Optitrack motion catpure system.
3.2 Subjects
The population sample selected for this study consists of 20 healthy subjects (15 male and 5 female), aged between 23 and 40 years. They do not have hearing problems. 50 % of them are used to listening to music on a stereophonic or binaural spatialization device.
Figure 3. Virtual environment and report method. Top image represents the report method. Bottom left image is a screen-shot of the subject’s view. Bottom right image is a view of the virtual environment from the outside.
3.3 Stimuli
The study is conducted on 24 sound stimuli detailed as fol-lows:
• 4 musical extracts composed of 3 instruments, • for each extract:
– 2 qualities: reference quality and quality graded by the source separation process de-scribed in section 2.3),
– 3 spatial configurations, corresponding to the three different permutations possible with one source per loudspeaker (see: figure 2). The musical extracts are played in a loop, without inter-ruption, until the subject has located their 3 instruments. In the end, 8 conditions are tested (4 extracts × 2 versions). The influence of spatial arrangement is not studied here, the 3 spatial configurations of each extract are considered as 3 repetitions of the same condition.
3.4 Procedure
This test is a sound source localization test where the sub-ject is asked to surround in a virtual environment each in-strument of musical mixes of 3 inin-struments. It is divided into three successive stages. The first step is a demonstra-tion phase. Five drum extracts at different posidemonstra-tions with different apparent widths are presented with their associ-ated plot in the virtual environment. The purpose of this step is to give the subject an overview of the different sce-narios that he may encounter during the test phase.
becomes familiar with the task he or she will have to per-form during the test phase. The same five drum extracts are again presented and the subject is asked to spot the source position by surrounding as precisely as possible the area in which he perceive the sound.
The third and final step is the test phase. The 24 musi-cal extracts composed of 3 instruments (e.g. drums, piano, bass) are presented randomly and the subjects are asked to focus successively on each element of the mix in order to locate them. Subjects must each time define the area in which they perceive the instrument they are being asked to locate. As in the learning phase, they must surround this area using a remote pointer. The average duration of the test is 45 minutes. As the subject must remain focused throughout the test, he is advised to take breaks as soon as they experience symptoms of fatigue.
3.5 Data analysis and processing
The plots collected from the 20 subjects have more or less complex patatoid shapes and cannot be analyzed in their raw state. Data processing is necessary to retrieve statis-tically analyzable descriptors. Examples of drawings are provided in Appendix B. Based on the general appearance of the shapes obtained and to simplify the analysis, we con-sider that they can be approximated by ellipses. The anal-ysis can thus be carried out on the different parameters of the ellipses. For each extract and for each instrument, we determine:
• the number of additional perceived sources, an indi-cator of the presence of phantom sources, calculated from the number of plots drawn. Each instrument is described by at least one plot, so only additional plots are counted.
• azimuth and elevation localization errors, calculated from the position of the centre of gravity of the el-lipses relative to the actual position of the sources. • the perceived width of the instrument, calculated
from the product a × b of the major axis a by the minor axis b of the ellipse. In the case where several plots have been made for the same instrument, the sum of the ellipses areas is calculated.
Each descriptor is averaged over the 3 repetitions of each condition. A repeated measures ANOVA is con-ducted, based on the 8 test conditions. It is an ANOVA with two intra-subject factors: the type of mix (4 levels: 4 different extracts) and quality (2 levels: reference quality and degraded quality). In addition, post-hoc tests is car-ried out to determine the presence of interactions between factors.
4. RESULTS
The general results for all descriptors are presented in the present section. The effects of the quality and the type of mix are finally described on three descriptors as elevation
ditions.
4.1 Effects on the number of additional sources perceived
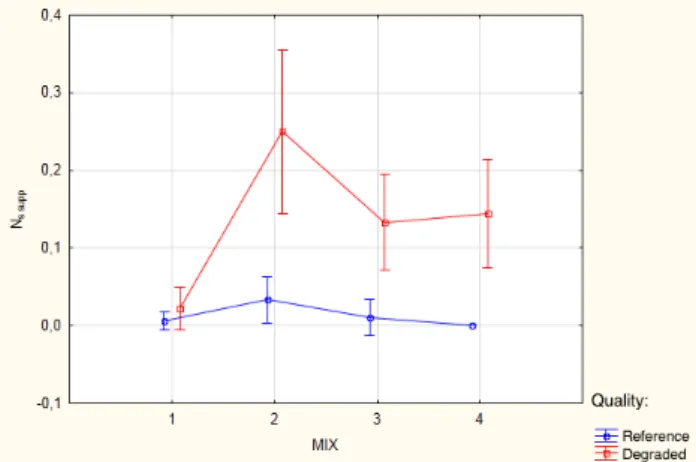
Figure 4. Cross effects of quality and mix type on the number of additional sources perceived. The red squares and blue dots represent the average value. Nssupp
corre-sponds the average of additional sources obtained for all subjects, instruments and repetitions of an extract broad-cast in a given quality.
The effects of quality and mix type on the number of additional sources perceived are shown in Fig. 4. ANOVA revealed significant effects of quality (QU AL : F1,19 =
27, 643, p ≤ 0, 001), and mix type (M IX : F3,57 =
12, 390, p ≤ 0, 001) on this descriptor. The number of per-ceived phantom sources is significantly higher in the case of degraded scenes than in the case of reference scenes. There is also a significant interaction between quality and mix type (F3.57 = 10.469, p ≤ 0.001). This
interac-tion reflects the fact that the effect of quality varies greatly from one mix to another. Indeed, as shown on Fig. 4 ghost sources are heard much more frequently for mix 2 than for the others. Mix 1, on the other hand, presented almost no additional sources.
4.2 Effects on the perceived source width
The quality and type of mix also have a significant influ-ence on the perceived width of the instruments, as shown in Fig. 5. The ANOVA gives for quality QU AL: F1.19 =
8.4072, p ≤ 0.01 and for mix type M IX: F3.57 = 7.1599,
p ≤ 0.005. According to Fig. 5, degraded sources are per-ceived on average to be larger than intact sources. It can also be noted that the width estimation is subject to great variability. This figure also highlights the differences on the estimated area of the instruments as a function of the mix type. It appears that on average the instruments of mix 2 were perceived to be larger than those of the other extracts. Extract n1 is not significantly different from the others, however, the evaluation of the width of its sources is subject to great variations from one individual to another.
Figure 5. Cross effects of quality and mix type on per-ceived source width.
4.3 Effects on azimuth localization error
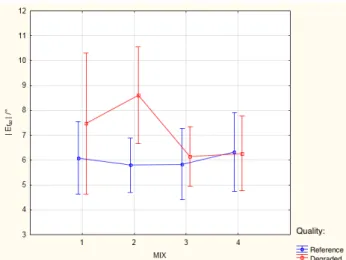
Figure 6. Cross effects of quality and mix type on azimutal localization error.
The results of the ANOVA for azimutal localization er-ror are shown in figure Fig. 6. Only quality has a sig-nificant influence on this descriptor (F1.19 = 4.9737,
p ≤ 0.05). The azimutal localization error is on average 6 for the reference versions and 7 for the degraded versions. This difference is relatively small regarding general human localization performances in the azimutal plane. No signif-icant variation in azimuth error is observed depending on the type of mix.
5. DISCUSSION
The results of this experiment shows perceptible dif-ferences between sound scenes composed by separated sources and clean sound scenes. First, the number of per-ceived phantom sources increases significantly in degraded scenes. This is due to the fact that the source separa-tion process generates distorsepara-tions such as rejecsepara-tions. That is, since the source estimation is not perfect, portions of
the signal from one source can be attributed to the other sources of the mixture. In a spatial remix context, this means that portions of the target source are broadcast on several channels simultaneously. When the rejections are very different from the source signal in terms of temporal and spectral envelopes, the listener perceives several dis-tinct sources [12] and in this particular case it is perceived has one main source and one or more phantom sources. Percussive instruments characterized in the time-frequency domain by short time activation and wide frequency dis-tribution are very susceptible to rejection problems. It should be noted that phantom sources are not necessarily perceived at the position of the sources in which the rejec-tions appear. Generally speaking, they were perceived as high and very volatile, which made their location tedious.
Second, this study reveals that the sources have been generally perceived as broader in the case of scenes de-graded by source separation. The presumed reasons for this enlargement are diverse. Source rejections seem to be a plausible cause of this expansion. Indeed, Blauert [10] showed that if two coherent sources are broadcast simul-taneously, they can be perceived as one large source de-pending on their coherence level. If rejections are coher-ent enough the result can be perceived as one large source. Moreover, it seems that the poor estimation of impulse re-sponses at low frequency for the initialization of the sepa-ration algorithm has an influence on source widening since it has mainly been observed for low frequency instruments (e.g. the bass part of mix 2).
Figure 7. Examples of plots made by subjects. Black squares: real position of the source, blue curves: drawn plots, red curves: fitting ellipses, red dots: center of el-lipses. From left to right and top to bottom: source per-ceived as punctual, source perper-ceived as wide, additional source perceived and source perceived as unstable.
This is linked to enlargement and the perceived instabil-ity of position for some sources. Indeed, on the one hand when the sources are large, the estimation of the position of the source’s barycentre is more imprecise and on the other hand when the sources position is unstable, it is difficult to judge a central position of the source. Some subjects have managed in their drawings to account for this phenomenon (see Fig. 7) but the elliptical approximation of these plots is no longer appropriate. In addition, the reporting method implemented proved to be effective and particularly well adapted to the task the subjects were to perform. However, the diversity of the cases presented is not fully represented by this method. For example, it does not distinguish the case of an extended source from the case of a source with an unstable position.
6. CONCLUSION
Our study revealed that a source separation process could lead to perceptible degradations in the spatial image of spa-tialized musical sound scenes. Three types of degradation were observed. In the majority of degraded cases, we see the emergence of ” phantom ” sources, an increase in the perceived width of the sources and an increase in the er-ror made in the localization task. Percussive or harmonic rejections seems to be one cause of disturbance in the spa-tial image. On the other hand, the approximation of the impulse responses used to initialize the separation algo-rithm may have negative impact on the estimation of target sources at low-frequency. Therefore, to have an accurate restitution of the spatial image from separate sources, it would be necessary, according to this study, to minimize the error in estimating the impulse responses of the differ-ent sources and to reduce the rejection rate.
In addition, the study was conducted on subjects with different profiles and different listening skills. Some sub-jects were not sensitive to differences in conditions. Oth-ers, on the contrary, paid particular attention to the details of the sound scenes. It would therefore be interesting to further characterize the degradation, by running this test on an expert audience of spatialized listening. In the fu-ture, other sound examples could be studied, in particular examples that are more difficult to solve for the source sep-aration algorithm, such as scenes composed exclusively of instruments with similar timbres (e.g. string quartet), per-cussion ensembles or environmental sounds. We chose as a first study to focus on a simple case of spatialization: with no virtual sources. A new experiment would consist in studying the performance of other spatialization tech-niques such as VBAP or HOA in a context of restitution of sound scenes resulting from a separation process.
7. ACKNOWLEDGMENTS
This work was made possible thanks to the help of Simon Leglaive, Roland Badeau and Ga¨el Richard from LTCI -T´el´ecom ParisTech, who provided us with the audio source separation algorithm used for this study.
[1] S. Leglaive, R. Badeau, and G. Richard, “Multichannel audio source separation: variational inference of time-frequency sources from time-domain observations,” in 42nd International Conference on Acoustics, Speech and Signal Processing (ICASSP), 2017.
[2] S. Spors, H. Wierstorf, A. Raake, F. Melchior, M. Frank, and F. Zotter, “Spatial sound with loud-speakers and its perception: A review of the cur-rent state,” Proceedings of the IEEE, vol. 101, no. 9, pp. 1920–1938, 2013.
[3] J. Kornycky, B. Gunel, and A. Kondoz, “Comparison of subjective and objective evaluation methods for au-dio source separation,” in Proceedings of Meetings on Acoustics 155ASA, vol. 4, p. 050001, ASA, 2008. [4] B. Fox, A. Sabin, B. Pardo, and A. Zopf, “Modeling
perceptual similarity of audio signals for blind source separation evaluation,” in International Conference on Independent Component Analysis and Signal Separa-tion, pp. 454–461, Springer, 2007.
[5] V. Emiya, E. Vincent, N. Harlander, and V. Hohmann, “Subjective and objective quality assessment of au-dio source separation,” IEEE Transactions on Auau-dio, Speech, and Language Processing, vol. 19, no. 7, pp. 2046–2057, 2011.
[6] C. F´evotte, R. Gribonval, and E. Vincent, “Bss eval toolbox user guide–revision 2.0,” 2005.
[7] Q. Liu, W. Wang, P. J. Jackson, and T. J. Cox, “A source separation evaluation method in object-based spatial audio,” in 2015 23rd European Signal Process-ing Conference (EUSIPCO), pp. 1088–1092, IEEE, 2015.
[8] E. Vincent, M. G. Jafari, S. A. Abdallah, M. D. Plumb-ley, and M. E. Davies, “Blind audio source separa-tion,” Queen Mary, University of London, Tech Report C4DM-TR-05-01, 2005.
[9] A. Ozerov and C. F´evotte, “Multichannel nonnega-tive matrix factorization in convolunonnega-tive mixtures for audio source separation,” IEEE Transactions on Au-dio, Speech, and Language Processing, vol. 18, no. 3, pp. 550–563, 2010.
[10] J. Blauert, Spatial hearing: the psychophysics of hu-man sound localization. MIT press, 1997.
[11] G. Parsehian, L. Gandemer, C. Bourdin, and R. K. Martinet, “Design and perceptual evaluation of a fully immersive three-dimensional sound spatialization sys-tem,” in 3rd International Conference on Spatial Audio (ICSA 2015), 2015.
[12] A. S. Bregman, Auditory scene analysis: The percep-tual organization of sound. MIT press, 1994.