RESEARCH OUTPUTS / RÉSULTATS DE RECHERCHE
Author(s) - Auteur(s) :
Publication date - Date de publication :
Permanent link - Permalien :
Rights / License - Licence de droit d’auteur :
Bibliothèque Universitaire Moretus Plantin
Institutional Repository - Research Portal
Dépôt Institutionnel - Portail de la Recherche
researchportal.unamur.be
University of Namur
Study of carbon nitride compounds synthesised by co-implantation of 13C and 14N in
copper at different temperatures
Colaux, J.L.; Louette, P.; Colomer, J.-F.; Edmondson, P.D.; Donnelly, S.E.; Terwagne, G.
Published in:
Materials Chemistry and Physics
DOI:
10.1016/j.matchemphys.2010.11.016
Publication date:
2011
Document Version
Peer reviewed version
Link to publication
Citation for pulished version (HARVARD):
Colaux, JL, Louette, P, Colomer, J-F, Edmondson, PD, Donnelly, SE & Terwagne, G 2011, 'Study of carbon
nitride compounds synthesised by co-implantation of 13C and 14N in copper at different temperatures', Materials
Chemistry and Physics , vol. 126, no. 1-2, pp. 337-343. https://doi.org/10.1016/j.matchemphys.2010.11.016
General rights
Copyright and moral rights for the publications made accessible in the public portal are retained by the authors and/or other copyright owners and it is a condition of accessing publications that users recognise and abide by the legal requirements associated with these rights. • Users may download and print one copy of any publication from the public portal for the purpose of private study or research. • You may not further distribute the material or use it for any profit-making activity or commercial gain
• You may freely distribute the URL identifying the publication in the public portal ?
Take down policy
If you believe that this document breaches copyright please contact us providing details, and we will remove access to the work immediately and investigate your claim.
and sharing with colleagues.
Other uses, including reproduction and distribution, or selling or
licensing copies, or posting to personal, institutional or third party
websites are prohibited.
In most cases authors are permitted to post their version of the
article (e.g. in Word or Tex form) to their personal website or
institutional repository. Authors requiring further information
regarding Elsevier’s archiving and manuscript policies are
encouraged to visit:
Author's personal copy
Materials Chemistry and Physics 126 (2011) 337–343
Contents lists available atScienceDirect
Materials Chemistry and Physics
j o u r n a l h o m e p a g e :w w w . e l s e v i e r . c o m / l o c a t e / m a t c h e m p h y s
Study of carbon nitride compounds synthesised by co-implantation of
13
C and
14
N in copper at different temperatures
J.L. Colaux
a,∗, P. Louette
b, J.-F. Colomer
c, P.D. Edmondson
d, S.E. Donnelly
d, G. Terwagne
aaLARN, Research Center in Physics of Matter and Radiation (PMR), University of Namur (FUNDP), 61 Rue de Bruxelles, 5000 Namur, Belgium bLISE, Research Center in Physics of Matter and Radiation (PMR), University of Namur (FUNDP), 61 Rue de Bruxelles, 5000 Namur, Belgium cLPS, Research Center in Physics of Matter and Radiation (PMR), University of Namur (FUNDP), 61 Rue de Bruxelles, 5000 Namur, Belgium dInstitute for Materials Research, University of Salford, Gtr. Manchester M5 4WT, UK
a r t i c l e i n f o
Article history:
Received 31 August 2009
Received in revised form 5 November 2010 Accepted 11 November 2010 Keywords: Fullerenes Nanostructures Electron microscopy XPS Tribology
a b s t r a c t
Carbon nitride compounds have been synthesised in copper by simultaneous high fluence (1018at. cm−2)
implantation of13C and14N ions. During the implantation process, the substrate temperature was
main-tained at 25, 250, 350 or 450◦C. Depth profiles of13C and14N were determined using the non-resonant
nuclear reactions (NRA) induced by a 1.05 MeV deuteron beam. The retained doses were deduced from NRA measurements and compared to the implanted fluence. The chemical bonds between carbon and nitrogen were studied as a function of depth and temperature by X-ray photoelectron spectroscopy (XPS). The curve fitting of C 1s and N 1s core level photoelectron spectra reveal different types of C–N bonds
and show the signature of N2molecules. The presence of nitrogen gas bubbles in copper was highlighted
by mass spectroscopy. The structure of carbon nitride compounds was characterised by transmission electron microscopy (TEM). For that purpose, cross-sectional samples were prepared using a focused ion beam (FIB) system. TEM observations showed the presence of small amorphous carbon nitride “nano-capsules” and large gas bubbles in copper. Based on our observations, we propose a model for the growth of these nano-objects. Finally, the mechanical properties of the implanted samples were investigated by nano-indentation.
© 2010 Elsevier B.V. All rights reserved.
1. Introduction
Since the prediction of its highly interesting physical proper-ties in 1990[1], the synthesis of the super-hard crystalline-C3N4
phase has been extensively investigated. Although the fully crys-talline phase has still not been reached, a wide variety of elaborate techniques such as reactive sputtering, chemical vapour deposition, pyrolysis of organic materials, laser deposition and ion implanta-tion have been developed to synthesise this elusive carbon nitride structure[2–9]. Until now, this work has mainly focused on non-equilibrium synthesis conditions in order to prevent the formation of thermodynamically stable phases and reach the required 57 at.% of nitrogen to form the metastable-C3N4phase. However, despite
pronounced non-equilibrium and energetic growth conditions, the nitrogen content in the resulting amorphous CxNymaterial rarely
surpasses 30%. The nitrogen deficiency in the CxNymaterial seems
to be due to the chemical desorption of volatile nitrogen-containing species from the growing film surface[10]. This phenomenon, first
observed for ion beam assisted deposition[11], is predominant
∗ Corresponding author. Tel.: +32 81 72 54 79; fax: +32 81 72 54 74. E-mail address:[email protected](J.L. Colaux).
for all plasma-assisted techniques and limits the level of nitrogen incorporation [12]. The nitrogen deficiency in the CxNy material
can also be due to the inherent drive of nitrogen to form strongly covalent bonded N2molecules, which then readily desorb[13].
In this work, the co-implantation of carbon and nitrogen in cop-per was used to synthesise the C3N4like compounds. This process
has some advantages compared to reactive sputtering. Indeed, the interaction between carbon and nitrogen atoms during the implan-tation process was enhanced due to their simultaneous arrival within the substrate, and their very low solubility inside copper favoured their precipitation into carbon nitride compounds. More-over, the high compressive stresses applied by the matrix on the precipitates favoured compact growing structures[14,15]. Finally,
the implantations were performed at medium energies (Table 1)
so that the carbon and nitrogen atoms were buried from 200 to 900 nm in depth, preventing any chemical desorption of volatile nitrogen-containing species. Several implantations were then per-formed at 25, 250, 350 or 450◦C in order to study the influence of the temperature on the CxNyformation. The samples were fully
characterised by NRA, XPS, TEM and nano-indentation methods in order to determine the carbon and nitrogen depth profiles, the C–N type bonds, the CxNystructures and the physical properties of the
implanted areas, respectively.
0254-0584/$ – see front matter © 2010 Elsevier B.V. All rights reserved. doi:10.1016/j.matchemphys.2010.11.016
338 J.L. Colaux et al. / Materials Chemistry and Physics 126 (2011) 337–343
Table 1
Energies and calculated (RSRIM) and experimental (Rexp) projected ranges of CN+, 13Cp+and14Nq+ions implanted in copper with a terminal voltage of 400 kV on our Tandetron accelerator. As the CN molecule is broken hitting the surface of copper sample, the projected range of13C14N+corresponds to average of the ones of13C at 401 keV and14N at 432 keV.
Ion species E (keV) RSRIM(nm) Rexp(nm) 13C14N+ 833 429 440 13C 208 257 280 13C+ 608 606 650 13C2+ 1008 866 910 14N 225 240 260 14N+ 625 550 600 14N2+ 1025 775 820 2. Experimental
2.1. Materials and substrate implantation
The samples were polished polycrystalline copper substrates (12 mm in diam-eter and 1.5 mm in thickness) which were simultaneously implanted with13C and 14N atoms using the non-deflected beam line of the 2 MV ALTAÏS1accelerator at
LARN.2In this system, a large variety of CN+, Cp+and Nq+(p, q = 0, 1 or 2) cations are produced and co-implanted into the sample with an energy determined by the terminal voltage of the accelerator and their state of charge (Table 1)[16]. During the implantation procedure, the substrate temperature was maintained at 25, 250, 350 or 450◦C and the implantation chamber pressure did not exceed 5× 10⁻⁶mbar. The current density of the ion beam was approximately 80A cm−2and the total fluence was about 1018at. cm−2over an area of 3 mm in diameter.
An implantation of13C and15N was performed in order to highlight the presence of nitrogen gas bubbles into the copper sample by mass spectroscopy. The tem-perature of implantation was fixed at 250◦C. All other parameters of implantation remained unchanged.
2.2. Sample characterisation
The depth distributions of carbon and nitrogen within copper were studied using (d, p) and (d,␣) non-resonant nuclear reactions induced on light elements (12C,13C, 14N and/or15N) by a 1.05 MeV deuteron beam. The experimental set-up used to perform these measurements was presented in a previous work[17].
XPS depth profile procedures were performed to study the composition and the nature of the carbon nitride compounds synthesised during the ion implanta-tion. One depth profile procedure consists of about 30 cycles of recording the C 1s, N 1s, O 1s and Cu 2p3/2peaks followed by etching of the sample. XPS spectra were recorded with a SSX 100 spectrometer system (Surface Science Instrument) equipped with a constant pass energy hemispherical electron analyser. For each cycle, the chemical composition of the sample was measured from the calculated areas of the detected XPS peaks, performing Shirley background subtraction and taking into account sensitivity factors for each line of constituent. The depth profile of the sample is then obtained by converting the etching time into a nanometric depth scale[16]. Moreover, for each cycle, the spectra were referenced to the Cu 2p3/2metallic copper line set at binding energy of 932.7 eV. The peaks were fitted using mixed Gaussian–Lorentzian curves (70–30%). Binding state information was then determined from chemical shifts observed on the binding energy scale after the curve fitting of XPS peaks. More details about the experimental set-up and the XPS depth profile procedure were recently published[16].
A mass spectrometer Dycor from Ametek Company was used to confirm the presence of nitrogen gas bubbles assumed by XPS measurements. This spectrometer was able to analyse mass from 1 to 100 amu with a mass resolution of 0.5 amu and a sensitivity of 6× 10⁻¹²mbar (minimal partial pressure detectable). It was connected to a small analysis chamber which maintained an initial pressure of 6× 10⁻⁷mbar. To perform the analysis, the N2molecules had to be released from the copper matrix by dissolving the sample within a small quantity of iron perchloride acid. The acid was placed into a test tube equipped with a platform allowing us to initially keep the sample apart from the acid. As the vapour pressure of the water contained within the acid is around 20 mbar, we used a leak valve to connect the test tube to the analysis chamber and limit the residual pressure inside the mass spectrometer to 8× 10⁻⁵mbar. The trend of 16 and 18 amu peaks intensity, related to the vapour of water released by the acid, were then followed using the mass spectrometer. When intensity of these signals became stable, the mass spectrometer switched to follow the trend of 30 amu peak intensity, and the implanted sample was dropped into acid by tapping the test tube. This experiment was performed using a sample implanted with13C and15N atoms in order to separate the15N2signal (mass 30) from the
1Accélérateur Linéaire Tandetron pour l’Analyse et l’Implantation des Solides. 2Laboratoire d’Analyses par Réactions Nucléaires.
intense signal coming from the12C16O molecules (mass 28) present in the residual pressure of the analysis chamber.
The carbon nitride structures synthesised during the ion implantation were characterised by TEM using a JEOL 3010 (operating at 300 keV) and a CM20 Philips microscopes (operating at 200 kV). EELS measurements were performed on a Philips CM-30-FEG microscope equipped with a post-column GIF200 system. The spectrum was recorded operating the microscope in the diffraction mode with an accelerating voltage of 300 kV and a spectrometer collection angle of 2.5 mrad. Cross-sectional TEM view was required to observe the buried carbon nitride compounds in the cop-per. This was carried out using a double-beam FIB system consisting of a JEOL 5910 SEM coupled to a Orsay Physics ion column. The 30 keV Ga+FIB beam, oriented at 60◦ with respect to the electron beam, allowed us to very precisely mill specific areas with a minimum damage caused to the area of interest[18]. The cross-sectional preparation of implanted samples was performed step by step. We used first a large beam current (∼1 nA) to mill two trenches on either side of the area of interest. Their typical dimensions were 10m × 10 m × 4 m (length, width and depth), and the space left between them was about 3m in order to obtain a slide of the implanted sample of about 10m × 3 m × 4 m. This slide was then thinned using a succession of smaller beams: 600 pA thinning down to 1m; followed by 250 pA to 400–300 nm; and finally 100 pA to 200–100 nm. At this point, the sample was tilted by 45–60◦to cut the sides and underside of the thinned slide in order to free it. The slide was then lifted out using a glass rod under an optical microscope (×20 magnification) and placed on a TEM grid with 300 mesh coated with a very thin carbon film, ready for microscopy.
The mechanical properties of the implanted samples were studied using a Hysitron Inc. Triboindenter. The system has a load resolution of 0.1N and a dis-placement resolution of 0.1 nm, which creates indentation curves on the nanometre scale. Experiments were performed using a Berkovich indenter having a face angle of 65.3◦. The tip area function was calibrated using fused quartz as reference[19]. Six series of indents were made for each sample: three inside and three outside the implanted area. Each series consisted of 25 indents ranging from 400N to 10 mN in 400N steps. The indent schedule used was 5 s, 10 s and 5 s for the load-ing, holding and unloading segment duration, respectively. After each indent, the load–displacement curve was recorded and the tip was moved 10m to perform the following indent. For each load–displacement curve, the unloading part was fit-ted with a power law in order to derive the local stiffness. The hardness and reduced Young’s modulus were then calculated using the method described by Oliver and Pharr[19].
3. Results and discussion
In the following section we present first the results obtained by NRA and we compare them to the carbon and nitrogen depth pro-files deduced from the XPS measurements. The presence of nitrogen gas bubbles in copper, suggested by this comparison, is then high-lighted by mass spectroscopy. The characteristic C–N bonds as a function of depth and temperature of implantation are discussed on the basis of N 1s and C 1s XPS curve fitting. Thereafter, we present the TEM results showing the structure of the carbon nitride com-pounds, and we finish by determining the mechanical properties of the implanted samples.
3.1. Carbon and nitrogen depth profiles
The experimental spectra recorded by nuclear reaction
anal-ysis (not shown here) can be fitted with the SIMNRA code[20].
The target composition used by this software has to be adjusted in order to obtain the best agreement between the experimental and the simulated curves[16]. The carbon (open circles) and nitro-gen (open squares) depth profiles, obtained by this method for the sample implanted at 250◦C, are shown inFig. 1a and b, respec-tively. A surface contamination of carbon is clearly observed. This contamination is attributed to the carbon build-up phenomenon occurring during the implantation process. It is less significant when the implantation temperature increases. The carbon and nitrogen depth profiles may be decomposed in a combination of Gaussian curves assigned to the different implanted ion species. This decomposition is not represented inFig. 1, but the positions of each Gaussian curve maximum are reported inTable 1. It can be seen that there is very good agreement between these positions (Rexp) and the projected ranges calculated by SRIM2003 (RSRIM)
Author's personal copy
J.L. Colaux et al. / Materials Chemistry and Physics 126 (2011) 337–343 339
0 20 40 60 80 100 900 750 600 450 300 150 0 0 5 10 15 20 0 5 10 15
(b) Nitrogen
(a) Carbon
Concentration (at. %) Depth (nm)Fig. 1. Concentration depth distributions of carbon and nitrogen calculated from
SIMNRA open symbols and CasaXPS (solid symbols) simulations for the copper sample simultaneously implanted with13C and14N at 250◦C.
quite limited during the implantation process. This remains true at all implantation temperatures. Finally, converting the nanomet-ric scale in a 1015at. cm−2scale, the integral of depth profiles allow
us to estimate the incorporated carbon and nitrogen atomic densi-ties into copper. The results are presented inTable 2(DR– NRA) for
each implanted sample. The retained doses evaluated for carbon and nitrogen are very close to the fluence (divergence lower than 10%) regardless of the implantation temperature, which implies that carbon and nitrogen migration and surface release processes did not occur during the implantation.
The carbon (solid circles) and nitrogen (solid squares) depth profiles obtained by XPS for the same sample are presented in
Fig. 1a and b, respectively. The agreement between the NRA and XPS carbon depth profiles is very good, even if the XPS one is slightly broader and less intense due to the roughness induced by the etching process. The carbon retained doses deduced from XPS measurements (DR– XPS) for the different temperature of
implan-tation are reported inTable 2. These values are very close to the initial fluence and the carbon retained doses evaluated by NRA (DR
– NRA). On the other hand, the nitrogen depth profile obtained by XPS is strongly different from the NRA one (Fig. 1b). As reported in
Table 2, the nitrogen retained doses, deduced from XPS results for the different implantation temperatures, represent only about 30% of the nitrogen retained doses evaluated by NRA. This strong diver-gence is explained by assuming that the majority of the implanted nitrogen atoms precipitate into gas bubbles. These bubbles then burst during XPS etching process releasing the N2molecules into
the chamber before the XPS analysis is performed. The presence of nitrogen gas bubbles inside copper was highlighted by the mass spectroscopy analysis of the sample implanted with13C and15N
400 300 200 100 0 1,4x10⁻⁹ 1,6x10⁻⁹ 1,8x10⁻⁹ 2,0x10⁻⁹
Partial pressure of mass 30 (mbar)
Time (s)
Fig. 2. Time evolution of the 30 amu partial pressure recorded by mass spectroscopy.
The arrow indicates when the implanted sample was dropped into the iron perchlo-ride acid.
atoms. The evolution of the 30 amu partial pressure as a function of time is shown inFig. 2. The arrow indicates when the implanted sample was dropped into the acid. A few seconds later, we can clearly observe an abrupt increase of the 30 amu partial pressure which rapidly returns to its initial level. Although qualitative, this result proves the presence of nitrogen gas in the implanted sample. 3.2. Characterisation of chemical bonds
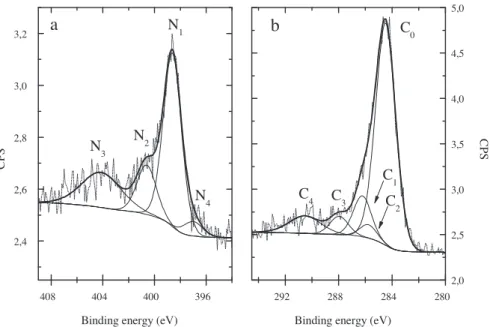
The signature of N2molecules can also be observed in the N 1s
core level photoelectron spectrum which is shown inFig. 3a. This spectrum was recorded at 645 nm depth for the sample implanted at 250◦C. According to the literature[22], the rather broad and well separated component N3(centred at 404.1 eV, FWMH = 3.6 eV)
can be attributed to nitrogen gas molecules. Two other compo-nents (N1and N2) can be clearly resolved in this spectrum. The N1
component (centred at 398.6 eV, FWMH = 1.7 eV) is assigned to the
nitriles (–C N) and pyridine (C–N C) type bonds while N2
(cen-tred at 400.6 eV, FWMH = 1.8 eV) is attributed to sp2 C–N bonds
[23–25]. The N4component (centred at 397.2 eV, FWMH = 1.7 eV)
may be added in the low energy tail of the N 1s peak. It is assigned to the C3N4structure.
The C 1s core level photoelectron spectrum, acquired on the same sample and at the same depth, is presented inFig. 3b. The asymmetry of the main peak towards the higher binding energy reveals the presence of C–N and C–O bonds due to the higher electronegativity of nitrogen and oxygen. Nevertheless, contrary to the N 1s spectrum, no component can easily be distinguished. Based on the information resulting from the N 1s and O 1s lines (not shown here), five components have been used to fit the
C 1s spectrum. The major component C0 (centred at 284.4 eV,
FWMH = 1.8 eV) is attributed to carbon atoms bonded to carbon
Table 2
Fluence and carbon and nitrogen retained doses evaluated by nuclear reaction analysis (DR– NRA) and X-ray photoelectron spectroscopy (DR– XPS) for the samples implanted at 25, 250, 350 and 450◦C. Temperature of implantation (◦C) Carbon Nitrogen Fluence (1017at. cm−2) DR– NRA (1017at. cm−2) DR– XPS (1017at. cm−2) Fluence (1017at. cm−2) DR– NRA (1017at. cm−2) DR– XPS (1017at. cm−2) 25 5.0 4.7 4.6 5.0 5.1 1.5 250 5.0 4.9 5.0 5.0 4.6 1.3 350 5.0 4.8 4.7 5.0 4.5 1.2 450 5.0 4.8 4.5 5.0 4.8 1.5
340 J.L. Colaux et al. / Materials Chemistry and Physics 126 (2011) 337–343 396 400 404 408 2,4 2,6 2,8 3,0 3,2 280 284 288 292 2,0 2,5 3,0 3,5 4,0 4,5 5,0
b
CPSC
2C
0C
1C
3 CPSBinding energy (eV)
C
4a
N
4N
1N
2Binding energy (eV)
N
3Fig. 3. N 1s (a) and C 1s (b) XPS spectra recorded at a 645 nm depth for the copper sample implanted with13C and14N at 250◦C. Experimental data are represented by short
dot lines. Solid lines are the results of the curve fitting Gaussian–Lorentzian components and the sum of them.
neighbours, as graphite (sp2) or amorphous (sp3) carbon. The C 1 (centred at 286.3 eV, FWMH = 1.6 eV) is assigned to nitriles (–C N) and pyridine (C–N C) type bonds while the C2(centred at 285.8 eV, FWMH = 1.5 eV) is attributed to sp2C–N bonds[23–26]. In order to
be consistent with the N 1s results, the following constraint was imposed on the C1and C2areas to perform the curve fitting:
0.90 × B(Ni)≤ A(Ci)≤ 1.10 × B(Ni) for i = 1 or 2
where A(Ci) is the peak area of component Ciand B(Ni) is the peak
area of the component Ninormalised by the sensitivity factor of
nitrogen. The C3component (centred at 288.0 eV, FWMH = 1.7 eV)
is assigned to C–O bonds coming from a slight oxidation of the sam-ple occurring during the etching process. C4(centred at 290.5 eV,
FWMH = 2.8 eV) is related to the carbon shake up phenomenon[27]. Each cycle of the XPS depth profile was analysed as described above in order to study the evolution of the different carbon nitride compounds (N1, N2or N4components) as a function of depth.
Dur-ing this procedure, the position and the FWMH of each component did not change by more than 0.2 eV compared to the values given above. Moreover, whatever the depth analysed, the ratio between
the C3 area and the normalised area of the O 1s peak is always
observed to be between 0.85 and 1.15. Besides, the shakeup contri-bution represents always about 15% of the C1peak area. For each
cycle of the XPS depth profile, we calculated the ratios between the atomic concentration of each carbon nitride compound (N1, N2or
N4components) and the total atomic concentration of carbon (sum
of C0, C1, C2, C3and C4components). The mean ratios obtained for
the depth between 200 and 900 nm are presented in the third
col-umn ofTable 3. The first two hundred nanometres were not taken
into account in this average due to the very weak intensity of the C
1s and N 1s signals in this area. The rather large standard deviations reported inTable 3reveal the difficulty in properly performing the exact background fitting of the N 1s and C 1s spectra. This effect is particularly significant for the N4component due to its very weak
peak intensity.
The mean ratios determined for the samples implanted at 25, 350 and 450◦C are also presented inTable 3. We can observe that the sp2and C
3N4type bonds are not influenced by the
tempera-ture of implantation. About 3.8% of the carbon atoms are bonded to nitrogen in the sp2 hybridised state while about 1.9% of the
car-bon atoms are implicated within the C3N4 structure, regardless
of the implantation temperature. The nitrile (–C N) and pyridine (C–N C) type bonds concerned about 13.5% of the carbon atoms as long as the implantation temperature does not exceed 350◦C, and seems to increase to about 19.5% at 450◦C. The standard deviation on the ratio calculated at 450◦C is nevertheless much larger and its value may thus be overestimated. Consequently, the apparent increase of the nitrile and pyridine type bonds at 450◦C will not be discussed in this work. In summary, the incorporation of nitrogen into the carbon nanostructures remains around 20.7% regardless of the implantation temperature (fifth row ofTable 3). The fullerene-like (FL) structure highlighted by TEM (see further) can explain this result. Indeed, the FL structure is generally described as nano-particles composed of concentric graphitic layers of which the curvature is assured by the presence of pentagonal rings. In addi-tion, total energy calculations show that nitrogen incorporation in graphitic sheets favours the formation of pentagons and thus induces the curvature of the sheets[28]. The FL CxNyare however
energetically less stable if more than one carbon is substituted in a ring and/or nitrogen is incorporated next to each other, which from geometrical conditions explains the apparent saturation in
Table 3
Mean ratios between the atomic concentration of nitrile and pyridine C–N bonds ({N1}), sp2C–N bonds ({N2}), C3N4structure ({N4}) or all C–N bonds together ({C–N}total) and the total atomic concentration of carbon ({C}total). These ratios were evaluated for depth between 200 and 900 nm and for the samples implanted at 25, 250, 350 and 450◦C. Temperature of implantation 25◦C 250◦C 350◦C 450◦C {N1}/{C}total 0.148± 0.037 0.126± 0.034 0.131± 0.035 0.195± 0.065 {N2}/{C}total 0.035± 0.007 0.041± 0.005 0.037± 0.007 0.037± 0.006 {N4}/{C}total 0.022± 0.017 0.019± 0.016 0.017± 0.014 0.019± 0.015 {C–N}total/{C}total 0.205± 0.042 0.186± 0.039 0.185± 0.040 0.251± 0.074
Author's personal copy
J.L. Colaux et al. / Materials Chemistry and Physics 126 (2011) 337–343 341
Fig. 4. Lamella of the copper sample implanted at 250◦C, imaged by SEM during the last step of FIB preparation. The arrows point to large empty cavities appearing about 500 nm beneath the sample surface.
maximum nitrogen concentration of approximately 20–25 at.%. Neidhardt et al. confirmed these theoretical predictions by reactive magnetron sputtering[10,29]. In their work, the FL CxNystructure
was studied as a function of the N2fraction in the discharge (varied
from 0.16 to 1) and the substrate temperature (varied from 600◦C to−130◦C). Their results show that, whatever the conditions of
deposition, the nitrogen content in the FL CxNyremains between
18 and 26 at.%, which is in very good agreement with the present work.
3.3. Electron microscopy characterisations
Cross-sectional samples were prepared for the TEM observa-tions.Fig. 4shows a lamella (∼150 nm thick) imaged by SEM during the FIB preparation of the sample implanted at 250◦C. The arrows point to large empty cavities (up to 200 nm) at approximately 500 nm beneath the surface of the sample. These cavities, attributed to large nitrogen gas bubbles, weaken the copper matrix and make the loss of the top-side of the lamella very difficult to avoid during the lift-out procedure. Only some lamellas were then suitable for the TEM observations.
Typical cross-sectional TEM observation, performed on the sam-ple implanted at 250◦C, is shown inFig. 5. The top surface of the sample is in the bottom left-hand corner of the picture. Two dif-ferent nano-objects can be observed: large, bright non-spherical
Fig. 5. Cross-sectional TEM observation performed at low magnification on the
sam-ple implanted at 250◦C. The surface of the copper sample is in the bottom left-hand corner of the image.
Fig. 6. Cross-sectional TEM observation performed at medium magnification on the
sample implanted at 250◦C. Although not visible, the surface of the copper sample is towards the bottom left-hand corner of the image.
cavities and smaller and more spherical nano-capsules. The large cavities are attributed to large nitrogen gas bubbles. Their size ranges from few tens of nanometres to 200 nm and they are mainly concentrated between 400 and 600 nm in depth, which agrees
with the NRA and SEM measurements (Figs. 1 and 4). The
nano-capsules are assigned to the FL CxNycompounds observed by XPS.
They spread out from the surface to more than 900 nm in depth
with a maximum concentration at around 600 nm.Fig. 6presents
another region of the same sample imaged with a higher magnifi-cation. Although not observable, the surface of the sample is again towards the bottom left-hand corner of the picture. The white dot-ted line corresponds to the maximum in the carbon concentration
(∼600 nm depth). The comparison betweenFig. 6and the depth
profile of carbon (Fig. 1a) shows the strong correlation between the FL CxNysize and the carbon concentration. The biggest FL CxNy
(∼20 nm) are close to the maximum in the carbon concentration
while their size decreases with increase of depth, to become only few nanometres at depth at around 900 nm. The size distribution (not shown here) of the FL CxNydeduced fromFig. 6exhibits a
maximum around 12 nm in diameter, which is the typical size of FL structures synthesised by carbon implantation in copper and silver in similar conditions[30–32]. We can also clearly see that the FL CxNyare aggregated along slightly more dark lines of which
the neighbouring areas are completely free from nano-particles. By comparison with the literature[32], we assume that these lines correspond to the copper grain boundaries which behave like pref-erential sites for precipitation of the carbon and nitrogen atoms during the implantation process. Finally, the core of FL CxNy
syn-thesised in this work seems different from the external shells as observed at medium or high magnification inFigs. 6 and 7, respec-tively. The cores of these nano-particles appear more illuminated than the external shells, attributed to a lower density.
All these XPS and TEM observations, as well as researches under-taken by Cabioch et al.[30]and Czigany et al.[29], enabled us to work out a growth model for the FL CxNystructures synthesised by
342 J.L. Colaux et al. / Materials Chemistry and Physics 126 (2011) 337–343
Fig. 7. Cross-sectional TEM observation performed at high magnification on the
sample implanted at 250◦C. The area observed is close to the maximum of carbon concentration (∼600 nm in depth).
model comprises several steps exposed hereafter:
◦ At the beginning of the implantation process, implanted carbon and nitrogen atoms diffuse towards the grain boundaries driven by the chemical gradient due to the immiscibility of carbon and nitrogen inside the copper host matrix.
◦ Due to the randomness of diffusion processes, a new incoming atom can meet another atom and chemically bind to it according the one of the following cases:
• A carbon atom meeting another carbon atom forms sp2bond
like in graphite.
• A nitrogen atom meeting another nitrogen atom forms strongly covalent bonded N2molecule.
• A nitrogen atom meeting a carbon atom forms C–N chemical bond, which again can occur in various ways:
- Nitrogen and carbon atoms form sp3 bond as in the C
3N4
structure, which is the less likely case according to XPS mea-surements (∼2% as shown inTable 3).
- Nitrogen and carbon atoms form nitrile and pyridine or
sp2 C–N bonds (∼18% as shown in Table 3).Any case, as
demonstrated by total energy calculations [28], the nitro-gen incorporation in the graphitic compounds will induce the curvature and then the formation of FL CxNystructures.
◦ New incoming atoms then precipitate and form one of the
chem-ical bonds depicted above, contributing to the growth of N2
bubbles or FL CxNystructures.
This growth model explains the formation of FL CxNy
struc-tures and N2 bubbles observed in this work. In addition, NRA
depth profiles (Fig. 1) showed that nitrogen concentration is always higher than 20% of the carbon concentration, regardless of depth and temperature of implantation. That means that FL CxNy
struc-tures are forming in presence of N2 molecules since, for a same
depth location, all implanted nitrogen atoms cannot be integrated within FL CxNystructures for which the nitrogen content is
lim-ited at about 20 at.%[10,28,29]. That suggests that N2 molecules
are formed before that first shell of FL CxNy structures is
com-pleted. Some of these molecules can consequently be surrounded by the FL CxNystructures, which may explain the lower density
500 400 300 200 100 0 0 1000 2000 3000 4000 5000 6000 Load (µN) Displacement (nm)
Fig. 8. Nano-indentation load–displacement curves acquired at two different
locations inside the irradiated area of the sample implanted at 250◦C. Both mea-surements were performed with the same indent schedule and maximum load (5600N).
of the FL CxNy structures as observed by TEM. This assumption
is supported by EELS measurements (not shown here) acquired on some well isolated FL CxNy. The nitrogen content of the FL
CxNy deduced from EELS measurements was measured to be
about 30 at.%, whereas XPS yielded only about 20 at.% (Table 3). This difference is attributed to the N2 molecules (not taken into
account inTable 3) that could constitute the core of FL CxNy. This
growth model agrees with all measurements presented in this work.
No significant modifications of the FL CxNysize and structure
have been observed as a function of the implantation temperature, which differs from the results obtained by carbon implantation in copper[30]. Indeed, this reference shows that the size of the car-bon nano-structures is increased and its crystallinity is strongly
enhanced when the temperature is varied from 400 to 1000◦C.
Moreover, no FL structures are obtained for implantation temper-atures lower than 600◦C. In contrast, the present work shows that FL CxNystructures can be formed at implantation temperatures
ranging from 25 to 450◦C. This confirms that the incorporation of nitrogen into carbon layers favours the formation of FL structures. The nano-compounds synthesised by co-implantation of carbon and nitrogen in copper remain nevertheless amorphous regardless the implantation temperature.
3.4. Tribological measurements
Fig. 8shows two load–displacement curves acquired at two dif-ferent locations inside the irradiated area of the sample implanted at 250◦C. Although recorded for exactly the same indent sched-ule and maximal load, only one load–displacement curve presents a discontinuity in the loading part. This phenomenon occurred for about 40% of the indents performed inside the implanted areas whereas it was observed for only about 5% outside these areas. Moreover, the discontinuities always appeared between 200 and 500 nm in displacement. We attributed these disconti-nuities to a movement of the copper matrix which is weakened by the large nitrogen gas bubbles highlighted before. As this phenomenon strongly affects the hardness deduced from the load–displacement curve, we decided not to take into account these indents to determine the mechanical properties of the implanted samples. The mean hardness and Young’s modulus evaluated for the copper substrate and the implanted area are
Author's personal copy
J.L. Colaux et al. / Materials Chemistry and Physics 126 (2011) 337–343 343
Table 4
Mean hardness and Young’s modulus values for the substrate and the irradiated area of the samples implanted at 25, 250, 350 or 450◦C.
Temperature of implantation
Hardness (GPa) Young’s modulus (GPa)
Substrate Implanted area Substrate Implanted area 25◦C 0.97± 0.15 1.23± 0.19 106.4± 6.5 95.6± 8.8
250◦C 1.00± 0.14 1.21± 0.20 112.6± 7.3 104.3± 5.8
350◦C 0.93± 0.09 1.17± 0.18 110.2± 7.1 98.5± 8.5
450◦C 0.98± 0.08 1.19± 0.10 104.0± 6.1 97.0± 7.5
reported inTable 4for the samples implanted at 25, 250, 350 and 450◦C.
Irrespective of the implantation temperatures, the hardness and the reduced Young’s modulus of the copper substrate are around 0.97 GPa and 108 GPa, respectively (Table 4). These results corre-spond to the values generally observed in the literature[33,34]. As suggested by the XPS and TEM results, no significant varia-tion of the mechanical properties irradiated area is observed with increase in the implantation temperature. The hardness remains close to 1.20 GPa while the Young’s modulus is about 99 GPa, irre-spective of the temperature. The co-implantation of carbon and nitrogen has thus the ambiguity of enhancing the copper hardness by about 25% while weakening some areas of the sample. Moreover, the hardness achieved in this work remains much lower than that obtained by physical vapour deposition of CxNyfilms (7–18 GPa)
[35].
4. Conclusion
Simultaneous implantation of13C and14N in copper were
per-formed in order to synthesise carbon nitride compounds. The total fluence was fixed at 1018at. cm−2 and the substrate temperature
was maintained at 25, 250, 350 or 450◦C. The retained doses and depth profiles of carbon and nitrogen were determined by NRA. The formation of FL CxNycompounds during the implantation process
was highlighted by XPS and TEM. At least three different config-urations of C–N types bond were formed: the nitrile (–C N) and pyridine (C–N C) type bonds; the sp2C–N bonds; and a very small
contribution of C3N4structure. We have nevertheless shown that
most of the nitrogen precipitates into large gas bubbles. Only about 20% of the implanted14N atoms are contained in the FL C
xNy
struc-tures, whatever the temperature of implantation. Based on our TEM results, the total energy calculations and the works of Cabioch et al., we have proposed a growth model in which the core of FL CxNynano-particles is composed of N2 molecules. Finally, the
nano-indentation measurements have shown that the mechanical properties of copper can be slightly enhanced by13C and14N
co-implantation. The hardness achieved remains nevertheless much lower than that obtained by physical vapour deposition of CxNy
films.
Acknowledgements
The authors thank Prof. G. Van Tendeloo for the use of micro-scopes of EMAT laboratory (University of Antwerp, Belgium). The authors are grateful to T. Cabioch, from the University of Poitiers (France), for helpful discussions on the growth model of the CxNy
structures. The nano-indentation measurements were carried out at the University of Brussels (ULB, Belgium) with the support of Dr. J. Dille. J.-F. Colomer is supported by the FRS-FNRS (Belgium) as Research Associate.
References
[1] A.Y. Liu, M.L. Cohen, Phys. Rev. B 41 (1990) 10727.
[2] K.M. Yu, M.L. Cohen, E.E. Haller, W.L. Hansen, A.Y. Liu, I.C. Wu, Phys. Rev. B 49 (1994) 5034.
[3] L. Maya, D.R. Cole, E.W. Hagaman, J. Am. Ceram. Soc. 74 (1991) 1686. [4] C.M. Niu, Y.Z. Lu, C.M. Lieber, Science 261 (1993) 334.
[5] E. Gyorgy, V. Nelea, I.N. Mihailescu, A. Perrone, H. Pelletier, A. Cornet, S. Ganat-sios, J. Werckmann, Thin Solid Films 388 (2001) 93.
[6] A. Hoffman, I. Gouzman, R. Brener, Appl. Phys. Lett. 64 (1994) 845.
[7] E.A. Romanovsky, O.V. Bespalova, A.M. Borisov, N.G. Goryaga, V.S. Kulikauskas, V.G. Sukharev, V.V. Zatekin, Nucl. Instrum. Methods B 139 (1998) 355. [8] J. Jagielski, N. Moncoffre, P. Delichere, G. Marest, J. Mater. Sci. 34 (1999) 2949. [9] N. Hellgren, M.P. Johansson, E. Broitman, L. Hultman, J.E. Sundgren, Phys. Rev.
B 59 (1999) 5162.
[10] J. Neidhardt, H. Hogberg, L. Hultman, Thin Solid Films 478 (2005) 34. [11] P. Hammer, W. Gissler, Diamond Relat. Mater. 5 (1996) 1152. [12] R. Kaltofen, T. Sebald, G. Weise, Thin Solid Films 308 (1997) 118. [13] A. Badzian, T. Badzian, R. Roy, W. Drawl, Thin Solid Films 354 (1999) 148. [14] C.W. Allen, M. Song, K. Furuya, R.C. Birtcher, S.E. Donnelly, K. Mitsuishi, J.
Elec-tron Microsc. 48 (1999) 1025.
[15] B. Deconninck, F. Bodart, Nucl. Instrum. Methods B 137 (1998) 410. [16] J.L. Colaux, P. Louette, G. Terwagne, Nucl. Instrum. Methods B 267 (2009) 1299. [17] T. Thome, J.L. Colaux, G. Terwagne, Nucl. Instrum. Methods B 249 (2006) 377. [18] L.A. Giannuzzi, F.A. Stevie, Micron 30 (1999) 197.
[19] W.C. Oliver, G.M. Pharr, J. Mater. Res. 7 (1992) 1564.
[20] M. Mayer, SIMNRA, a simulation program for the analysis of NRA, RBS and ERDA, in: J.L. Duggan, I.L. Morgan (Eds.), Proceedings of the 15th International Con-ference on the Application of Accelerators in Research and Industry, American Institute of Physics, University of North Texas, TX, USA, 1998, p. 541. [21] J.F. Ziegler, Nucl. Instrum. Methods B 219–220 (2004) 1027.
[22] A. Nilsson, O. Bjorneholm, H. Tillborg, B. Hernnas, R.J. Guest, A. Sandell, R.E. Palmer, N. Martensson, Surf. Sci. 287 (1993) 758.
[23] N. Hellgren, J.H. Guo, Y. Luo, C. Sathe, A. Agui, S. Kashtanov, J. Nordgren, H. Agren, J.E. Sundgren, Thin Solid Films 471 (2005) 19.
[24] B. Angleraud, N. Mubumbila, P.Y. Tessier, V. Fernandez, G. Turban, Diamond Relat. Mater. 10 (2001) 1142.
[25] T. Ujvári, A. Kolitsch, A. Toth, M. Mohai, I. Bertoti, Diamond Relat. Mater. 11 (2002) 1149.
[26] C. Palacio, C. Gomez-Aleixandre, D. Diaz, M.M. Garcia, Vacuum 48 (1997) 709. [27] J.A. Leiro, M.H. Heinonen, T. Laiho, I.G. Batirev, J. Electron Spectrosc. Relat.
Phenom. 128 (2003) 205.
[28] S. Stafstrom, Appl. Phys. Lett. 77 (2000) 3941.
[29] Z. Czigany, I.F. Brunell, J. Neidhardt, L. Hultman, K. Suenaga, Appl. Phys. Lett. 79 (2001) 2639.
[30] T. Cabioch, M. Jaouen, E. Thune, P. Guerin, C. Fayoux, M.F. Denanot, Surf. Coat. Technol. 128 (2000) 43.
[31] T. Cabioch, E. Thune, M. Jaouen, Chem. Phys. Lett. 320 (2000) 202.
[32] E. Thune, T. Cabioch, P. Guerin, M.F. Denanot, M. Jaouen, Mater. Lett. 54 (2002) 222.
[33] T.H. Fang, W.J. Chang, Microelectron. Eng. 65 (2003) 231.
[34] L.M. Qian, M. Li, Z.R. Zhou, H. Yang, X.Y. Shi, Surf. Coat. Technol. 195 (2005) 264. [35] J. Neidhardt, Z. Czigany, I.F. Brunell, L. Hultman, J. Appl. Phys. 93 (2003) 3002.