RESEARCH OUTPUTS / RÉSULTATS DE RECHERCHE
Author(s) - Auteur(s) :
Publication date - Date de publication :
Permanent link - Permalien :
Rights / License - Licence de droit d’auteur :
Institutional Repository - Research Portal
Dépôt Institutionnel - Portail de la Recherche
researchportal.unamur.be
University of Namur
Clinical performance of three fully automated anti-SARS-CoV-2 immunoassays targeting the nucleocapsid or spike proteins
Favresse, Julien; Cadrobbi, Julie; Eucher, Christine; Elsen, Marc; Laffineur, Kim; Dogné, Jean-Michel; Douxfils, Jonathan
Published in:
Journal of medical virology
DOI:
10.1002/jmv.26669
Publication date:
2020
Document Version
Early version, also known as pre-print Link to publication
Citation for pulished version (HARVARD):
Favresse, J, Cadrobbi, J, Eucher, C, Elsen, M, Laffineur, K, Dogné, J-M & Douxfils, J 2020, 'Clinical performance of three fully automated anti-SARS-CoV-2 immunoassays targeting the nucleocapsid or spike proteins', Journal of medical virology, vol. 93, no. 4, pp. 2262-2269. https://doi.org/10.1002/jmv.26669
General rights
Copyright and moral rights for the publications made accessible in the public portal are retained by the authors and/or other copyright owners and it is a condition of accessing publications that users recognise and abide by the legal requirements associated with these rights. • Users may download and print one copy of any publication from the public portal for the purpose of private study or research. • You may not further distribute the material or use it for any profit-making activity or commercial gain
• You may freely distribute the URL identifying the publication in the public portal ?
Take down policy
If you believe that this document breaches copyright please contact us providing details, and we will remove access to the work immediately and investigate your claim.
This article has been accepted for publication and undergone full peer review but has not been through the copyediting, typesetting, pagination and proofreading process, which may lead to differences between this version and the Version of Record. Please cite this article as doi: 10.1002/jmv.26669.
Acc
ep
ted
Art
icle
Julien Favresse ORCID iD: 0000-0002-9805-049X
Clinical performances of three fully automated
anti-SARS-CoV-2 immunoassays targeting the nucleocapsid or spike
proteins
Julien Favresse1,2*, Julie Cadrobbi1, Christine Eucher1, Marc Elsen1, Kim Laffineur1, Jean-Michel Dogné2, Jonathan Douxfils2,5.
1
Department of Laboratory Medicine, Clinique St-Luc Bouge, Namur, Belgium.
2
Department of Pharmacy, Namur Research Institute for LIfes Sciences, University of Namur, Belgium.
3
Department of Laboratory Medicine, Iris Hospitals South, Brussels, Belgium.
4
Faculty of Medicine, Université libre de Bruxelles, Brussels, Belgium.
5
Qualiblood sa, Namur, Belgium.
*
Correspondence: Julien Favresse
Department of Laboratory Medicine,
Clinique Saint-Luc Bouge
8 Rue Saint-Luc,
B-5000 Bouge, Belgium
Acc
ep
ted
Art
icle
Email: [email protected]Running title: Evaluation of three anti-SARS-CoV-2 assays.
Keywords: COVID-19, SARS-CoV-2, serology, symptom onset, cut-off.
Words (manuscript): 3,068 (excluding references, figures/tables, and legends).
Words (abstract): 145
Number of tables: 1
Number of figures: 1
Number of Supplemental data: 1
Abstract
Introduction
This study assesses the clinical performances of three anti-SARS-CoV-2 assays, namely EUROIMMUN SARS-CoV-2 nucleocapsid (IgG) ELISA, Elecsys anti-SARS-CoV-2 nucleocapsid (total antibodies) assay, and LIAISON anti-anti-SARS-CoV-2 spike proteins S1 and S2 (IgG) assay.
Methods
One hundred and thirty-seven COVID-19 samples from 96 RT-PCR confirmed patients were used to perform the sensitivity analysis. Non-SARS-CoV-2 sera (n = 141) with a potential cross-reaction to SARS-CoV-2 immunoassays were included in the specificity analysis.
Acc
ep
ted
Art
icle
ResultsNone of these tests demonstrated a sufficiently high clinical sensitivity to diagnose acute infection. Fourteen days since symptom onset, we did not reveal any significant difference between the three techniques in terms of sensitivities. However, the Elecsys performed better in terms of specificity.
Conclusion
All three anti-SARS-CoV-2 assays had equivalent sensitivities 14 days from symptom onset to diagnose past-COVID-19 infection. We also confirmed that anti-SARS-CoV-2 determination before day 14 is of less clinical interest.
1. Introduction
Severe Acute Respiratory Syndrome Coronavirus 2 (SARS-CoV-2), the causative agent of coronavirus disease 2019 (COVID-19), has led to significant morbidity and mortality [1]. The number of confirmed cases exceeds 7.8 million and the number of deaths worldwide stands at 431,541 deaths [2].
The considered reference method for the diagnosis of SARS-CoV-2 infection is (real-time) reverse transcription polymerase chain reaction (RT-PCR) in respiratory samples [3]. However, the accuracy of the method depends on several factors including pre-analytical variables like sample type, collection, transport and storage [4]. The time since infection and the viral load are other factors affecting the sensitivity of the RT-PCR [3]. In addition, RT-PCR is not able to detect past infection [5] and the throughput of RT-PCR is also limited because it requires high workload, skillful operators, expensive instrumentation, and crucial biosafety measures [6].
Acc
ep
ted
Art
icle
Access to RT-PCR tests remains limited in many countries worldwide while the virus is present in 188 countries [7].
The detection of anti-SARS-CoV-2 antibodies represents an additional method for the diagnosis of COVID-19, especially in patients who present late, with a low viral load [8]. Detection of anti-SARS-CoV-2 antibodies is also useful to identify convalescent plasma donors and to screen the population to determine seroprevalence [9, 10].
A wide range of serology immunoassays have therefore been developed to complement the RT-PCR, with different SARS-CoV-2 antigen targets and formats [3]. More than 100 manufacturers have notified that they are offering or plan to offer serological testing [11]. Due to the widespread dissemination of these methods and the limited experience with these new assays, it is essential for laboratories to independently validate these methods to assure they are in line with the expected analytical and clinical performances [3, 5, 8, 12-15]. This is also the reason why some national authorities are planning broad validation campaigns to ensure they will offer the population with approved and controlled immunoassays which are cornerstone to fight this pandemic.
The aim of the present study is to assess and compare the clinical performances of three fully automated SARS-CoV-2 immunoassays, namely: EUROIMMUN anti-SARS-CoV-2-nucleocapsid (IgG) ELISA, Elecsys anti-anti-SARS-CoV-2-nucleocapsid (total antibodies) assay, and LIAISON anti-SARS-CoV-2 spike proteins S1 and S2 (IgG) assay.
Acc
ep
ted
Art
icle
2. Material and methods
2.1. Study design
This retrospective study has been conducted from May 6 to 25, 2020 at the clinical biology laboratory of the Clinique Saint-Luc Bouge (SLBO, Namur, Belgium). A total of 137 serum samples were obtained from 96 COVID-19 patients confirmed positive to SARS-CoV-2 by RT-PCR. Antibody kinetics since the onset of symptoms was evaluated in the full cohort of patients. Non-SARS-CoV-2 sera (n = 141) with a potential cross-reaction to SARS-CoV-2 immunoassays were included in the specificity analysis. Clinical performances were evaluated on three different platforms. Analytical performances is only reported for the newly available EUROIMMUN nucleocapsid assay as the analytical performances of the Elecsys anti-SARS-CoV-2-nucleocapsid (total antibodies) assay, and LIAISON anti-SARS-CoV-2 spike proteins S1 and S2 (IgG) assay have already been reported elsewhere [15-18].
2.2. Sample collection
Blood samples were collected from patients into serum-gel tubes (BD Vacutainer® 8.5 mL tubes, Becton Dickinson, New Jersey, USA) or in lithium-heparin plasma tubes (BD Vacutainer® 4.0 mL tubes) according to standardized operating procedures. The manufacturer recommendations authorize the use of these two matrices. Samples were centrifuged for 10 minutes at 1,885 × g (ACU Modular® Pre Analytics, Roche Diagnostics®). One hundred thirty-seven sera from 96 COVID-19 patients were collected from March 21 to May 25, 2020.
The study population displayed the following characteristics: 45 females and 51 males aged 24 to 93 years (mean age = 63 years). Information on the days since the onset of symptoms was retrieved from medical records. Symptoms included fever, cough,
Acc
ep
ted
Art
icle
fatigue, muscle aches, chest pain or pressure, difficulty breathing or shortness of breath, headache, sore throat, diarrhea, loss of taste, and loss of smell. Fever was the most frequent symptom (68.1%), followed by cough (60.4%), fatigue (58.2%), difficulty breathing (45.1%), and muscle aches (31.9%).
Non-SARS-CoV-2 sera with a potential cross-reaction to the SARS-CoV-2 immunoassay were collected before December 2019. Thirty-seven samples were kindly provided by the Department of Laboratory Medicine of Iris Hospitals South in Brussels. Samples have been stored in the laboratory serum biobank at -20°C. Frozen samples were thawed one hour at room temperature on the day of the analysis. Re-thawed samples were vortexed before the analysis.
2.3. Analytical procedures
Three anti-SARS-CoV-2 immunoassays were evaluated:
The anti-SARS-CoV-2-nucleocapsid ELISA (EUROIMMUN Medizinische Labordiagnostika AG, Lübeck, Germany) for the in vitro semiquantitative detection of IgG (also IgA and IgM, according to the insert kit of the manufacturer) to SARS-CoV-2 in human serum and plasma [19]. All measurements were performed on the EUROIMMUN Analyzer I-2P®. The result of a sample is given in the form of a ratio (extinction of patient sample/extinction of calibrator). According to the manufacturer, a ratio <0.80 is considered negative, a ratio ≥0.80 to <1.10 considered borderline, and a ratio ≥1.10 considered positive [19].
The Elecsys anti-SARS-CoV-2 nucleocapsid electrochemiluminescent immunoassay (ECLIA) (Roche Diagnostics, Basel, Switzerland) for the in vitro qualitative detection of total antibodies (including IgG) to SARS-CoV-2 in human serum and plasma. All
Acc
ep
ted
Art
icle
measurements were performed on the cobas® e801 module. The test result is given as a cut-off index (COI). According to the manufacturer, a result <1.00 is considered negative while a result ≥1.00 is considered positive [5].
The LIAISON SARS-CoV-2 spike proteins S1/S2 assay (DiaSorin, Saluggia, Italy) for the in vitro quantitative detection of IgG to SARS-CoV-2 in human serum and plasma. All measurements were performed on the LIAISON-XL analyzer. The test result is given as arbitrary units per mL (AU/mL). According to the manufacturer, a result <12.0 is considered negative, a result ≥12.0 to <15.0 considered borderline, and a result ≥15.0 considered positive [15].
Only one calibration curve was done, and one batch of reagent was used for each of these platforms.
The RT-PCR for SARS-CoV-2 determination in respiratory samples (nasopharyngeal swab samples) was performed on the LightCycler® 480 Instrument II (Roche Diagnostics®) using the LightMix® Modular SARS-CoV E-gene set.
2.4. Assessment of analytical performances (EUROIMMUN assay)
2.4.1. Precision
Precision was evaluated by using 2 pools of human and 2 internal quality controls provided by the manufacturer. Precision estimations were obtained by means of triplicates measurements of aliquots for a total of 5 consecutive days. Aliquots were stored at -20°C between analysis. Calculation was performed according to the Clinical and Laboratory Standards Institute (CLSI) EP15-A3 protocol [20].
Acc
ep
ted
Art
icle
2.4.2. Limit of blank, detection and quantification
The diluent provided by the manufacturer (diluent universal) was used as blank sample to determine the limit of blank (LOB), detection (LOD) and quantification (LOQ). The LOB has been determined by running the blank sample on three separate occasion to verify that the results are well <0.80. The LOD and LOQ have been determined by running 30 analyses of the blank sample using the following equations according the SH GTA 04 document – revision 1 of the COFRAC [21].
- LOD = mean of the 30 measurements + 3*standard deviation - LOQ = mean of the 30 measurements + 10*standard deviation
2.4.3. Linearity
Linearity was evaluated according to CLSI EP-06. A sample with a high total antibody levels (i.e. 9.52) was analyzed and diluted by a factor 2 on 5 consecutive dilutions. The manufacturer’s diluent was used for the dilution. Observed values were compared to the expected ones and polynomial regression was calculated.
2.4.4. Carry-over evaluation
A sample with high IgG value (i.e. 8.92) was run in triplicate (A1, A2, A3) and followed by a negative sample (i.e. 0.10) also run in triplicate (B1, B2, B3). The carry-over formula used is: (B1-B3)/(A3-B3) x 100. A carry-over below 1% is considered negligible.
2.5. Assessment of the clinical specificity
One-hundred forty-one non-SARS-CoV-2 sera were analyzed for determining the cross-reactivity and established the specificity. Thirty-eight sera from COVID-19
Acc
ep
ted
Art
icle
negative healthy subjects and 103 sera from patients with a potential cross-reaction to the SARS-CoV-2 immunoassay were included in this study. Potential cross-reactive samples included positive antinuclear antibodies (n=5), anti-treponema pallidum antibodies (n=3), anti-thyroid peroxidase antibodies (n=3), antibodies RAI+ (search for irregular agglutinins) (n=5), chikungunya antibody (n=1), direct coombs (n=1), hepatitis B antigen (n=7), hepatitis C antibodies (n=7), hepatitis E antibodies (n=4), human immunodeficiency virus antibodies (n=2), IgA Chlamydia pneumoniae (n=1), IgM Borrelia + IgA Helicobacter pylori (n=1), IgM Chlamydia pneumoniae (n=1), IgG Chlamydia trachomatis (n=1), IgG Coxiella burneti (n=2), IgM Coxiella burneti (n=1), IgM cytomegalovirus (n=13), IgM Epstein-Barr virus viral capsid (n=5), IgM Mycoplasma pneumoniae (n=6), IgM parvovirus B19 (n=8), IgM Toxoplasma gondii (n=11), influenza A antibodies (n=4), influenza A and B (n=1), high level of total IgG (17.40 g/L) (normal range: 7.00-16.00 g/L) (n =1), both high levels of total IgM (5.26 g/L; normal range: 0.4-2.3 g/L) and total IgG (28.67 g/L) (n = 1), rheumatoid factor (n=6), urinary infection with Escherichia coli (n=1), urinary infection with Klebsiella oxytoca (n=1). All these samples were collected before the COVID-19 pandemic and were stored at -20°C. The calculation of the specificity was stratified by excluding these cross-reactive samples from the pool of healthy subjects and by combining the two cohorts.
2.6. Assessment of the clinical sensitivity
One hundred and thirty-seven sera obtained from 94 COVID-19 patients were analyzed to calculate the clinical sensitivity. Samples were subdivided according to the following different categories since symptom onset: 0-6 days: 23 sera; 7-13 days: 27 sera; 14-20 days: 24 sera; 21-27 days: 23 sera; 28 days or more: 40 sera. Clinical sensitivity for SARS-Cov-2 serological test depending on the onset of COVID-19
Acc
ep
ted
Art
icle
symptoms was carried out with the manufacturer's cut-off and with ROC curve adapted cut-offs.
2.7. Statistical analysis
Descriptive statistics were used to analyze the data. Sensitivity was defined as the proportion of correctly identified COVID-19 positive patients since symptom onset. Specificity was defined as the proportion of naïve patients or healthy volunteers classified as negative. The ROC area under the curve (AUC) was calculated as the fraction of positive and negative determined according to the manufacturer's cut-off values for positive results. Samples included for ROC curves analyses were sera obtained from at least two weeks after symptoms onset (n = 87), sera selected to assess cross-reactivity (n = 103) and sera from healthy volunteers (n = 38). Data analysis was performed using GraphPad Prism® software (version 8.2.1, California, USA) and MedCalc® software (version 14.8.1, Ostend, Belgium). P value < 0.05 was used as a significance level. Our study fulfilled the Ethical principles of the Declaration of Helsinki.
3. Results
3.1. Assessment of analytical performances (EUROIMMUN assay)
Repeatability and reproducibility results are summarized in Supplemental data 1. Coefficients of variation (CV) are equal or lower to 7.6%. The limit of blank, detection and quantification were 0.033 ± 0.013, 0.072 and 0.164, respectively. For the linearity assessment, the regression equation was: Y= 3.3 + 1.7x - 0.12x2 with a correlation coefficient (R2) of 0.99. Regarding the carry-over, the following ratios have been obtained for the different samples and the different runs: A1 = 8.92, A2 =
Acc
ep
ted
Art
icle
8.90, A3 = 9.19, B1 = 0.10, B2 = 0.11 and B3 = 0.10. The calculated carry-over was 0.0%.
3.2. Assessment of specificity
3.2.1. EUROIMMUN anti-SARS-CoV-2-nucleocapsid (IgG) ELISA
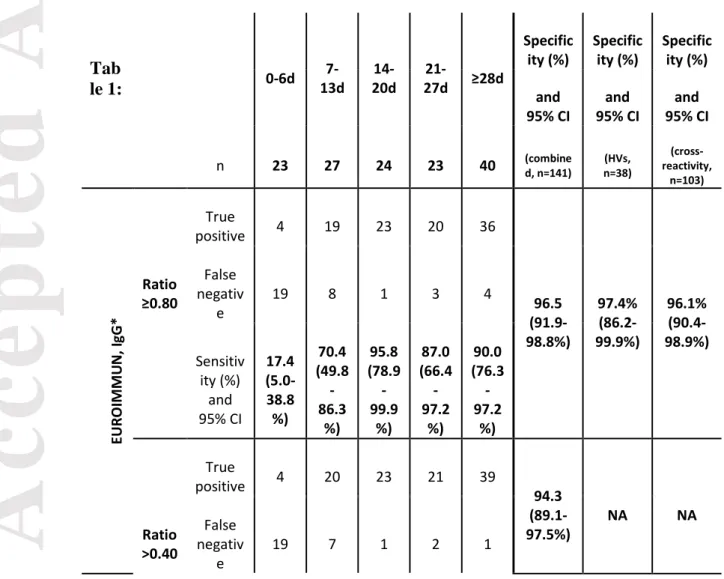
The calculated specificity was 96.5% (136/141) (95% CI: 91.9-98.8%) by using the manufacturer’s cut-off (i.e. ratio ≥0.80) and considering borderline results as false positive. The 5 false positive results were observed with 2 IgM CMV, one HIV antibodies, one hepatitis B Ag, and one in a healthy volunteer (respective ratios of 1.11, 1.35, 1.81, 0.82 and 0.96) using the manufacturer’s cut-off. If considering borderline results as negative (n = 2), the specificity increased to 97.9% (138/141) (95% CI: 93.9-99.6%). Using optimized cut-off (i.e. ratio >0.40 COI), specificity was 94.3% (133/141) (95% CI: 89.1-97.5%). The calculated specificity was 97.4% (95% CI: 86.2-99.9%) and 96.1% (95% CI: 90.4-98.9%) for healthy volunteers and cross-reactive samples, respectively, by using the manufacturer’s cut-off (Table 1).
3.2.2. Elecsys anti-SARS-CoV-2-nucleocapsid (total antibodies) assay
The calculated specificity was 100% (141/141) (95% CI: 97.4-100%) by using the manufacturer’s cut-off (i.e. ≥1.00). Using optimized cut-off (i.e. >0.165 COI) did not alter the specificity. The calculated specificity was 100% (95% CI: 90.8-100%) and 100% (95% CI: 96.5-100%) for healthy volunteers and cross-reactive samples, respectively, by using the manufacturer’s cut-off (Table 1).
3.2.3. LIAISON anti-SARS-CoV-2 spike proteins S1 and S2 (IgG) assay
The calculated specificity was 97.9% (138/141) (95% CI: 93.9-99.6%) by using the manufacturer’s cut-off (i.e. ≥12.0 AU/mL) and considering borderline results as false
Acc
ep
ted
Art
icle
positive. The 3 false positive results were observed with one IgM Toxoplasma gondii, one IgM CMV and one with high level of total IgM (5.26 g/L) and high level of total IgG (28.67 g/L), with respective values of 32.0, 18.6 and 14.4 AU/mL) using the manufacturer’s cut-off. If considering borderline results as negative (n = 1), the specificity increased to 98.6% (139/141) (95% CI: 95.0-99.8%). Using optimized cut-off (ratio >3.94 AU/mL), specificity was 91.5% (129/141) (95% CI: 85.6-95.5%). The calculated specificity was 100% (95% CI: 90.8-100%) and 97.1% (95% CI: 91.7-99.4%) for healthy volunteers and cross-reactive samples, respectively, by using the manufacturer’s cut-off (Table 1).
3.3. Assessment of sensitivity
The calculated sensitivities classified according to different time categories since symptom onset are represented in Table 1. Before 14 days since symptom onset, sensitivities (ranging from 70.4 to 85.2%) were not high enough to be reliably used in clinical practice, especially considering the LIAISON IgG assay.
3.3.1. EUROIMMUN anti-SARS-CoV-2-nucleocapsid (IgG) ELISA
After 2 weeks since symptom onset, the sensitivity was 90.8% (79/87) (95% CI: 82.7-96.0%) by using the cut-off provided by the manufacturer and considering borderline results (n=1) as positive. Using the optimized cut-off, the sensitivity (i.e. ratio >0.40) was 95.4% (83/87) (95% CI: 86.6-98.7%) (Figure 1). The sensitivity increased to 97.5% (39/40) (95% CI: 86.8-99.9%) from 28 days since symptom onset (Table 1).
3.3.2. Elecsys anti-SARS-CoV-2-nucleocapsid (total antibodies) assay
84.1-Acc
ep
ted
Art
icle
off, the sensitivity (i.e. >0.165 COI) was 95.4% (83/87) (95% CI: 88.6-98.7%) (Figure 1). The sensitivity increased to 100% (40/40) (95% CI: 91.2-100%) from 28 days since symptom onset (Table 1).
3.3.3. LIAISON anti-SARS-CoV-2 spike proteins S1 and S2 (IgG) assay
After 2 weeks since symptom onset, the sensitivity was 88.5% (77/87) (95% CI: 79.9-94.4%) by using the cut-off provided by the manufacturer and considering borderline results (n=1) as positive. Using the optimized cut-off, the sensitivity (i.e. >3.94 AU/mL) was 96.6% (84/87) (95% CI: 90.3-99.3%) (Figure 1). The sensitivity increased to 97.5% (39/40) (95% CI: 86.8-99.9%) from 28 days since symptom onset (Table 1).
4. Discussion
Serological testing is a useful strategy for the diagnosis, the characterization of the course of the disease, for identifying convalescent plasma donors as well as for epidemiological study, lockdown exit programs and COVID-19 vaccine development [5, 6, 8, 14, 22]. To date, peer-reviewed data concerning the performances of SARS-CoV-2 immunoassays remained limited, but it is crucial for the society to be confident in the results of these assays. Therefore, independent validations of these methods before broad introduction into routine clinical practice is mandatory given the limited experience of the scientific community with these new assays [6, 10, 14, 23-27]. We report here the external validation of the EUROIMMUN anti-SARS-CoV-2-nucleocapsid (IgG) ELISA. Our results show satisfactory analytical performances. Repeatability and reproducibility studies determined on 2 different pools of sera from patients and 2 internal quality controls were ≤7.3% and ≤7.6%, respectively. The carry-over was negligible, and we found a LOQ of 0.164, which is lower than the
Acc
ep
ted
Art
icle
optimized cut-off of 0.40 we found. Satisfactory analytical performances have also recently been reported for the Elecsys and LIAISON anti-SARS-CoV-2 assays and were not reassessed in this study [15-18, 28].
4.1. Specificity of the three automated assays
The Elecsys assay had a perfect specificity, considering both the manufacturer and the ROC curve adapted cut-off. The LIAISON assay had up to 3 false positive results and the EUROIMMUN assay had up to 5 false positive results. Tang et al. found a specificity of 98.7% on the Elecsys assay using 153 presumed negative specimens [17]. Two false positive results from 2 patients with a negative RT-PCR results but with symptoms. Given that approximately 20% of the RT-PCR results might be falsely negative in COVID-19 patients [14, 29], the fact that Tang et al. considered these 2 patient results as false positive is questionable. For instance, Zhao et al. found that combining RT-PCR and antibody detection significantly improved the sensitivity of pathogenic diagnosis for COVID-19 [9]. In our study, only samples collected before the COVID-19 pandemic were included, excluding any confusion. Using a higher patient cohort of blood donors and ICU patients collected before the COVID-19 outbreak (n = 456), Egger et al. only observed one false positive result on the Elecsys assay [18]. Considering the LIAISON assay, Tré-Hardy et al. found a specificity of 100% and 99% using the manufacturer’s cut-off or an adapted cut-off (i.e. >6.1 AU/mL), respectively [15]. We found lower specificities of 97.9% and 91.5% using the manufacturer’s cut-off or our adapted cut-off (i.e. >3.94 AU/mL). Plebani et al. found similar specificities of 96.8% and 88.9% using the manufacturer’s cut-off or an adapted cut-off (i.e. >6.2 AU/mL).
Acc
ep
ted
Art
icle
The higher specificity observed in the study of Tré-Hardy et al. [15] is probability due to the lower number of samples included (n = 81) for the specificity calculation compared to our study (n = 141) and the one of Plebani et al. (n = 191) [30]. Interestingly, adapted cut-offs proposed on the LIAISON assay were all lower (>3.94, >6.1 AU/mL [15], >6.2 AU/mL [30]) than the manufacturer’s cut-off (i.e. ≥12.0 AU/mL) using 3 independent cohorts of patients. The performances of these optimized cut-offs are not considered clinically different since there is an overlap between 95% confidence intervals.
4.2. Sensitivity of the three automated assays
Current data suggest that seroconversion occurs approximately 7–14 days after symptom onset [6, 14, 31, 32]. While the Elecsys and the EUROIMMUN assays detected more positive results earlier after onset of symptoms than the LIAISON assay, none of the assays demonstrated high enough clinical sensitivity to diagnose acute infection (i.e. <14 days). From 14 days since symptom onset, sensitivities increased for all assays, especially using optimized cut-offs. Using manufacturer’s cutoffs resulted in 8, 10, and 7 false negative specimens for the EUROIMMUN, LIAISON and Elecsys assays, respectively. Optimized cut-offs gave less false negative results (4, 3 and 4, respectively). Because of the overlapping of confident intervals at 95% between assays, we cannot conclude that one assay had a significantly higher true positivity rate.
Two studies having included less patients with symptoms since at least 14 days evaluated the performances of the Elecsys assay [17, 18]. Tang et al. found a sensitivity of 89.4% (n = 47) [17] and Egger et al. a sensitivity of 100% (n=18). By using the manufacturer’s cut-off, we found a somewhat similar sensitivity compared
Acc
ep
ted
Art
icle
to Tang et al. (i.e. 92.0%). However, they did not determine an optimized cut-off to increase the performances of the test. Fourteen days after RT-PCR positivity, Tré-Hardy et al. found a sensitivity of 91% and 100%, using the manufacturer’s and an optimized cut-off on the LIAISON assay [15]. It is important to note that the confidence interval around 100% they found (92-100%) was consistent with our results (i.e. 96.6% sensitivity; 95% CI: 90.3-99.3%). Plebani et al. published results in agreement with our finding with a sensitivity of 97.1% for the LIAISON assay [30].
5. Conclusion
All three anti-SARS-CoV-2 assays had equivalent sensitivities 14 days from symptom onset to diagnose past-COVID-19 infection. We also confirmed that anti-SARS-CoV-2 determination before day 14 is of less clinical interest. However, the Elecsys assay had the higher specificity compared to the EUROIMMUN and the LIAISON assays. Further studies specifically designed to evaluate long-term evolution of antibody response are also needed.
Acknowledgment
We wish to thank the personnel of the Saint-Luc Bouge laboratory for its technical assistance.
Author contributions
FJ, JC, CE, ME, KL, JMD, JD performed the research; FJ, JC, CE, ME, KL, JMD, JD designed the research study, Roche Diagnostics and EUROIMMUN contributed essential reagents or tools; FJ, JC, CE, ME, KL, JMD, JD analyzed the data; FJ wrote the paper.
Acc
ep
ted
Art
icle
Availability of Data: The data that supports the findings of this study are available in
the main manuscript and supplementary material of this article. The detailed clinical/biological/radiological data of COVID-19 confirmed patients are not publicly available due to privacy or ethical restrictions.
Disclosures
Among the authors, Jonathan Douxfils is chief executive officer and founder of QUALIblood sa and reports personal fees from Diagnostica Stago, Roche, Roche Diagnostics, Daiichi-Sankyo, and Portola, outside the submitted work. Roche Diagnostics generously provided the kits for the validation.
References
1. Fauci AS, Lane HC, Redfield RR. Covid-19 - Navigating the Uncharted. N Engl J Med 2020;382:1268-1269.
2. World Health Organization. Coronavirus disease 2019 (COVID-19) Situation Report – 129. 3. Vashist SK. In Vitro Diagnostic Assays for COVID-19: Recent Advances and Emerging
Trends. Diagnostics (Basel) 2020;10.
4. Lippi G, Simundic AM, Plebani M. Potential preanalytical and analytical vulnerabilities in the laboratory diagnosis of coronavirus disease 2019 (COVID-19). Clin Chem Lab Med 2020. 5. Winter AK, Hegde ST. The important role of serology for COVID-19 control. Lancet Infect
Dis 2020.
6. Padoan A, Cosma C, Sciacovelli L, Faggian D, Plebani M. Analytical performances of a chemiluminescence immunoassay for SARS-CoV-2 IgM/IgG and antibody kinetics. Clin Chem Lab Med 2020.
7. Coronavirus Resource Center. Available at: https://coronavirus.jhu.edu/map.html. Accesed: 16 May 2020.
8. Farnsworth CW, Anderson NW. SARS-CoV-2 Serology: Much Hype, Little Data. Clin Chem 2020.
9. Zhao J, Yuan Q, Wang H, Liu W, Liao X, Su Y, et al. Antibody responses to SARS-CoV-2 in patients of novel coronavirus disease 2019. Clin Infect Dis 2020.
10. Tre-Hardy M, Blairon L, Wilmet A, Beukinga I, Malonne H, Dogne JM, et al. The role of serology for COVID-19 control: Population, kinetics and test performance do matter. J Infect 2020.
11. FDA. https://www.fda.gov/medical-devices/emergencysituations- medical-devices/emergency-use-authorizations.
Acc
ep
ted
Art
icle
12. Kirkcaldy RD, King BA, Brooks JT. COVID-19 and Postinfection Immunity: Limited Evidence, Many Remaining Questions. JAMA 2020.
13. Diamandis P, Prassas I, Diamandis EP. Antibody tests for COVID-19: drawing attention to the importance of analytical specificity. Clin Chem Lab Med 2020.
14. Bohn MK, Lippi G, Horvath A, Sethi S, Koch D, Ferrari M, et al. Molecular, serological, and biochemical diagnosis and monitoring of COVID-19: IFCC taskforce evaluation of the latest evidence. Clin Chem Lab Med 2020.
15. Tre-Hardy M, Wilmet A, Beukinga I, Dogne JM, Douxfils J, Blairon L. Validation of a chemiluminescent assay for specific SARS-CoV-2 antibody. Clin Chem Lab Med 2020. 16. Favresse J, Eucher C, Elsen M, Marie TH, Dogne JM, Douxfils J. Clinical performance of the
Elecsys electrochemiluminescent immunoassay for the detection of SARS-CoV-2 total antibodies. Clin Chem 2020.
17. Tang MS, Hock KG, Logsdon NM, Hayes JE, Gronowski AM, Anderson NW, et al. Clinical Performance of the Roche SARS-CoV-2 Serologic Assay. Clin Chem 2020.
18. Egger M, Bundschuh C, Wiesinger K, Gabriel C, Clodi M, Mueller T, et al. Comparison of the Elecsys(R) Anti-SARS-CoV-2 immunoassay with the EDI enzyme linked immunosorbent assays for the detection of SARS-CoV-2 antibodies in human plasma. Clin Chim Acta 2020;509:18-21.
19. EUROIMMUN insert kit, anti-SARS-CoV-2 (IgG) nucleocapsid assay, 2020.
20. CLSI. User Verification of Precision and Estimation of Bias; Approved Guideline – Third Edition. CLSI Document EP15-A3. Wayne, PA: Clinical and Laboratory Standards Institute; 2014.
21. Cofrac. Guide Technique d’Accréditation de Vérification (Portée A)/Validation (Portée B) des Méthodes en Biologie Médicale –Document SH GTA 04 (révision 01), 2015.
22. Long QX, Liu BZ, Deng HJ, Wu GC, Deng K, Chen YK, et al. Antibody responses to SARS-CoV-2 in patients with COVID-19. Nat Med 2020.
23. Tang MS, Hock KG, Logsdon NM, Hayes JE, Gronowski AM, Anderson NW, et al. Clinical Performance of Two SARS-CoV-2 Serologic Assays. Clin Chem 2020.
24. Montesinos I, Gruson D, Kabamba B, Dahma H, Van den Wijngaert S, Reza S, et al. Evaluation of two automated and three rapid lateral flow immunoassays for the detection of anti-SARS-CoV-2 antibodies. J Clin Virol 2020;128:104413.
25. Lippi G, Salvagno GL, Pegoraro M, Militello V, Caloi C, Peretti A, et al. Assessment of immune response to SARS-CoV-2 with fully automated MAGLUMI 2019-nCoV IgG and IgM chemiluminescence immunoassays. Clin Chem Lab Med 2020.
26. Tre-Hardy M, Wilmet A, Beukinga I, Favresse J, Dogne JM, Douxfils J, et al. Analytical and clinical validation of an ELISA for specific SARS-CoV-2 IgG, IgA, and IgM antibodies. J Med Virol 2020.
27. Mairesse A, Favresse J, Eucher C, Elsen M, Tré-Hardy M, Haventith C, et al. High clinical performance and quantitative assessment of antibody kinetics using a dual recognition assay for the detection of SARS-CoV-2 IgM and IgG antibodies. Clinical Biochemistry 2020. 28. Lau C, Hoo S, Yew S, Ong S, Lum L, Heng P, et al. Evaluation Of The Roche Elecsys
Acc
ep
ted
Art
icle
30. Plebani M, Padoan A, Negrini D, Carpinteri B, Sciacovelli L. Diagnostic performances and thresholds: the key to harmonization in serological SARS-CoV-2 assays? Clin Chim Acta 2020.
31. Favresse J, Eucher C, Elsen M, Graux C, Goebels P, Laffineur K, et al. Unexpected kinetics of anti-SARS-CoV-2 total antibodies in two patients with chronic lymphocytic leukemia. Br J Haematol 2020.
32. Favresse J, Eucher C, Elsen M, Laffineur K, Dogne JM, Douxfils J. Response of anti-SARS-CoV-2 total antibodies to nucleocapsid antigen in COVID-19 patients: a longitudinal study. Clin Chem Lab Med 2020
Figure legends
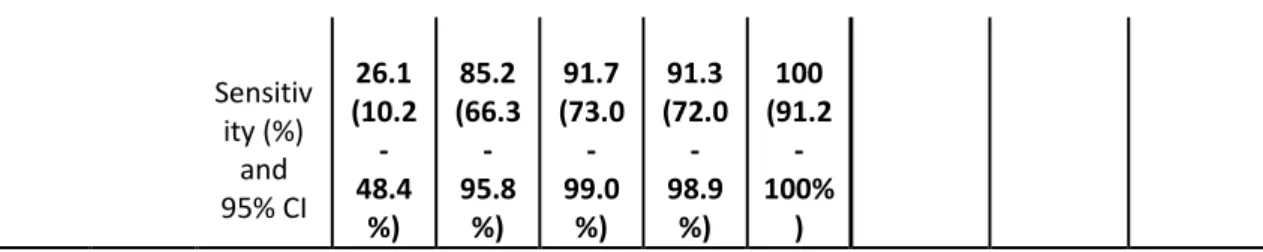
Table 1: Clinical performances of three anti-SARS-CoV-2 immunoassays since
symptom onset with the manufacturer’s cut-off and with optimized cut-offs. * =
the EUROIMMUN IgG assay is also sensitive to IgA and IgM, according to the insert kit of the manufacturer. HVs = healthy volunteers.
Tab
le 1: 0-6d
7-13d 20d 14- 27d ≥28d
21-Specific
ity (%) Specificity (%) Specificity (%) and
95% CI 95% CI and 95% CI and
n 23 27 24 23 40 (combined, n=141) n=38) (HVs, reactivity,
(cross-n=103) EU RO IMMU N , I gG * positive True 4 19 23 20 36 96.5 (91.9-98.8%) 97.4% (86.2-99.9%) 96.1% (90.4-98.9%) Ratio ≥0.80 False negativ e 19 8 1 3 4 Sensitiv ity (%) and 95% CI 17.4 (5.0-38.8 %) 70.4 (49.8 -86.3 %) 95.8 (78.9 -99.9 %) 87.0 (66.4 -97.2 %) 90.0 (76.3 -97.2 %) positive True 4 20 23 21 39 94.3 (89.1-97.5%) NA NA Ratio >0.40 False negativ e 19 7 1 2 1
Acc
ep
ted
Art
icle
Sensitiv ity (%) and 95% CI 17.4 (5.0-38.8 %) 74.1 (53.7 -88.9 %) 95.8 (78.9 -99.9 %) 91.3 (72.0 -98.9 %) 97.5 (86.8 -99.9 %) LI AI SO N , I gG positive True 3 9 20 20 37AU/ mL ≥12.0 False negativ e 20 18 4 3 3 97.9 (93.9-99.6%) 100% (90.8-100%) 97.1% (91.7-99.4%) Sensitiv ity (%) and 95% CI 13.0 (2.8-33.6 %) 33.3 (16.5 -54.0 %) 83.3 (62.6 -95.3 %) 87.0 (66.4 -97.2 %) 92.5 (79.6 -98.4 %)
AU/ mL >3.94 True positive 6 15 23 22 39
False negativ e 17 12 1 1 1 91.5 (85.6-95.5%) NA NA Sensitiv ity (%) and 95% CI 26.1 (10.2 -48.4 %) 55.6 (35.3 -74.5 %) 95.8 (78.9 -99.9 %) 95.7 (78.1 -99.9 %) 97.5 (86.8 -99.9 %)
Ele cs ys , t ot al a nt ib od ie s positive True 4 19 21 20 39
COI ≥1.00 False negativ e 19 8 3 3 1 100 (97.4-100%) 100% (90.8-100%) 100% (96.5-100%) Sensitiv ity (%) and 95% CI 17.4 (5.0-38.8 %) 70.4 (49.8 -86.3 %) 87.5 (67.6 -97.3 %) 87.0 (66.4 -97.2 %) 97.5 (86.8 -99.9 %)
positive True 6 23 22 21 40
COI >0.16 5 False negativ e 17 4 2 2 0 100 (97.4-100%) NA NA
Acc
ep
ted
Art
icle
Sensitiv ity (%) and 95% CI 26.1 (10.2 -48.4 %) 85.2 (66.3 -95.8 %) 91.7 (73.0 -99.0 %) 91.3 (72.0 -98.9 %) 100 (91.2 -100% )Figure 1: ROC curve analysis of three anti-SARS-CoV-2 immunoassays at more