HAL Id: hal-01273187
https://hal-univ-perp.archives-ouvertes.fr/hal-01273187
Submitted on 15 Apr 2021HAL is a multi-disciplinary open access
archive for the deposit and dissemination of sci-entific research documents, whether they are pub-lished or not. The documents may come from teaching and research institutions in France or abroad, or from public or private research centers.
L’archive ouverte pluridisciplinaire HAL, est destinée au dépôt et à la diffusion de documents scientifiques de niveau recherche, publiés ou non, émanant des établissements d’enseignement et de recherche français ou étrangers, des laboratoires publics ou privés.
Aurélien Gangloff, David Doxaran, Anouck Ody, Romaric Verney, Christophe
Menniti, David Le Berre, et al.
To cite this version:
Gaël Many, François Bourrin, Xavier Durrieu de Madron, Ivane Pairaud, Aurélien Gangloff, et al.. Particle assemblage characterization in the Rhone River ROFI. Journal of Marine Systems, Elsevier, 2016, 157, pp.Pages 39-51. �10.1016/j.jmarsys.2015.12.010�. �hal-01273187�
Please note that this is an author-produced PDF of an article accepted for publication following peer review. The definitive publisher-authenticated version is available on the publisher Web site.
May 2016, Volume 157, Pages 39-51
http://dx.doi.org/10.1016/j.jmarsys.2015.12.010 http://archimer.ifremer.fr/doc/00307/41809/
© 2015 Elsevier B.V. All rights reserved
http://archimer.ifremer.fr
Particle assemblage characterization in the Rhone river
ROFI
Many Gaël 1, *, Bourrin François 1, Durrieu De Madron Xavier 1, Pairaud Ivane 2, Gangloff Aurelien 3, Doxaran David 4, Ody Anouck 4, Verney Romaric 3, Menniti Christophe 1, Le Berre David 3,
Jacquet Matthias 3
1
CEFREM, UMR 5110 CNRS, UPVD, 52 Avenue Paul Alduy, 66860 Perpignan, Cedex, France
2
LERPAC, IFREMER, ZP de Brégaillon, 83507, La Seyne-sur-Mer, France
3
PHYSED, IFREMER, ZI, Pointe du Diable, 29280, Plouzané, France
4
LOV, UMR 7093 CNRS, UPMC, 181 Chemin du Lazaret, 06230, Villefranche-sur-mer, France * Corresponding author : Gaël Many, email address : [email protected]
Abstract :
An innovative experiment was carried out in the vicinity of the Rhône River mouth in February 2014. An instrumental package, composed of a CTD, a LISST-100 type B (1.25–250 μm) and a LISST-HOLO (20–2000 μm), was used to characterize the hydrological parameters and suspended particles properties (concentration, size, composition, shape and effective density) in the region of freshwater influence (ROFI) of the Rhône River. Besides, a coastal SLOCUM glider, equipped with a CTD and optical backscattering sensors at several wavelengths, was deployed to detail the spatial description of the hydrological parameters and some particle properties. Large river discharge (annual flood ~ 5000 m3 s− 1) and strong wind conditions favored the dispersal of the river plume on the shelf. Surface suspended particulate matter concentrations decreased rapidly seaward from 20 mg L− 1 next to the river mouth to 1.5 mg L− 1 at the shelf break. A persistent bottom nepheloid layer was observed across the shelf with concentrations decreasing from 8 mg L− 1 at the coast to 1 mg L− 1 at the shelf break. Observations showed that most of suspended particles were mainly flocculated in micro and macro-flocs (30–400 μm) in inner shelf waters. The particle assemblage in the Rhône River plume and in the bottom nepheloid layer became progressively finer seaward and the associated effective density increased from 370 to 1600 kg m− 3. Outside the plume, planktonic organisms increasingly contributed to the total volume concentration. Finally, we demonstrated the ability of gliders, equipped with optical backscattering sensors at several wavelengths, to describe the fine scale distributions of suspended particles, and provide an index of their size distribution.
Please note that this is an author-produced PDF of an article accepted for publication following peer review. The definitive publisher-authenticated version is available on the publisher Web site.
► Description of the suspended particles size distribution in the Rhône River ROFI ► Evidence of fine-grained flocculation in the surface and bottom nepheloid layers ► Evidence of seaward gradient of particle concentration, size, and effective density ► Verification of the ability to measure an index of particle size from a glider
ACCEPTED MANUSCRIPT
1. Introduction
In the source-to-sink approach, regions of freshwater influence (ROFI) are critical transition zones between the continent and the ocean, but still concentrate many knowledge gaps regarding the dynamics of suspended particles. In particular, particles size and effective density, which play a main role in settling velocity and dispersal of suspended sediment over the shelf (Nittrouer et al., 2009; Simpson and Sharples, 2012), are still insufficiently documented. Observations of suspended particulate matter (SPM) near river mouths generally show that sandy sediment and part of finer silty and clayey particles rapidly settle from surface water toward the bottom where they contribute to generate and maintain a bottom nepheloid layer (BNL) or form ephemeral mud deposits (Drake, 1976).
In many ROFIs, river inputs form hypopycnal turbid plume which spread over several kilometers on continental shelves (McCave, 1972). At the freshwater/seawater interface, riverine suspended particles can form flocs of variable abundance and characteristics which are responsible for a large part of the total vertical particle flux from the river plume to the BNL . Previous studies on fine cohesive sediment flocs have identified that, SPM concentration variability in one hand, and turbulence on the other, are the main factors controlling floc aggregation and break up (Curran et al., 2007; Safak et al., 2013; Manning and Schoellhamer, 2013). Flocculation processes have an effect on clayey and silty fine particles (< 10 µm) and form ―microflocs‖ (size < 125 µm) or ―macroflocs‖ (size > 125 µm, principally composed of microflocs) (Gibbs, 1985; Van Leussen, 1994). Microflocs are described as dense and quasi-spherical, resistant to turbulence, whereas macroflocs generally present lower density and can easily be fragmented into microflocs by shear forces (Manning and Dyer, 1999; Manning et al., 2004). Coatings and biological contents, as well as salinity gradient are also described as factors controlling the flocculation of particles (Ayukai and Wolanski, 1997; Dagg et al., 2004). Close to the seabed, flocculation of resuspended fine sediments appears as a key factor in the fate of the BNL (Agrawal and Traykovski, 2001). Hence particle properties (composition, flocs size, shape, effective density and settling velocity) are determining parameters to understand and model particle dynamics, but are still seldom quantified (Winterwerp, 1998; Khelifa and Hill, 2006; Manning et al., 2011; Soulsby et al., 2013).
ACCEPTED MANUSCRIPT
The Gulf of Lions (GoL) in the NW Mediterranean is a wide continental shelf mostly influenced by freshwater and particulate matter inputs from the Rhône River. The Rhône River (catchment area = 97 800 km2) supplies 80% of the sedimentary input to the Gulf of Lions (Courp and Monaco, 1990; Bourrin et al., 2006). The Rhône River discharge is characterized by a strong annual variability with a mean annual discharge of 1700 m3 s-1 and typical annual flood with discharge >5000 m3 s-1 (Maillet et al., 2006). These authors estimated a total suspended solid flux around 7×10⁶ tons per year with a high annual variability from 1.2 to 19.7 ×10⁶ t y-1. Pont (1996) estimated that flood events contributed to 70% of the total particulate flux. During floods, freshwater and sediment inputs form a surface plume that can spread over several kilometers off the mouth (Aloisi et al., 1979; Naudin et al., 1997; Thill et al., 2001). Sediment delivery from the Rhône River can also be transported as intermediate and bottom nepheloid layer as described in Aloisi et al. (1982). Previous studies emphasized the diversity of physical processes (river discharge, oceanic conditions, behavior of the thermocline) in regulating the transport of particles within turbid structures.
The Rhône prodelta is a shallow area of high sedimentation rates (typically ranging from 20 to 50 cm y-1) (Marion et al., 2010; Miralles et al., 2005). It is subjected to wave energy that induces particle resuspension and contributes to maintain a permanent bottom nepheloid layer (BNL), whose thickness, concentration, and composition vary with the Rhône River inputs and episodic storms (Aloisi et al., 1982; Naudin et al., 1992; Dufois et al., 2014). This BNL extends over the whole shelf, where it feeds the mid-shelf muddy belt and is eventually exported off the shelf (Durrieu de Madron and Panouse, 1996).
Previous in situ observations suggested the fast vertical transfer of both fine (silts) and coarse (sand) particles from the Rhône river plume to the seabed (Aloisi et al., 1982; Naudin et al., 1992). To explain the spread and settling of fine particles, previous studies suggested the role of aggregation phenomena by salt flocculation along the dilution gradient of the river plume (Thill et al. 2001), and by the electro-chemical action of the organic matter (Naudin et al., 1997). These latter authors also highlighted the correlation between the increase of particulate concentration and the growth of flocs. They showed the predominant role of wind on the mixing time of the plume, which appears to enhance the settling of suspended matter,
ACCEPTED MANUSCRIPT
particularly, the largest organo-mineral aggregates. Babin et al. (2003) used in situ optical light scattering measurements at different wavelengths to characterize the particle properties of the Rhône ROFI. More recently, Slade and Boss (2015) derived the spectral slope of backscattering measurements, γ, and emphasized the link between the spectral slope and the Junge parameter, j, exponent of the power law approximation of the particle number distribution (PND). These observations highlighted the link existing between optical in situ measurements and spatio-temporal variability of particle assemblage (i.e., the more or less large proportion of flocs).
The current study presents a comprehensive set of hydrological, hydrodynamical, and optical measurements collected with different platforms (mooring, ship and glider) in the Rhône River ROFI. It aims at: 1) characterizing the spatial variability of turbid structures in the ROFI during an annual flood event, 2) assessing the link between the in situ estimate of spectral slope, γ, and the particle size distribution (PSD), 3) determining the particle assemblage properties (size, shape, composition) and 4) determining the cross-shore spatial variability of particle properties in the surface and bottom layers.
3. Material & Methods
3.1 Presentation of the experiment
We used a multi-platform strategy to characterize the Rhône ROFI suspended particles during flood events. We coupled coastal buoy time-series observations of oceanic and meteorological conditions with cross-shelf hydrological observations. High spatial resolution of turbid and hydrological structures was characterized with a coastal glider, and was completed with local but detailed shipboard measurements.
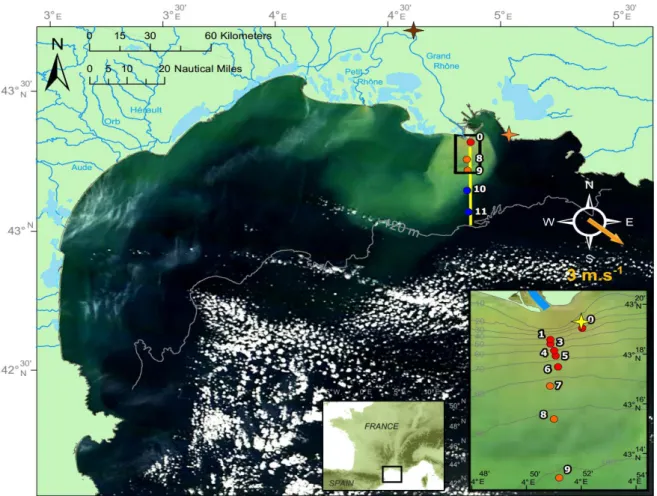
A SLOCUM glider was deployed from January 30, 2014 to February 12, 2014 off the Rhône River mouth. Glider's sections consisted of N-S lines of 40 km long running across the GoL shelf from the MESURHO buoy (20 m depth) to the shelf break (150 m depth) (Fig. 1). Each section was generally performed in 2 days.
ACCEPTED MANUSCRIPT
Figure 1: MODIS Aqua visible image of the February 17, 2014. Rhône plume stations are shown by red (inner-shelf), orange (mid-shelf), and blue (outer-shelf) circles. Beaucaire gauging station, Cap-Couronne wind station, and MESURHO buoy are shown by brown, orange and yellow star, respectively. The shelf edge (120 m depth) is shown by a gray line.
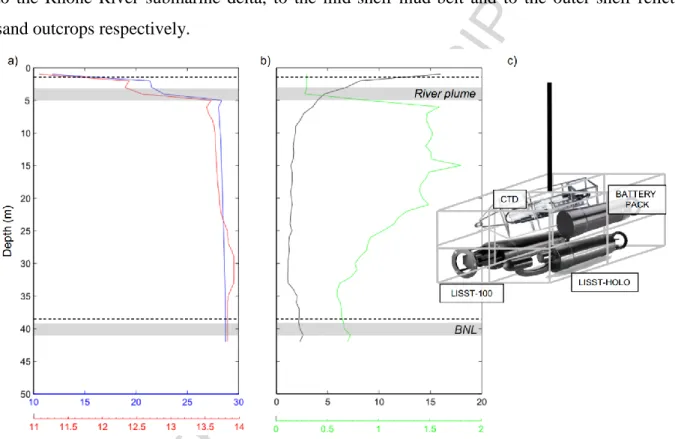
A cruise was carried out on board of the research vessel Antédon II, in front of the Rhône River mouth between the 17 and 21 February 2014. The first day took place immediately after an annual flood of the Rhône River and 11 stations were sampled along a 30 km cross-shelf transect corresponding to the glider section. We used an original instrumental package (Fig. 2c) composed of two in situ particle size analyzers manufactured by Sequoia Scientific Inc (laser scattering sensor and holographic camera), and a CTD package (Fig. 2a-b). Due to the low acquisition frequency of the holographic camera (0.2 Hz), two levels of sampling were selected in order to collect statistically significant measurements to precisely determine the particle properties of the main turbid structures. The first level was at 3-5 m depth within the surface nepheloid layer (SNL) and the second at 1 meter above bottom (mab) in the BNL. Water samples were collected at these two depths from Niskin bottles. The stations were
ACCEPTED MANUSCRIPT
located every 10 m of depth from the near-shore (20 m) up to the shelf break (120 m). We divided the transect into three domains: the inner shelf (0 - 5 km from the river mouth, maximum 80 m water depth), the mid-shelf (5 - 20 km, maximum 100 m water depth) and the outer-shelf (> 20 km, maximum 200 m water depth) (see Fig. 1). These 3 domains correspond to the Rhône River submarine delta, to the mid-shelf mud-belt and to the outer-shelf relict sand outcrops respectively.
Figure 2: Typical CTD cast (st.3 - Inner-shelf) showing profiles of a) temperature (°C - red) and density anomaly (kg m-3 - blue) and b) SPM concentrations (mg L-1 - black) and Chlorophyll-a fluorescence (µg L-1 - green). Water sample depths are indicated by the dashed lines. Depth ranges of in situ measurements of suspended particle optical properties are indicated by the grey bands. c) Illustration of the instrumental package used to characterize the BNL and the SNL particles.
3.2 Nearshore hydrological, hydrodynamical and meteorological observations
Meteorological time-series – Hourly (10 minute burst average) wind speed and direction were
measured at the Météo-France station of Cap-Couronne (43°20.23’N ; 5°01.38’E). Data were provided by the Publithèque database.
Rhône River discharge time-series - Daily Rhône discharge was measured at
Beaucaire-Tarascon gauging station (Compagnie National du Rhône - code V7200015), 50 km upstream of the river mouth. Data were provided by the Banque Hydro database.
ACCEPTED MANUSCRIPT
MESURHO buoy time-series – Currents, waves and echo intensity were monitored using a
600 kHz RDI upward looking ADCP fixed at the bottom of the MESURHO buoy (Pairaud et al., 2015) off the Rhône River mouth (43°19.13’N ; 4°51.98’E, 20 m depth). Depth-averaged hourly-mean currents were estimated from the high frequency current profiles. Wave directions were estimated using wave orbital velocities, pressure and sea surface track (Teledyne RD Instruments, 2007). High-frequency wave measurements were then averaged every 3 h.
ADCP echo intensity is a measure of the signal strength of the echo returning from the ADCP’s transmit pulse. Echo intensity depends on sound absorption, beam spreading, transmitted power and backscatter coefficient. Backscatter measurements were used here as a relative information on suspended sediment concentration.
3.3 Cross-shelf hydrological observations
Ship CTD/optical data and water sampling - Water pressure, temperature and conductivity
were measured by profiling a Seabird 19+ CTD. Practical scale salinity and anomaly density were derived using the EOS-80 algorithms (UNESCO, 1983). Turbidity and Chlorophyll-a fluorescence were simultaneously measured with an OBS 3+ turbidimeter (at 850 nm) and a Chelsea fluorimeter respectively.
Water samples were collected with Niskin bottles triggered by a messenger that is sent down the cable from the surface. A horizontal bottle was used separately to sample the SNL (0.5 - 1 m). Besides, a vertical bottle mounted 1 m above the instrument package was used to sample the BNL (2 mab). SPM concentrations were determined by filtering seawater on GF/F filters (0.7 μm nominal pore size) following the method described in Aminot and Kérouel (2004). Filters were then used to determine particulate organic carbon (POC) content. Firstly, dry samples were decarbonated with repeated additions of H3PO4 (1M) and HCl (2M) until the end of effervescence. Then, POC contents were measured using a VarioMAX CN, Elementar Instrument. Close to the seabed, Nuclepore polycarbonate filters (0.4 m pore size) were preferred against GF/F due to their lower mass that enabled to measure low SPM concentrations with better accuracy. Nevertheless GF/F filters were used in parallel to determine POC contents.
ACCEPTED MANUSCRIPT
Glider CTD/optical data - The autonomous underwater coastal glider (30-200 m) used for the
experiment was a Teledyne Webb Research Slocum (Davis et al., 2002). The glider was carefully ballasted in order to enter and measure both in the low-density river plume and in the denser outer-shelf waters. The glider was equipped of an un-pumped Seabird 41-CP CTD providing temperature, depth and conductivity data. Derived parameters such as salinity and density anomaly were derived following the equation of EOS-80 (UNESCO, 1983). A Wetlabs FLNTU sensor provided chlorophyll a concentrations measurements (expressed in µg L-1), and turbidity (expressed in nephelometric turbidity units - NTU) based on backscattering measurements at 700 nm. A Wetlabs BB2FLS provided light backscattering measurements (expressed in m-1) at 532 and 660 nm. The glider moved in a sawtooth-shaped trajectory between 1 m below the surface and 2 mab at an average horizontal speed of 0.2 m s -1
. When the glider reached the surface (every 6 dives), data are transferred through iridium communication protocol and the glider received new GPS positions to correct its future trajectory. Data were projected along a N-S segment from the Rhône River mouth to the shelf edge. A final 2D linear interpolation was then applied to our data, within a grid of 1 m vertical and 100 m horizontal resolution.
Turbidity sensors calibration – During a subsequent experiment in February 2015, a direct
comparison between the turbidity measured with the shipboard CTD’s OBS 3+ sensor and the glider’s FLNTU sensor used during both experiments, was made by performing a profile where the glider was coupled to a SeaBird 911 CTD equipped with a rosette.
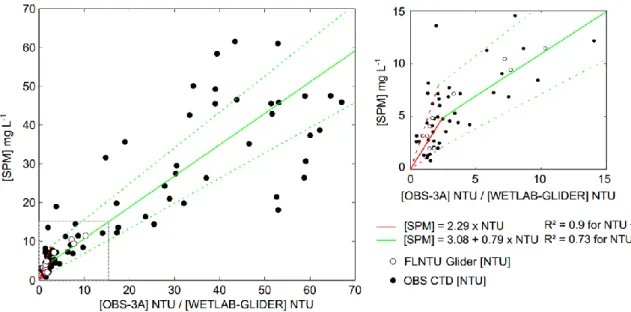
Backscattering measurements from both experiments were then calibrated against SPM concentrations derived from gravimetric measurements. We used a single Pearson's major axis regression (Model II) and found the following relationship between SPM concentrations and turbidity: [SPM] (mg L-1) = 2.29 (±0.18) × Turbidity (NTU) (R²=0.90) for turbidity between 0 and 2.05 NTU, and [SPM] (mg L-1) = 3.08 (±4.03) + 0.79 (±0.11) × Turbidity (NTU) (R²=0.73) for turbidity between 2.05 and 70 NTU ranges (Fig. 3).
ACCEPTED MANUSCRIPT
Figure 3: Turbidity sensors (OBS-3+ on the CTD and FLNTU on the glider) calibration with gravimetric measurements. Dash-lines represent the error bounds of the regressions estimated. The right plot is a zoom of the left plot for low turbidities and SPM concentrations.
3.4 SPM properties
Laser diffraction - A LISST-100 (Type B, 1.25 - 250 µm range, 1 Hz) was used to estimate
the in situ PSD in the SNL and the BNL. A LISST-100X (Type C, 2.5 - 500 µm, 1 Hz) was used onboard to estimate the PSD of primary particles composing the particle assemblage in water samples from the SNL and BNL. Water samples were deflocculated by ultrasonification for 5 minutes. PSD was then estimated from 1 minute average LISST-100X measurements. PSD was derived from the laser diffraction spectrum using the ―randomly shaped‖ Mie's theory (Agrawal and Pottsmith, 2000; Agrawal et al., 2008; Traykovski et al., 1999). The raw spectrum was converted in volume concentration (expressed in µL L-1) using the factory volume calibration constant. Extreme size classes (1.25 - 2.5 and 250 - 500 µm) showed typical 'rising tails' explained by the presence of smaller particles (for the first class) and bigger particles (for the last class) outside the measurement range (Mikkelsen et al., 2005). Except for the LISST-100X data processing (primary particle characterization), we excluded the extreme size classes of the PSD before calculating the derived parameters (total volume concentration (VCtot), effective density, see section 3.5).
ACCEPTED MANUSCRIPT
Holography - A digital holographic camera (LISST-HOLO, 0.2 Hz) was used to study the
volume, number and shape of large particles, complex aggregates and biological organisms within the range 20 - 2000 µm (Graham and Smith, 2010). Reconstructed images were combined to obtain a representative estimation of particle composition in the SNL and the BNL. PSD was estimated using an image analysis processing (based on the estimate of the spherical equivalent diameter) and the size spectrum was expressed in µL L-1. The LISST-HOLO also measured several particle shape parameters. The aspect ratio (AR) (Fig. 4c, Eq. 1), which underlines their spherical aspect was of particular interest. It is estimated by the equation:
AR = Axmin/Axmaj (Eq. 1)
where Axmin and Axmaj represents respectively the minor and major axes of the particle. An aspect ratio of 1 indicates a spherical shape, whereas an aspect ratio of 0 indicates a straight shape (see Clavano et al., 2007). All particles measured by the LISST-HOLO during the experiment were used to characterize the particles aspect ratios as a function of their size, regardless of their location along the transect.
LISST-100 and HOLO PSD combination – In order to compare and merge the PSD derived
from the LISST-100 and LISST-HOLO, only the measurements made near the surface and the bottom were considered (see 3.1). Data at these two measurement levels were collected for 60 - 90 seconds, which allowed to gather between 60 and 70 scans for the LISST-100, and 20 and 30 images for the LISST-HOLO. These data were averaged for each level and each station. A specific 1-hour long sampling procedure enabled the collection of 700 LISST-HOLO images and 3500 LISST-100 scans, and the assessment of the measurement uncertainty by multiple random permutations of an increasing number of samples. The relative uncertainty associated to the measurements of the total volume concentration of the 20 - 30 LIST-HOLO images was then estimated to 15 %, and that associated to the 60 - 70 LISST-100 scans was estimated to 4%. The LISST-100 and LISST-HOLO PSD were finally merged within a 1.25 - 1000 µm size range to fit within the same 50 logarithmically spaced classes and the maximum volume PSD of each median size class was selected to constitute the final PSD (Fig. 4a).
ACCEPTED MANUSCRIPT
Figure 4: Combination of 100 type B (red line between 1.25 and 250 µm) and LISST-HOLO (blue line between 20 to 2000 µm) particle size/number distribution in the river plume (St. 3). a) The volumetric representation of the combined distribution from 1.25 to 2000 µm is characterized by black circles and is used to calculate total particle volumetric concentration and associated effective density. b) Particle number distribution of the combined distribution used to estimate the Junge parameter j is characterized by black circles. c) Examples of large aggregates (> 300 µm) and associated aspect ratios (AR) calculated as the ratio between the minor axis length (Axmin, in orange) and the major axis length (Axmaj, in green).
3.5 Derived SPM properties
Effective density estimation - We estimated the effective density, Δρ (kg m-3), of the particle assemblage using simultaneous measurements of SPM concentrations (mg L-1) from the OBS 3+, and total volume concentration, VCtot (µL L-1) from the LISSTs - following equation 2.
Δρ = SPMOBS / VCtot (Eq. 2)
Power law approximation - The volume normalized PSD was converted to the number of
particle per size class by dividing by an elementary spherical volume (Fig. 4b). For mineral particle assemblage, it is assumed that the resultant equation between the number of particles (n, expressed in L-1 µm-1) and the particles size (D) follow a power law (Eq. 3) (Jonasz, 1983; Stramski and Kiefer, 1991; Buonassissi and Dierssen, 2010).
ACCEPTED MANUSCRIPT
Due to the rare presence of large particles, particle number less than 1 per litter (i.e. flocs and planktonic organisms > 500 µm), were excluded of the power law calculation. Due to the sensitivity to the finest particles of the LISST-100 (i.e. 1.25 - 6 µm) (Agrawal and Traykovski, 2001; Agrawal et al., 2008), the 'tail' in small size classes (i.e. < 6 µm) were also filtered (Fig. 4b). This tail is generally due to an uncertain refractive index for the finest particles and can be interpreted as a contamination of our power law approximation (Graham et al., 2012; Xi et al., 2014). The slope, j, extracted from the power law approximation, or Junge parameter (dimensionless), is used to estimate the relative number of small to large particle for the 6 - 500 µm size range (Junge, 1963). High j (j ~ 4) implies a higher proportion of small particles, and, reciprocally, low j (j ~ 2.4) implies a higher proportion of large particles (Bader, 1970).
Spectral slope estimation – Measurements from the FLNTU (λ = 700 nm) and BB2FLS (λ =
532 and 660 nm) optical sensors of the glider were used to estimate the particulate backscattering coefficients [bbp(λ)]. The BB2FLS sensors provided the volume scattering function [β(θ,λ)] in m-1
sr-1, at θ = 124°. The FLNTU optical backscattering sensor (θ = 140° in the backward direction (Sullivan et al., 2010)) was factory calibrated in NTU out of which the volume scattering function was computed, using the Beta Scale Factor (i.e. the NTU Scale Factor multiplied by a coefficient of 0.0025) provided by the manufacturer. Values of [β(θ,λ)] were not corrected by absorption effects, which were negligible (a few % of the total signal detected). For each wavelength, we then estimated [βp(θ,λ)], the volume scattering of particles, by subtracting the molecular scattering of pure water as described in Morel (1974). The particulate backscattering coefficient [bbp(λ)] with units of m-1, was then determined through estimation from the single measurement of [βp(θ,λ)] using an X factor : [bbp(λ)] = 2π . X . [βp(θ,λ)], where X is an adjustment factor according to water type (X=1.077 for the BB2FLS and X=1.132 for the FLNTU).
From Morel (1973) (see also Babin et al., 2003), the light scattered by marine particles depends of the particle size distribution, concentration, refractive index and the detection wavelength. This variation is considered as a power law approximation following: bbp(λ)=bbp(λ0).( λ/ λ0)- γ where λ0 is the reference wavelength and γ the spectral slope (dimensionless) in the case of non-absorbing spherical particles with a Junge-like size distribution. Morel (1973) reported a relationship between the spectral slope and the Junge
ACCEPTED MANUSCRIPT
particle > 10 µm and non-spherical particles: γ = j - 3 - 0.5e-6j.
4. Results
4.1 Meteorological and oceanic conditions at the MESURHO station
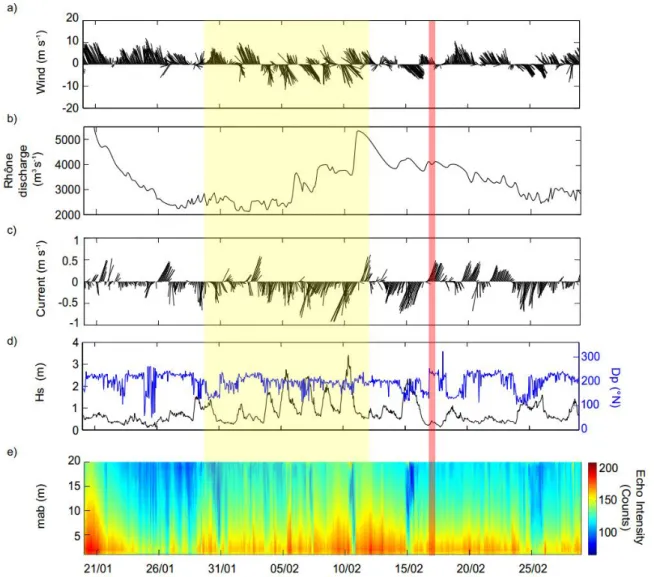
During the glider deployment, two south-east (SE) wind (―Marin‖) events on February 5 and 10, 2014 induced precipitations over the Rhône water catchment (Fig. 5a). The Rhône River discharge increased shortly after (3500 m3 s-1 on February 5, and 5500 m3 s-1 on February 11, 2014, Fig. 5b). This flood affected directly the hydrology of the Rhône River ROFI. During that period, depth-averaged currents at the MESURHO buoy varied from 0.1 to 1 m s-1 and were generally oriented to the south / south-west (Fig. 5c). During these events, the currents were stronger and homogenous throughout the water column (from 2 to 20 mab), and the significant wave height ranged between 2 and 3.5 m (Fig. 5d). The BNL followed the increasing/decreasing pattern of the Rhône River discharge, interrupted by short incursions of clearer water. The BNL reached 15 m thick with echo intensity of 180 counts at the peak of the flood.
During the day of measurements at sea (February 17, 2014), a weak north-westerly wind of 3 m s-1 was measured at the Cap-Couronne station (Fig. 5a), which allowed to get a cloud-free MODIS satellite picture (see Fig. 1). The Rhône discharge was still high, about 4000 m3 s-1 (Fig. 5b). During the previous two days, strong south-southwesterly wind-driven currents swept the plume away toward the shelf edge (Fig. 5c). Sea conditions were calm with small waves (<1 m height) (Fig. 5d). MESURHO bottom SPM concentrations in front of the Rhône River mouth showed a BNL of 5 m thick with echo intensity of 150 – 160 counts (Fig. 5e).
ACCEPTED MANUSCRIPT
Figure 5: Time-series from January 20 to March 1, 2014 of: (a) hourly-mean wind speed and direction, (b) Rhône River daily-mean discharge, (c) hourly-mean depth-averaged currents speed and direction, (d) significant wave height and direction, and (e) acoustic echo intensity. The yellow box shows the duration of the glider deployment and the red bar, the cruise measurements.
4.2 Cross-shelf hydrological structures
Glider cross-shelf sections - Glider's cross-shelf section (Fig. 6a) represented the median of
the 7 sections carried out during the 30 January – 12 February 2014 period. The 7 sections highlighted the persistence of surface and bottom nepheloid layers in the Rhône ROFI (data not shown). It is well characterized by the median situation that smoothed the small-scale variability of the measured parameters. The Rhône River plume and the BNL were clearly identified, with their thickness and SPM concentration decreasing seaward. The glider
ACCEPTED MANUSCRIPT
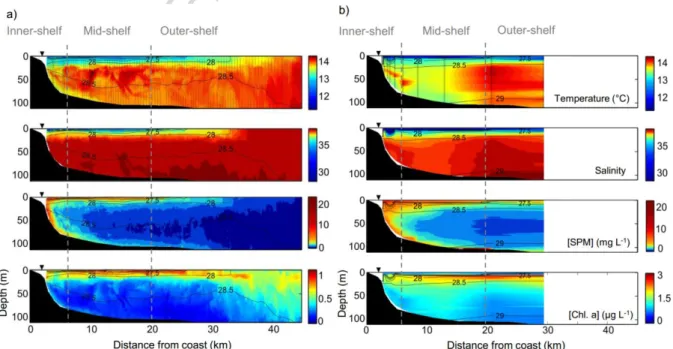
dilution of the plume with ambient water was clearly visible with an increase of the average temperature and salinity from 13 to 14.5 °C and from 32 to 38, respectively. Meanwhile SPM concentration in the plume decreased from 20 mg L-1 to 1.5 mg L-1. Chlorophyll-a concentrations were higher (1 to 3 µg L-1) and limited to the surface layer in the plume, but showed a large dilution throughout the water column outside the plume. SPM concentrations in the BNL varied from ~8 mg L-1 close to the river mouth to less than 1 mg L-1 at its outer edge.
Ship CTD/optical observations - The hydrographical structures observed from shipborne
measurements on the 17 February 2014 (Fig 6b) showed rather similar characteristics to those obtained from glider observations. CTD observations showed the presence of the Rhône River plume with colder, fresher, and lighter water. The pycnocline, defined by the 28 kg m-3 isopycnal, delimited the vertical extension of the plume those thickness decreased seaward (from 20 to 5 m). SPM concentrations in the plume progressively decreased seaward from 15 to 5 mg L-1. Chlorophyll-a concentrations were higher around the pycnocline and maximum (~ 3 µg L-1) on the mid- and outer shelf. A BNL of 5 to 20 m thick was present along the entire section with SPM concentrations decreasing seaward from 5 mg L-1 on the inner shelf to 2 mg L-1 at the end of the section (30 km off the coast).
Figure 6: Cross-shelf hydrological section based on (a) glider observations averaged during the 12-day long deployment (Jan. 30 – Feb 12, 2014) and (b) ship observations on Feb 17, 2014. From top to bottom: temperature (°C), salinity, suspended sediment concentration (mg
ACCEPTED MANUSCRIPT
L-1), Chlorophyll-a fluorescence (µg L-1). Potential density anomaly contour lines (kg m-3) are superimposed. The location of the CTD casts or the glider trajectory are shown on the top plots. Inner, mid and outer-shelf areas are delimited by thick grey dashed lines. The black triangle indicates the position of the coastal MESURHO buoy.
4.3 Cross-shelf SPM properties
Particle concentration, size and composition measured by optical instruments on the 17 February 2014 are presented in Figures 7 and 8.
Primary particles size distribution - LISST-100X was used on board in laboratory mode to
determine the primary particle composition of the particle assemblage sampled with Niskin bottles (see green curves on top panel of Figures 7 and 8). In the SNL, the inner (station 3), mid (station 8) and outer-shelf (station 11) samples (Fig. 7) showed a similar primary PSD with a mode centered around 10-20 µm (typical of fine silts), and a significant contribution of the finest particles (<2.5 µm, typical of fine clays). Conversely to the fraction of fine silts that decreased seaward, the fraction of the finest primary particles increased. Maximum primary particle size decreased from 80 µm close on the inner-shelf to 35 µm on the outer-shelf (Fig. 7a – left to right panel).
Close to the seabed (Fig. 8), the primary particle PSD at the different station also showed a large mode centered around 10-20 µm, but with a larger spread towards the coarser sizes than for the SNL, and a lesser contribution of the finest particles (<2.5 µm). Maximum primary particle size increased from 110 µm close on the inner-shelf to 70 µm on the outer-shelf.
In situ particle size and number distributions in the plume - In situ PSD showed a good
complementarity between the LISST-100 and LISST-HOLO measurements (see red and blue dots on top panel of Figure 7 and 8). In situ PSD, which differed significantly from primary particles PSD, showed modes of larger sizes, corresponding to flocs.
On the inner-shelf (3 - 5 km, see Table 1 for hydrological characteristics), VCtot was about 23.4 µL L-1 and in situ particle size ranged from 3 to 400 µm. PSD was centered on micro-flocs of 30-100 µm (>5 % VCtot for both instruments). LISST-100 showed a low volume (<2 %) of fine-sedimentary particles (5 - 10 µm). Holography permitted to complete the particle spectrum with the detection of larger flocs of 200 - 400 µm (~2 % per class size). An effective density of the entire particle assemblage was estimated to 372 ± 80 kg m-3. The PND clearly
ACCEPTED MANUSCRIPT
particles per liter), which contrast with their volumetric significance. A Junge parameter j (PND slope) for 6 to 300 µm size range was estimated to 3.6 (R² = 0.978).
On the mid-shelf (Fig. 7 – middle panel) (5 - 20 km), VCtot decreased at 5.9 µL L-1, but particle assemblage was similar to the inner-shelf station. In situ PSD showed the presence of a small proportion of fines (<2 % for size class of 3 - 10 µm) and a mode centered on 30 - 70 µm (>5 % for each size class). Largest particles appeared between 120 and 200 µm (6 and 7 % of VCtot). We estimated a j of 3.53 (R² = 0.989) and an effective density of 859 ± 223 kg m -3
.
On the outer-shelf (Fig. 7 – right panel) (20 - 30 km), we measured a VCtot of 4.2 µL L-1. Although the PSD from both instruments were more fluctuating, we observed 3 modes centered around 10 µm (3 - 30 µm), 100 µm (30 - 200 µm) and 400 µm.
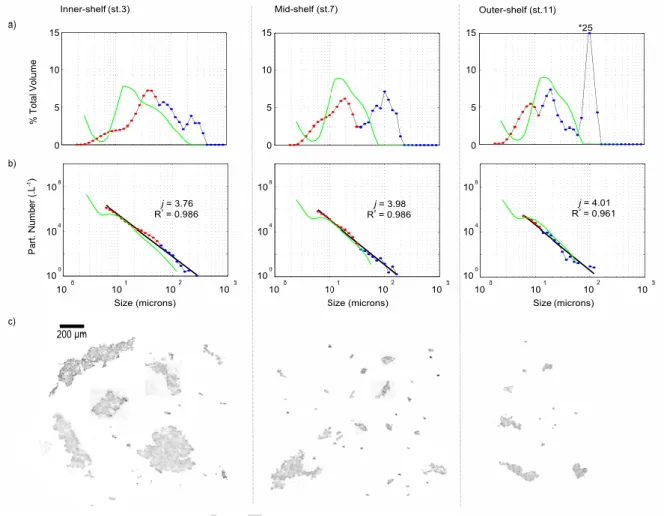
A representative sample of LISST-HOLO images in the surface layer shown in Figure 7c, enables to characterize the composition of the particle assemblage. Micro- (20 - 250 µm) and macro-flocs (>250 µm) present on the inner and mid-part of the plume are easily identified. A large contribution of planktonic organisms (diatoms, pteropods, copepods) appeared on the outer shelf, outside the plume (Fig.7c – right panel). These planktonic organisms contributed to a significant fraction of VCtot (40%, peak at 400 µm Fig.7a – right panel). Due to their non-mineral composition we did not include them in the calculation of the Junge parameter and the particulate assemblage effective density. Hence, we estimated a j of 3.96 (R² = 0.991) and an effective density of 1547 ± 510 kg m-3 (VCtot = 2.5 µL L-1).
Hydrological parameters and the derived particulate parameters for the different stations are summarized in Table 1.
ACCEPTED MANUSCRIPT
Figure 7: Particle properties in the surface layer (around 5 m depth) at station 3 (inner shelf), station 8 (mid-shelf) and station 11 (outer shelf). See Fig. 1 for stations position. (a) Particle size distribution. (b) Particle number distribution with power law regression (black line) and Junge parameter estimation. In situ measurements are shown by the combined particle size (or number) distribution from the LISST-100 (red) and LISST-HOLO (blue) measurements, whereas on-board deflocculated primary particles distribution are shown in green. (c) Examples of particle assemblage from the LISST-HOLO images.
Inner-Shelf (station 3) Mid-Shelf (station 8) Outer-Shelf (station 11) Depth (m) 5 5 5 Water Temperature (°C) 12.84 12.91 13.14 Water Salinity 30.06 33.41 35.94 Water Potential Density Anomaly (kg m-3) 22.62 25.20 27.11 Chlorophyll a (µg L-1) 1.71 2.23 2.53 POC (%) 2.3 2.9 5.4 SSC (mg L-1) 8.70 4.37 3.90 Volume Total (µL L-1) 23.40 5.10 2.52 Effective density (kg m-3) 372±86 859±223 1547±510
ACCEPTED MANUSCRIPT
and 8b) (see Table 2 for hydrological characteristics), in situ PSD showed a main mode centered on particle size of 30 - 100 µm (>5 % of VCtot for each size classes) and a secondary mode between 250 and 450 µm (~10 % of VCtot). We measured a VCtot of 10.47 µL L-1. From the PND, j was estimated to 3.76 (R² = 0.986) and the global effective density to 537 ± 80 kg m-3.
On the mid-shelf (Fig. 8 – middle panel), VCtot decreased to 2.38 µL L-1. The particle assemblage was globally finer than on the inner-shelf and 2 modes were observed centered between 10 - 30 µm and 60 - 150 µm (>5 %) respectively. We determined a Junge parameter of 3.98 (R² = 0.986) and an effective density of 1626 ± 243 kg m-3.
On the outer-shelf (Fig. 8 – right panel), measurements were more fluctuating and the VCtot was estimated to 2.4 µL L-1. In situ PSD showed a mode for fine particles of 7 - 10 µm, and two others modes for particles of 20 and 100 µm (7 and 25 % of VCtot, respectively). We estimated a value of j of 4.01 (R² = 0.961) and an effective density of 1180 ± 400 kg m-3. As for the plume, particle images emphasized the mineral composition of aggregates and clearly showed the complex and diverse aspects of micro- and macro-flocs (Fig. 8c). Hydrological parameters and the derived particulate parameters for the different stations are summarized in table 2.
ACCEPTED MANUSCRIPT
Figure 8: Particle properties in the bottom layer (around 1 - 2 mab) at station 3 (inner shelf), station 7 (mid-shelf) and station 11 (outer shelf). See Fig. 1 for stations position. (a) Particle size distribution. (b) Particle number distribution with power law regression (black line) and Junge parameter estimation. In situ measurements are shown by the combined particle size (or number) distribution from the LISST-100 (red) and LISST-HOLO (blue) measurements, whereas on-board deflocculated primary particles distribution are shown in green. (c) Examples of particle assemblage from the LISST-HOLO images.
Inner-Shelf (station 3) Mid-Shelf (station 7) Outer-Shelf (station 11) Depth (m) 50 80 110 Water Temperature (°C) 13.76 13.68 13.96 Water Salinity 37.93 37.96 38.2 Water Potential Density Anomaly (kg m-3) 28.70 28.95 29.2 Chlorophyll a (µg L-1) 1.10 0.98 0.74 POC (%) 2.5 1.9 1.8 SSC (mg L-1) 5.63 3.9 2.8 Volume Total (µL L-1) 10.47 2.38 2.4 Effective density (kg m-3) 538±80 1639±243 1167±401
ACCEPTED MANUSCRIPT
The change of the aspect ratio parameter with size for all particles observed on the 17 February 2014 is shown on Figure 9. We observed aspect ratios of 0.61 to 0.49 for particles of 20 to 150 µm with a standard deviation of ~0.15. Large flocs (150 - 500 µm) were characterized by higher aspect ratios of 0.50 to 0.77 (i.e. a more spherical aspect) with a standard deviation of ~0.1.
Figure 9: Particles averaged aspect ratio as a function of particles size (black line). Standard deviations per size class are shown by gray bars. Number of particle analyzed per size class is shown by a blue line.
4.5 Light backscattering spectral slope and Junge parameter estimations
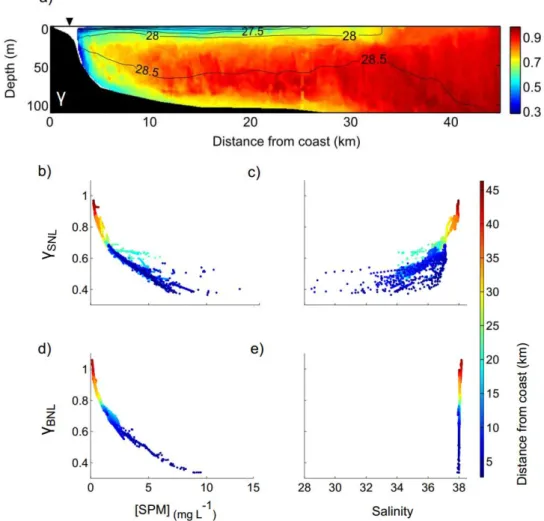
We estimated the spectral slope, γ, from glider backscattering measurements at 532, 660, and 700 nm (Fig. 10a). Both in the SNL and the BNL, γ showed a progressive increase seawards (i.e. a higher proportion of smaller particles along the transect). Minimum γ of 0.3 was observed on the inner-shelf, and γ increased seawards with values of 0.7 at 30 km offshore. The values of γ within the SNL clearly increased with increasing salinity and decreasing SPM concentrations (Fig. 10b, 10c). Besides, γ values within the BNL were not linked to salinity (Fig. 10e), yet they clearly increased with decreasing SPM concentrations (Fig. 10d).
ACCEPTED MANUSCRIPT
Figure 10: a) Section of the mean spectral slope measured during the glider deployment (January 30 – February 12, 2014). The black triangle indicates the position of the MESURHO buoy, density contour lines are superimposed. Variation of the spectral slope of the SNL with SPM concentration (b) and salinity (c). Variation of the spectral slope of the BNL with SPM concentration (d) and salinity (e).
Based on the relation of Boss et al. (2001), we estimated the spectral slope, γLISST, from the Junge parameter, j, derived from the power law approximation of the in situ PND (Fig. 7 and 8). The values of
γ
glider andγ
LISST for similar locations (inner-, mid- and outer-shelf) and turbidities (SPMGlider = SPMOBS ± 0.1 mg L-1) along the transect are shown on Figure 11 and indicated that both estimates are close though estimates were not made at the same time (30 January - 12 February 2014 for the glider measurements, 17 February 2014 for the LISST measurements).ACCEPTED MANUSCRIPT
Figure 11: Scatterplot of spectral slopes derived from the glider backscattering measurements at 3 wavelengths (γGlider), and the Boss et al (2001) relationship based on the Junge parameter estimated from the LISST particle number distribution (γLISST). River plume samples are in grey dots and BNL samples are in white squares. The grey line represents the 1:1 relationship.
5. Discussion
5.1 Spatial variability of nepheloid layers in the Rhône River ROFI
We sampled the Rhône River ROFI after an annual flood in February 2014 (Maillet et al., 2006) while a Northern wind was blowing. CTD measurements emphasized the development of a coastal hypopycnal plume and optical measurements highlighted the presence of large SNL and BNL spreading out across most of the shelf and weakening seaward (Figs. 1 and 6). Next to the shelf edge, the plume was deflected over the continental shelf by along-slope cyclonic circulation. These turbid structures are consistent with those already observed by previous studies next to the Rhône river mouth (Aloisi et al., 1982; Naudin et al., 1992) and across the shelf (Durrieu de Madron and Panouse, 1996).
On the inner shelf, the whole water column water down to depths of 80 m showed the highest SPM concentration, and the SNL and BNL merged for depths less than 20 m (Fig 6). Based on bottom ADCP measurements next to the Rhône River mouth (Fig 4), the BNL thickness and SPM concentration increased with river discharge, and also with the wave- and current-induced activity. This suggests that the BNL is fed both by river plume particles that settle rapidly through the water column, and sedimentary particles probably resuspended on the shallow part of the prodelta.
ACCEPTED MANUSCRIPT
On the mid- and outer-shelf, the SNL and BNL were clearly separated (Fig. 6). The Rhône River SNL, confined by a strong density gradient, presented a strong seaward decrease of SPM concentrations (from 20 to 1 mg L-1). The linear decrease of SPM concentration with increasing salinity (data not shown) indicated that the dilution of the plume was the main factor of the SPM concentration decline.
5.2 On the use of an ad-hoc strategy to study the Rhône River ROFI
Several previous studies emphasized the necessity to combine various measurement methods to characterize the whole size distribution of marine particles and thus determine the link between the scattering detection and the composition/shape of marine particles (Cartwright et al., 2011; Davies et al., 2011; Reynolds et al., 2010; Smith and Friedrichs, 2011). During the TUCPA experiment, the combination of LISST-100/LISST-HOLO instruments was determinant to follow the spatial variability of the particle assemblage (Fig. 7 - 8). Holographic measurements highlighted the high part of dense and inorganic micro- and macro-flocs in the particle assemblage (Fig. 7c and 8c) (Wolanski, 2007).
The determination of the spectral slope of the particulate backscattering coefficient (532, 660, 700 nm) using the glider was in line with past studies of Babin et al. (2003), Loisel et al. (2006), Niewiadomska et al. (2008), Slade and Boss (2015) and Bourrin et al. (2015), where authors showed a range of
γ
from 0.3 to 1.2, typical values found in coastal seas influenced by different particle assemblages. The present study is one of the first study describing and comparing the spatial variability of particle properties based on gliders measurements and LISSTs measurements (PND slope). The comparison ofγ
glider andγ
LISST, following Boss et al., (2001), indicated a good agreement between both variables within the BNL and the SNL. Thus,γ
glider seemed to be an adequate proxy of the proportion of fine particles vs large flocs but the comparison with in situ LISSTs measurements still needs more investigations (Fig. 11).5.3 Particle assemblage properties
Flocculation - LISST measurements of both disaggregated and in situ suspended particles
ACCEPTED MANUSCRIPT
< 1.25 µm probably illite and chlorite clays (Garnier et al., 1991), and the other fraction ranged from 10 to 20 µm composed of fine silts particles. This terrestrial fine sediment fraction has a mean effective density assumed to be ~1650 kg m-3(Boss et al., 2009).
Ayukai and Wolanski (1997) and Naudin et al. (1997) showed the possible role of organic contents as a factor enhancing the flocculation. The spectral slope, γ, estimated from glider backscattering measurements and the Junge parameter, j, were neither correlated with the POC contents (< 2 %) nor to the Chlorophyll a concentrations (1 - 3 µg L-1). While weak, this organic fraction could nevertheless have played a role in the maintenance of flocculated particles in the form of transparent exopolymer particles (Wolanski, 2007). The increase of macro-floc proportion in the SNL (i.e. a decrease of γ and j) was nevertheless correlated with an increase of SPM concentration and a decrease of salinity (Fig 10b-10c). These observations are in line with studies of Naudin et al. (1997) and Thill et al. (2001) which emphasized the role of SPM and salinity gradient in the flocculation occurring within the Rhône River plume. Close to the seabed, γ solely varied with SPM concentrations (Fig. 10d). This observation is consistent with results of Slade and Boss (2015) and underlined the role of SPM concentration in the control of the flocculation within the BNL.
Flocs properties - In our study, flocs size was mainly centered around 30 - 200 µm. Similar
observations have been done on the Gulf of Lions shelf both in the SNL by Curran et al. (2007) and Bourrin et al. (2008) in the Têt River plume, and in the BNL by Durrieu de Madron et al. (2005) in a trawl-induced turbid plume. We observed maximum macro-floc sizes of 600 µm, consistent with observations carried out in other ROFI. Eisma et al (1991) found flocs of 600 - 800 µm in the Ems, Rhine, and Gironde estuaries. Kineke and Sternberg (1989) found flocs of 450 µm in the San Pablo bay. Manning and Schoellhamer (2013) found flocs of 600 µm in the San Francisco bay. All these studies highlighted the general low abundance of macro-flocs, their low densities and their importance in the total volume concentration.
We did not find any significant change of the flocs shape with their location on the shelf. The aspect ratio parameter shows the large diversity of flocs shape (Fig. 9). The aspect ratios of fine-grained (< 150 µm) presented a mean value of 0.55, underlying their non-spherical aspect. The largest and rare flocs (> 300 µm) presented higher aspect ratios (0.65-0.75) evidencing a more spherical shape. These observations highlighted the importance to
ACCEPTED MANUSCRIPT
characterize the shape of the flocs (Clavano et al., 2007), in order to properly estimate their settling velocity using models derived by Winterwerp (1998), Khelifa and Hill (2006), or Boss et al. (2009). All these models used a particle shape-related factor, and in the absence of measurements used the spherical approximation when applying them. This also implies the need to use a ―randomly shaped‖ algorithm process to invert particle size from in-situ measurements of light scattering (Agrawal et al. 2008).
5.4 Spatial variability of particle assemblage
On the inner-shelf, particulate assemblage was rather similar in the SNL and the BNL (5/65/30 % for primary particles/microflocs/macroflocs), and the largest macro-flocs (400 - 600 µm) were concentrated in the proximity of the River mouth. Particulate assemblage densities were the lowest with values of ~370 ± 80 and ~530 ± 100 kg m-3 for the SNL and the BNL respectively. These estimations were comparable to the effective densities estimated by Soulsby et al. (2013) and highlighted that the particle assemblage was dominated by micro- and macro-flocs. Within the SNL, the settling velocities of micro- and macro-flocs were estimated to 2 mm s-1 (~7 m h-1) and 17 mm s-1 (~60 m h-1) following Stokes law. These estimations were in line with measurements of Manning and Schoellhamer (2013) in the San Francisco Bay and showed that due to their larger size macro-flocs settled more rapidly than micro-flocs and probably left the river plume and settled to the BNL. This rapid settling of flocs was shown by other studies on various rivers (Fly River: Ayukai and Wolanski, 1997 and Dagg et al., 2004; Po River: Milligan et al., 2007; Eel River: Hill et al., 2000; Amazon River: Gibbs and Konwar, 1986; Burdekin River: Bainbridge et al., 2012). However, during the present study, wave- and current-induced resuspension also likely contributed to the high particle volume concentration observed close to the seabed (~10 µL L-1) and the formation of large flocs in the BNL.
Mid-shelf observations of the SNL (5 - 20 km off the mouth) showed that the particle assemblage (10/30/60 %) was rather similar to inner-shelf particulate assemblage, with maximum floc size of 300 µm. Observations highlighted the settling of biggest flocs (>300µm) which increased the particulate assemblage effective density (850 kg m-3). Yet, the high part of macro-flocs (125 - 300 µm) could be explained by a flocculation still active in the River plume due to the absence of turbulence. Particle assemblage on the outer-shelf was the finest (10/85/5 %, planktonic organisms excluded) and presented maximum density of
ACCEPTED MANUSCRIPT
of primary particles and micro-flocs (i.e. the settling of large flocs leaving the small one behind). A similar trend occurred in the BNL for mid and outer shelf stations. The progressive sedimentation of macro-flocs on the inner- shelf, enhanced the proportion of micro-flocs and fine-grained in the rest of the BNL (30/70/0 %). The resultant effective density increased, and reached maximum values of 1600±400 kg.m-3 above the mid-shelf mud-belt.
The increase of the floc proportion and the decrease of the associated effective density of the particle assemblage have been also observed in the Gulf of Lions by Curran et al. (2007), and in others ROFI such as in the Glacier Bay (Hill et al., 1998), the Po (Fox et al., 2004) and Pearl estuaries (Xia et al., 2004).
6. Conclusion
This experiment provided a unique view of the impact of a Rhône River flood on the distribution and properties of suspended particles. The combination of a coastal buoy monitoring, glider transects, and ship observations enabled to describe in details the temporal variability of the forcings and SPM near the river mouth, and the spatial variability of the turbid structures across the whole shelf.
Our results emphasized the high proportion of flocs (30 - 400 µm) of fine-grained (~ 10 µm) in the Rhône River ROFI and their general non-spherical shape. We highlighted the role of the SPM concentrations and the salinity in the control of flocculation. Close to the river mouth, a link between the river plume and the BNL, induced by the Rhône River discharge and episodic sediment resuspension was shown. Both turbid layers presented similar particle assemblage with minimal effective density of 370 kg m-3. At mid-shelf, both SNL and BNL showed a decrease of the proportion of macro-flocs by settling and dilution, and an increase of the effective density due to the higher proportion of finest particles. It is noteworthy that the maximum effective density in the BNL, with maximum values of 1600 kg m-3, is taking place above the mid-shelf mud-belt. On the outer-shelf, the finest particles were observed within the SNL, and holographic measurements helped us to determine the part of biological organisms in the particulate assemblage.
Finally we demonstrated the good correlation between the spectral slope of glider light backscattering measurements at different wavelengths and the power law approximation of
ACCEPTED MANUSCRIPT
LISSTs particle number distribution. This result shows the possibility to get some useful information on the particle size distribution from autonomous underwater glider when shipboard measurements are not possible.
ACCEPTED MANUSCRIPT
The corresponding author is funded through a PhD grant of the French ministry. This work was funded by the TUCPA project under the CNRS EC2CO DRILL Programme, the MATUGLI project under the ANR ASTRID DGA Programme, the AMORAD project under the ANR Programme (projet ANR-11-RSNR-0002) , the MISTRALS/MERMEX-Rivers action (Marine Ecosystems Response in the Mediterranean EXperiment), and the international LOICZ and PERSEUS (EC grant agreement 287600) projects. The MESURHO station deployment is part of the MESURHO Programme involving IFREMER, IRSN, CNRS, CETMEF, and Phares et Balises. We thank the SOERE MOOSE for supporting and providing long-term observation data in the Gulf of Lions. We also thank the captain and crews of the
R/V Antédon and R/V Tethys II for their help during experiment in rough sea. We thank Aris
Karageorgis for his helpful comments on the manuscript. This work benefited from helpful comments provided by the editor and anonymous reviewers.
ACCEPTED MANUSCRIPT
Bibliography
Agrawal, Y. C., et H. C. Pottsmith. 2000. « Instruments for particle size and settling velocity observations in sediment transport. » Marine Geology 168 (1–4): 89‑114. doi:10.1016/S0025-3227(00)00044-X.
Agrawal, Y. C., et P. Traykovski. 2001. « Particles in the bottom boundary layer: Concentration and size dynamics through events. » Journal of Geophysical Research 106: 9533‑ 42. doi:10.1029/2000JC900160.
Agrawal, Y. C., A. Whitmire, O. A. Mikkelsen, et H. C. Pottsmith. 2008. « Light scattering by random shaped particles and consequences on measuring suspended sediments by laser diffraction. » Journal of Geophysical Research 113 (C4). doi:10.1029/2007JC004403.
Aloisi, J. C., C. Millot, A. Monaco, et H. Pauc. 1979. « Dynamique des suspensions et mécanismes sédimentogénétiques sur le plateau continental du Golfe du Lion. » CR Acad. Sc 289 (13): 879‑82.
Aloisi, J. C., J. P. Cambon, J. Carbonne, G. Cauwet, C. Millot, A. Monaco, et H. Pauc. 1982. « Origine et rôle du néphéloïde profond dans le transfert des particules au milieu marin. Application au Golfe du Lion. » Oceanologica Acta 5 (4): 481‑ 91.
Aminot, A., et R. Kérouel. 2004. « Hydrologie des écosystèmes marins: paramètres et analyses. » Editions Quae.
Ayukai, T., et E. Wolanski. 1997. « Importance of biologically mediated removal of fine sediments from the Fly River plume, Papua New Guinea. » Estuarine, Coastal and Shelf
Science 44 (5): 629‑ 39. doi:10.1006/ecss.1996.0172.
Babin, M., A. Morel, V. Fournier-Sicre, F. Fell, et D. Stramski. 2003. « Light scattering properties of marine particles in coastal and open ocean waters as related to the particle mass concentration. » Limnology and Oceanography, 843‑59.
Bader, H. 1970. « The hyperbolic distribution of particle sizes. » Journal of Geophysical
Research 75 (15): 2822‑ 30. doi:10.1029/JC075i015p02822.
Bainbridge, Z. T., E. Wolanski, J. G. Álvarez-Romero, S. E. Lewis, et J. E. Brodie. 2012. « Fine sediment and nutrient dynamics related to particle size and floc formation in a Burdekin River flood plume, Australia. » Marine Pollution Bulletin 65 (4-9): 236‑ 48. doi:10.1016/j.marpolbul.2012.01.043.
Boss, E., M. S. Twardowski, et S. Herring. 2001. « Shape of the particulate beam attenuation spectrum and its inversion to obtain the shape of the particulate size distribution ». Applied
Optics 40 (27): 4885‑93.
Boss, E., W. Slade, et P. Hill. 2009. « Effect of particulate aggregation in aquatic environments on the beam attenuation and its utility as a proxy for particulate mass ». Optics
Express 17 (11): 9408‑20.
Bourrin, F., et X. Durrieu de Madron. 2006. « Contribution to the study of coastal rivers and associated prodeltas to sediment supply in the Gulf of Lions (NW Mediterranean Sea). » Vie
et Milieu 56 (4): 307‑ 14.
Bourrin, F., P. Friend, C. Amos, E. Manca, C. Ulses, A. Palanques, X. Durrieu de Madron, et C. Thompson. 2008. « Sediment dispersal from a typical Mediterranean flood: the Têt River, Gulf of Lions. » Continental Shelf Research 28 (15): 1895‑ 1910.
Bourrin, F., G. Many, X. Durrieu de Madron, J. Martín, P. Puig, L. Houpert, P. Testor, S. Kunesch, K. Mahiouz, et L. Béguery. 2015. « Glider monitoring of shelf suspended particle dynamics and transport during storm and flooding conditions ». Continental Shelf Research 109 (10): 135‑49. doi:10.1016/j.csr.2015.08.031.
ACCEPTED MANUSCRIPT
distributions and the power law approximation in oceanic and estuarine surface waters. »
Journal of Geophysical Research 115 (C10). doi:10.1029/2010JC006256.
Cartwright, G. M., C. T. Friedrichs, et L. P. Sanford. 2011. « In situ characterization of estuarine suspended sediment in the presence of muddy flocs and pellets. » Proceedings of
Coastal Sediments, 2-6.
Clavano, W. R., E. Boss, et L. Karp-Boss. 2007. « Inherent optical properties of non-spherical marine-like particles—from theory to observation ». Oceanography and marine biology: an
annual review 45: 1‑38.
Courp, T., et A. Monaco. 1990. « Sediment dispersal and accumulation on the continental margin of the Gulf of Lions: sedimentary budget. » Continental Shelf Research 10 (9): 1063‑87.
Curran, K. J., P. S. Hill, T. G. Milligan, O. A. Mikkelsen, B. A. Law, X. Durrieu de Madron, et F. Bourrin. 2007. « Settling velocity, effective density, and mass composition of suspended sediment in a coastal bottom boundary layer, Gulf of Lions, France. » Continental Shelf
Research 27 (10-11): 1408‑21. doi:10.1016/j.csr.2007.01.014.
Dagg, M., R. Benner, S. Lohrenz, et D. Lawrence. 2004. « Transformation of dissolved and particulate materials on continental shelves influenced by large rivers: plume processes. »
Continental Shelf Research 24 (7-8): 833‑58. doi:10.1016/j.csr.2004.02.003.
Davies, E. J., W. a. M. Nimmo-Smith, Y. C. Agrawal, et A. J. Souza. 2011. « Scattering signatures of suspended particles: an integrated system for combining digital holography and laser diffraction. » Optics express 19 (25): 25488‑99.
Davis, R. E., C. C. Eriksen, et C. P. Jones. 2002. « Autonomous buoyancy-driven underwater gliders. » The technology and applications of autonomous underwater vehicles, 37‑58.
Drake, D. E. 1976. « Suspended sediment transport and mud deposition on continental shelves. » Marine sediment transport and environmental management 40: 127‑58.
Dufois, F., R. Verney, P. Le Hir, F. Dumas, et S. Charmasson. 2014. « Impact of winter storms on sediment erosion in the Rhone River prodelta and fate of sediment in the Gulf of Lions (North Western Mediterranean Sea). » Continental Shelf Research 72 (1): 57‑72. doi:10.1016/j.csr.2013.11.004.
Durrieu de Madron, X., B. Ferré, G. Le Corre, C. Grenz, P. Conan, M. Pujo-Pay, R. Buscail, et O. Bodiot. 2005. « Trawling-induced resuspension and dispersal of muddy sediments and dissolved elements in the Gulf of Lion (NW Mediterranean). » Continental Shelf Research 25 (19-20): 2387‑2409. doi:10.1016/j.csr.2005.08.002.
Durrieu de Madron, X., et M. Panouse. 1996. « Transport de matière particulaire en suspension sur le plateau continental du Golfe du Lion. Situation estivale et hivernale. »
Comptes rendus de l’Académie des sciences. Série 2. Sciences de la terre et des planètes 322
(12): 1061‑70.
Eisma, D. 1991. « Particle size of suspended matter in estuaries. » Geo-Marine Letters 11 (3-4): 147‑53.
Fox, J. M., P. S. Hill, T. G. Milligan, A. S. Ogston, et A. Boldrin. 2004. « Floc fraction in the waters of the Po River prodelta. » Continental Shelf Research 24 (15): 1699‑1715. doi:10.1016/j.csr.2004.05.009.
Garnier, J. M., J. M. Martin, J. M. Mouchel, et A. J. Thomas. 1991. « Surface reactivity of the Rhône suspended matter and relation with trace element sorption. » Marine Chemistry, 36 (1– 4): 267‑89. doi:10.1016/S0304-4203(09)90066-4.
Gibbs, R. J. 1985. « Estuarine flocs: their size, settling velocity and density. » Journal of
ACCEPTED MANUSCRIPT
Gibbs, R. J., et L. Konwar. 1986. « Coagulation and settling of Amazon River suspended sediment. » Continental Shelf Research, Sedimentary Processes on the Amazon Continental Shelf, 6 (1–2): 127‑49. doi:10.1016/0278-4343(86)90057-9.
Graham, G. W., et W. a. M. Smith. 2010. « The application of holography to the analysis of size and settling velocity of suspended cohesive sediments. » Limnology and Oceanography:
Methods 8: 1‑15.
Graham, G. W., E. J. Davies, W. a. M. Nimmo-Smith, D. G. Bowers, et K. M. Braithwaite. 2012. « Interpreting LISST-100X measurements of particles with complex shape using digital in-line holography. » Journal of Geophysical Research: Oceans 117 (C5): C05034. doi:10.1029/2011JC007613.
Hill, P. S., J. P. Syvitski, E. A. Cowan, et R. D. Powell. 1998. « In situ observations of floc settling velocities in Glacier Bay, Alaska. » Marine Geology 145 (1–2): 85‑94. doi:10.1016/S0025-3227(97)00109-6.
Hill, P. S., T. G. Milligan, et W. R. Geyer. 2000. « Controls on effective settling velocity of suspended sediment in the Eel River flood plume. » Continental Shelf Research, Oceanic Flood Sedimentation, 20 (16): 2095‑2111. doi:10.1016/S0278-4343(00)00064-9.
Jonasz, M. 1983. « Particle-size distributions in the Baltic. » Tellus B 35 (5). doi:10.3402/tellusb.v35i5.14624.
Junge, C. E. 1963. « Air chemistry and radioactivity », 382.
Khelifa, A., et P. S. Hill. 2006. « Models for effective density and settling velocity of flocs. »
Journal of Hydraulic Research 44 (3): 390‑401.
Kineke, G. C, et R. W Sternberg. 1989. « The effect of particle settling velocity on computed suspended sediment concentration profiles. » Marine Geology 90 (3): 159‑74. doi:10.1016/0025-3227(89)90039-X.
Loisel, H., J. M., Nicolas, A., Sciandra, D., Stramski, A., Poteau, 2006. « Spectral dependency of optical backscattering by marine particles from satellite remote sensing of the global ocean. » Journal of Geophysical Research 111, C09024. doi:10.1029/2005JC003367. Maillet, G. M., C. Vella, S. Berné, P. L. Friend, C. L. Amos, T. J. Fleury, et A. Normand. 2006. « Morphological changes and sedimentary processes induced by the December 2003 flood event at the present mouth of the Grand Rhône River (southern France). » Marine
Geology 234 (1-4): 159‑77. doi:10.1016/j.margeo.2006.09.025.
Manning, A. J., et K. R. Dyer. 1999. « A laboratory examination of floc characteristics with regard to turbulent shearing. » Marine Geology 160 (1–2): 147‑70. doi:10.1016/S0025-3227(99)00013-4.
Manning, A. J., K. R. Dyer, R. Lafite, et D. Mikes. 2004. « Flocculation measured by video based instruments in the Gironde Estuary during the European Commission SWAMIEE project. » Journal of Coastal Research, 58‑69.
Manning, A. J., J. R. Spearman, J. V. Baugh, R. J. S. Whitehouse, et R. L. Soulsby. 2011. « Cohesive sediment flocculation and the application to settling flux modelling. » INTECH
Open Access Publisher. http://cdn.intechweb.org/pdfs/15517.pdf.
Manning, A. J., et D. H. Schoellhamer. 2013. « Factors controlling floc settling velocity along a longitudinal estuarine transect. » Marine Geology 345 (10): 266‑80. doi:10.1016/j.margeo.2013.06.018.
Marion, C., F. Dufois, M. Arnaud, et C. Vella. 2010. « In situ record of sedimentary processes near the Rhône River mouth during winter events (Gulf of Lions, Mediterranean Sea). »
Continental Shelf Research 30 (9): 1095‑1107. doi:10.1016/j.csr.2010.02.015.
McCave, I. N., 1972. « Transport and escape of fine-grained sediment from shelf areas. »
Shelf Sediment Transport: Process and Pattern. Dowden, Hutchinson, and Ross, Stroudsburg, Pennsylvania, 225–248.