HAL Id: hal-00296460
https://hal.archives-ouvertes.fr/hal-00296460
Submitted on 26 Feb 2008
HAL is a multi-disciplinary open access
archive for the deposit and dissemination of
sci-entific research documents, whether they are
pub-lished or not. The documents may come from
teaching and research institutions in France or
abroad, or from public or private research centers.
L’archive ouverte pluridisciplinaire HAL, est
destinée au dépôt et à la diffusion de documents
scientifiques de niveau recherche, publiés ou non,
émanant des établissements d’enseignement et de
recherche français ou étrangers, des laboratoires
publics ou privés.
nucleating properties of aerosols
P. K. Quinn, T. S. Bates, D. J. Coffman, D. S. Covert
To cite this version:
P. K. Quinn, T. S. Bates, D. J. Coffman, D. S. Covert. Influence of particle size and chemistry on the
cloud nucleating properties of aerosols. Atmospheric Chemistry and Physics, European Geosciences
Union, 2008, 8 (4), pp.1029-1042. �hal-00296460�
www.atmos-chem-phys.net/8/1029/2008/ © Author(s) 2008. This work is distributed under the Creative Commons Attribution 3.0 License.
Chemistry
and Physics
Influence of particle size and chemistry on the cloud nucleating
properties of aerosols
P. K. Quinn1, T. S. Bates1, D. J. Coffman1, and D. S. Covert2
1NOAA Pacific Marine Environmental Laboratory, Seattle, WA 98115, USA
2Joint Institute for the Study of the Atmosphere and Oceans, University of Washington, Seattle, WA 98105, USA
Received: 28 September 2007 – Published in Atmos. Chem. Phys. Discuss.: 5 October 2007 Revised: 10 January 2008 – Accepted: 20 January 2008 – Published: 26 February 2008
Abstract. The ability of an aerosol particle to act as a cloud condensation nuclei (CCN) is a function of the size of the particle, its composition and mixing state, and the supersat-uration of the cloud. In-situ data from field studies provide a means to assess the relative importance of these param-eters. During the 2006 Texas Air Quality – Gulf of Mex-ico Atmospheric Composition and Climate Study (TexAQS-GoMACCS), the NOAA RV Ronald H. Brown encountered a wide variety of aerosol types ranging from marine near the Florida panhandle to urban and industrial in the Houston-Galveston area. These varied sources provided an oppor-tunity to investigate the role of aerosol sources and chem-istry in the potential activation of particles to form cloud droplets. Measurements were made of CCN concentrations, aerosol chemical composition in the size range relevant for particle activation in warm clouds, and aerosol size distribu-tions. Variability in aerosol composition was parameterized by the mass fraction of Hydrocarbon-like Organic Aerosol (HOA) for particle diameters less than 200 nm (vacuum aero-dynamic). The HOA mass fraction in this size range was lowest for marine aerosol and highest for aerosol sampled close to anthropogenic sources. Combining all data from the experiment reveals that composition (defined by HOA mass fraction) explains 40% of the variance in the critical diam-eter for particle activation at the instrumental supersatura-tion (S) of 0.44%. Correlasupersatura-tions between HOA mass fracsupersatura-tion and aerosol mean diameter show that these two parameters are essentially independent of one another for this data set. We conclude that, based on the variability of the HOA mass fraction observed during TexAQS-GoMACCS, variability in particle composition played a significant role in determin-ing the fraction of particles that could activate to form cloud droplets. Using a simple model based on K¨ohler theory and
Correspondence to: P. K. Quinn
the assumption that HOA is insoluble, we estimate the degree to which calculated CCN concentrations are under- or over-estimated if the variability in the HOA mass fraction that was observed during TexAQS-GoMACCS is neglected. The per-cent under- or overestimation in the CCN conper-centration is re-lated to the source of the aerosol. Relative to the mean HOA mass fraction of 0.4±0.2 (average ±1σ standard deviation) for the entire experiment, CCN concentrations are underes-timated by up to 50% (at 0.22% S) for aerosol sampled far from anthropogenic source regions as it had a lower HOA mass fraction and overestimated by up to 50% for organic-rich aerosol sampled near the source as it had a higher HOA mass fraction.
1 Introduction
In both the IPCC Third and Fourth Assessment Reports (IPCC, 2001, 2007), aerosol indirect forcing is assigned the largest source of uncertainty among all climate forcing mech-anisms. In the Fourth Assessment Report, the radiative forc-ing due to the first indirect or cloud albedo effect is given a low level of scientific understanding for liquid water clouds. The cloud albedo effect occurs as the portion of aerosol that forms cloud condensation nuclei (CCN) increases in concentration and modifies the microphysical properties of
clouds. For a fixed liquid water content, an increase in
CCN will lead to enhanced cloud droplet number concentra-tion, decreased droplet size, and enhanced cloud albedo (e.g., Twomey, 1977). The ability of any particle within a popula-tion of aerosol particles to act as a CCN and nucleate cloud droplets is a function of its size and chemical composition as well as the supersaturation of the air parcel. For a distribution of particles the spectrum of CCN with respect to supersatu-ration depends on the median diameter, standard deviation, number concentration and the internal mixing state. Compo-sition affects CCN activity by determining molecular weight
30.0 29.5 29.0 28.5 28.0 27.5 L a ti tu d e -98 -97 -96 -95 -94 Longitude 5000 4000 3000 2000 1000 0 R n , m B q m -3 Gulf of Mexico Barbours Cut Freeport Galveston Bay Houston Ship Channel Jacinto Port
Beaumont Port Arthur (a) 30.0 29.8 29.6 29.4 29.2 29.0 28.8 L a ti tu d e -96.0 -95.5 -95.0 -94.5 -94.0 -93.5 -93.0 Longitude Gulf of Mexico Barbours Cut Freeport Galveston Bay Houston Ship Channel
Jacinto Port 0.8 0.6 0.4 0.2 HOA MF (Dvaero < 200 nm) Beaumont Port Arthur (b)
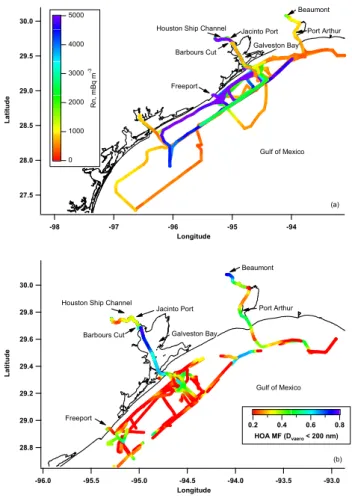
Figure 1. Cruise track in the GoMACCS study region colored by a) Rn and b) HOA mass fraction. GoMACCS took place from late July to mid-September, 2006. The portion of
Fig. 1. Cruise track in the GoMACCS study region colored by (a)
Rn and (b) HOA mass fraction. GoMACCS took place from late July to mid-September, 2006. The portion of the cruise track from Charleston, SC to the GoMACCS study region is not shown.
of the solute within a cloud droplet, density, solubility, de-gree of dissociation, and surface tension. Understanding how these parameters influence particle activation to form CCN is essential to improving estimates of cloud droplet forma-tion by global climate models (e.g., Abdul-Razzak and Ghan, 2002; Fountakis and Nenes, 2005).
The relative importance of aerosol parameters (size distri-bution and composition) and dynamical parameters (updraft velocity and liquid water content) in controlling cloud albedo has been the subject of many recent studies. Modeling stud-ies have investigated links between aerosol parameters and cloud microphysical properties. Using a cloud parcel model, Feingold (2003) found that the aerosol number concentration was consistently important for determining cloud drop effec-tive radius while the importance of other parameters varied for different conditions. Modeling studies have also investi-gated the influence of selected organic compounds and inor-ganic/organic mixtures on cloud drop number concentration (e.g., Shantz et al., 2003; Nenes et al., 2002; Mircea et al., 2002). A comparison of these studies revealed that predicted
changes in droplet concentration due to the presence of or-ganics in aerosols varied from −86% to +110% (Ervens et al., 2005). This wide range is a result of variability in the treatment of composition parameters in the models includ-ing solubility, molecular weight, and surface tension suppres-sion. Most of these previous studies focused on the impact of organic acids and water soluble organic carbon. Petzold et al. (2005) investigated carbonaceous particles produced by combustion and found that only a small fraction activated to CCN. Furthermore, a high fraction of non-volatile organic matter in the particles caused a considerable increase in the activation diameter.
Measurements from recent field campaigns have been used to assess the importance of particle size versus variability in chemical composition in determining CCN concentrations. Based on measurements of a limited range of aerosol compo-sition encountered at a non-urban site in Germany, Dusek et al. (2006) reported that variation in the size distribution was able to explain 84 to 96% of the variance in measured CCN concentrations. Measurements of a broader range of aerosol composition during several aircraft campaigns indicated that a knowledge of both size and composition are required to ac-curately deduce CCN concentrations in the absence of CCN measurements (Hudson, 2007). Here we investigate the roles of aerosol size and composition in determining CCN concen-trations based on measurements made during the 2006 Texas Air Quality – Gulf of Mexico Atmospheric Composition and Climate Study (TexAQS-GoMACCS; hereafter GoMACCS) onboard the NOAA RV Ronald H. Brown.
GoMACCS took place in 2006 from the end of July to the middle of September. Photochemical pollution and regional haze are common during this time of year in Texas. Between 27 July and 11 September 2006, the NOAA RV Ronald H.
Brown encountered a wide variety of aerosol types ranging
from marine over the Atlantic Ocean near the Florida pan-handle to urban and industrial in the Houston-Galveston area (Fig. 1). This wide variability in aerosol sources and chem-ical composition provided an opportunity to investigate the role of chemistry in the activation of particles to form cloud droplets. For this purpose, measurements were made of the CCN number concentration at five different supersaturations, aerosol chemical composition, and the particle size distribu-tion.
For realistic updraft velocities and corresponding supersat-urations of warm clouds, composition effects on cloud drop activation will be most pronounced for particles with diam-eters between about 40 and 200 nm (e.g., McFiggans et al., 2006). Regardless of composition, smaller diameter particles will not activate under these conditions while larger diame-ter particles will. Hence, it is this indiame-termediate size range that is of interest when determining composition effects on CCN activation. It is significant, then, that this size range (<200 nm) often contains a large mass fraction of particu-late organic matter (POM). Furthermore, the POM in this size range tends to be composed of relatively low solubility
hydrocarbon-like organic aerosol (HOA) while POM mea-sured at larger diameters is composed of oxygenated organic aerosol (OOA) (e.g., Zhang et al., 2005a, b; Alfarra et al., 2004; Allan et al., 2003). HOA in the smaller size range may lead to fewer particles activating to form CCN compared to the case where the POM is composed only of OOA (McFig-gans et al., 2006).
In this study, we relate the HOA mass fraction (HOAMF)
for vacuum aerodynamic diameters (Dvaero)<200 nm
mea-sured during GoMACCS to the critical diameter for
activa-tion (Dc). (A Dvaero of 200 nm corresponds to a geometric
diameter of 133 nm for a spherical particle with a density of 1.5.) The goal of this analysis is to examine the influence of particle composition on CCN activation for the variability in the aerosol observed during this experiment. In addition, the degree of under- or overestimation of the CCN concentration due to neglecting the variability in HOA mass fraction ob-served during GoMACCS is calculated using a simple model based on K¨ohler theory.
2 Methods
2.1 Aerosol sampling inlet
Sample air for all aerosol measurements was drawn through a 6-m mast. The entrance to the mast was 18 m above sea level and forward of the ship’s stack. The mast was automat-ically rotated into the relative wind to maintain nominally isokinetic flow and minimize the loss of supermicrometer particles. Air entered the inlet through a 5 cm diameter hole,
passed through a 7◦expansion cone, and then into the 20 cm
inner diameter sampling mast. The flow through the mast
was 1 m3min−1. The transmission efficiency of the inlet for
particles with aerodynamic diameters less than 6.5 µm (the largest size tested) is greater than 95% (Bates et al., 2002).
The bottom 1.5 m of the mast were heated to establish a stable reference relative humidity (RH) for the sample air of
60±5%. On average, the aerosol was heated 2.5◦C above
the ambient temperature. Stainless steel tubes extending into the heated portion of the mast were connected to downstream aerosol instrumentation with either conductive silicon tubing or stainless steel tubing for analysis of organic aerosol.
The data reported here are based on air that was sam-pled only when the particle number concentration, the rela-tive wind speed, and the relarela-tive wind direction all indicated that there was no possibility of contamination from the ship’s stack.
2.2 CCN concentration
A Droplet Measurement Technologies (DMT) CCN counter was used to determine CCN concentrations at supersatura-tions, S, of 0.22, 0.44, 0.65, 0.84, and 1.0%. Details con-cerning the characteristics of the DMT CCN counter can be found in Roberts and Nenes (2005) and Lance et al. (2006).
A multijet cascade impactor (Berner et al., 1979) with a 50% aerodynamic cutoff diameter of 1 µm was upstream of the CCN counter. The instrument was operated in two differ-ent modes. When the ship was located close to urban, in-dustrial, or marine vessel sources such that aerosol concen-trations fluctuated rapidly, a single supersaturation setting of 0.44% was often used. Away from sources when aerosol con-ditions were more stable, the five different supersaturations were cycled through over a 30 min period. For the multiple supersaturation mode, the first 2 min of each 6 min period were discarded so that only periods with stable supersatura-tions are included in the analyzed data set.
The CCN counter was calibrated before and during the
ex-periment as outlined by Lance et al. (2006). An (NH4)2SO4
aqueous solution was atomized with dry air, passed through a diffusional drier, diluted and then introduced to a Scan-ning Mobility Particle Sizer (SMPS, TSI). The resulting monodisperse aerosol stream was sampled simultaneously by the CCN counter and a water-based Condensation Particle Counter (WCPC, TSI) in order to determine the average acti-vated fraction (CCN/CN). This procedure was repeated for a range of particle sizes and instrumental supersaturations. Us-ing this procedure, the instrument supersaturation is equal to the critical supersaturation of the particle obtained from the activation curve for an activated fraction of 50%. The crit-ical supersaturation for a given particle size was calculated from K¨ohler theory (e.g., Fitzgerald and Hoppel, 1984). The supersaturations reported in the text are based on the calibra-tions and not the instrumental readout which disregards ther-mal efficiency. The difference between the calibrated values and those reported by the instrument were similar to the dif-ference found by Lance et al. (2006). The uncertainty asso-ciated with the CCN number concentrations is estimated to be less than ±10% (Roberts and Nenes, 2005). Uncertainty in the instrumental supersaturation is less than ±1% for the operating conditions of this experiment (Roberts and Nenes, 2005).
2.3 Particle number size distributions
Size distributions from 20 to 200 nm and from 200 to 800 nm in geometric diameter were measured with two parallel dif-ferential mobility particle sizers (DMPS, University of Vi-enna (Winklmeyer, 1991) short and medium length columns, respectively) coupled to condensation particle counters (CPC model 3760A, TSI). The relative humidity of the sheath air for both instruments was controlled such that the measure-ment RH was approximately 60%. Mobility distributions were collected every 5 min. Details of the mobility distribu-tion measurements and inversion methods are given by Bates et al. (2004) and Stratmann and Wiedensohler (1997).
Size distributions from 0.9 to 10 µm in aerodynamic di-ameter were measured with an aerodynamic particle sizer (APS model 3321, TSI). Modifications were made to the APS to reduce internal heating of the sample air so that the
measurement RH was close to 60%. Size distributions were collected every 5 min to match the DMPS scan time. APS size distributions were converted from aerodynamic to ge-ometric diameters using densities based on the measured, time-dependent chemical composition (Quinn et al., 2002). The uncertainty associated with the number concentration derived from the size distribution measurements is estimated to be ±18% (Quinn et al., 2004).
Geometric number mean diameters (Dgn) were calculated
from a lognormal fit to each measured size distribution. If the size distribution contained both an Aitken and accumulation mode, the fit was performed on the smaller Aitken mode. If only an accumulation mode was present in the
submicrome-ter size range, it was used to desubmicrome-termine Dgn.
2.4 Particle chemical composition
Concentrations of submicrometer non-refractory NH+4, SO=4,
NO−3, and POM were measured with a Quadrupole Aerosol
Mass Spectrometer (Q-AMS, Aerodyne Research Inc., Bil-lerica, MA). The AMS was downstream of a multijet cas-cade impactor with a 50% cutoff diameter of 1 µm (Berner et al., 1979). Sample air reaching the AMS was at an RH of 52±3.2%. The species measured by the AMS are referred to as non-refractory (NR) and are defined here as all the
chemical components that vaporize at 550◦C. These species
include most organic components, inorganics such as am-monium nitrate and amam-monium sulfate salts but not mineral dust, elemental carbon, or sea salt. The POM aerosol was di-vided into two fractions, a hydrocarbon-like organic aerosol (HOA) and an oxygenated organic aerosol (OOA) using a multiple linear regression of m/z 57 and m/z 44, respec-tively (Zhang et al., 2005a). The ionization efficiency of the AMS was calibrated every few days with dry
monodis-perse NH4NO3 particles using the procedure described by
Jimenez et al. (2003). The instrument operated on a 5 min cycle with the standard AMS aerodynamic lens (Canagaratna et al., 2007).
The collection efficiency of the AMS is the product of the transmission of particles through the aerodynamic lens (EL), the efficiency with which particles are focused by the
lens and directed to the impactor-vaporizer (ES), and the
de-gree to which particles are vaporized and analyzed versus
bounced off the impactor-vaporizer (EB) (Huffman et al.,
2005). Particle losses due to transmission through the lens were corrected by using the DMPS and APS-measured size distributions. This correction added, on average, 14±8% to the AMS total mass. Based on beam width probe data, there
was no indication of particle loss due to ES. EBis a function
of particle water content and chemical composition (Allan et
al., 2003). Comparison of the size corrected (EL) AMS NR
sulfate with sulfate simultaneously measured with a particle-into-liquid-sampler coupled to an ion chromatograph
(PILS-IC) indicates that EBvaried from 1 for acidic sulfate
(ammo-nium to sulfate molar ratio of <0.5) to 0.54 for ammo(ammo-nium
sulfate. Therefore, EB was assigned to each 5 min sample
based on the AMS ammonium to sulfate molar ratio with EB
as an exponential function of the ammonium to sulfate molar ratio varying from 0.54 to 1 for ammonium to sulfate molar ratios of 2 to 0.5. There was no indication from the AMS mass size distributions that the ammonium to sulfate molar ratio varied as a function of size over the accumulation mode size range. A linear regression of 5 min transmission and bounce corrected AMS sulfate concentrations versus
PILS-IC sulfate concentrations yielded a slope of 0.95 and an r2
of 0.81. The uncertainty in the AMS concentration measure-ments during GoMACCS was estimated at ±20%.
2.5 Radon
Radon was detected with a dual-flow loop, two-filter tor (Whittlestone and Zahorowski, 1998). The radon detec-tor was standardized using radon emitted from a permeation tube. Background counts were measured with the air flow set to zero.
3 Results
To relate aerosol sources and transport to CCN formation, the data set was segregated in two ways. The first was based on geographical location and includes both offshore and in-land sampling sites (Fig. 1). The offshore locations include a portion of the cruise track in the Atlantic Ocean as the ship transited from Charleston, SC to the GoMACCS study area. Additional offshore locations include the Gulf of Mex-ico during the initial transit to the Houston-Galveston area and subsequent visits over the course of the experiment. In-land locations include Galveston Bay which is the thorough-fare for ships transiting from the Gulf of Mexico to Hous-ton, the Houston Ship Channel which is heavily impacted by marine vessel traffic and petrochemical and other industrial activities, Barbours Cut which is located at the entrance to the east-west portion of the ship channel and is the site of a major container and cruise terminal, Jacinto Port which is located on the north side of the Houston Ship Channel, and Freeport which is the site of a large chemical plant.
The second data sorting procedure was based on surface wind direction and radon concentrations. Radon was used in the data analysis to differentiate between sampled air from northerly flow that had been over the continent during the past day and “background” southerly flow from the Gulf of Mexico toward the continent. The radon threshold
be-tween continental and “background” air was 1000 mBq m−3
(Fig. 1). This sorting led to three categories 1)
Gulf-Southerly Flow which includes samples taken in the Gulf of Mexico during southerly flow and low radon concentra-tions and, hence, represents background air entering Texas, 2) Inland Texas-Southerly Flow which also includes samples taken during southerly flow and low radon concentrations
0 0.2 0.4 0.6 0.8 Barbours Cut Galveston Bay Houston Ship Channel Gulf of Mexico M a s s F ra c ti o n OOA Sub-1 um HOA Sub-1 um SO4 Sub-1 um OOA Sub-200 nm HOA Sub-200 nm SO4 Sub-200 nm 0 0.2 0.4 0.6 0.8 Inland Texas -Southerly Flow
Northerly Flow Gulf - Southerly Flow M a s s F ra c ti o n 6 5 4 3 2 1 0 d M /d lo g Dva (µ g m -3) 3 4 5 6 7 89 100 2 3 4 5 6 7 8
Vacuum Aerodynamic Diameter (nm)
1.0 0.8 0.6 0.4 0.2 0.0 PO M / (P O M + S O 4) 8/4 1510 - 8/5 2025 SO4 POM HOA OOA POM mass fraction
6 5 4 3 2 1 0 d M /d lo g Dva (µ g m -3) 3 4 5 6 7 8 9 100 2 3 4 5 6 7 8
Vacuum Aerodyna mic Diameter (nm)
1.0 0.8 0.6 0.4 0.2 0.0 P O M / ( P O M + S O 4) SO4 POM POM mass fraction
9/11 0015 - 1300
(a)
(b)
(c)
(d)
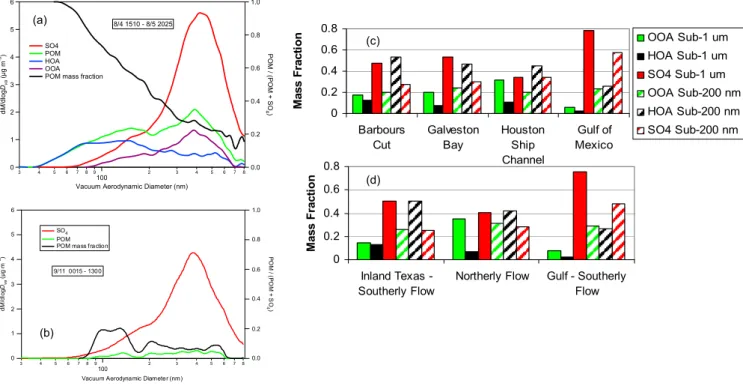
Fig. 2. Average size distribution of the chemical components and POM mass fraction for (a) 8/4 15:10 to 8/5 20:25 UTC at Barbours Cut
and (b) 9/11 00:15 to 13:00 UTC in the Gulf of Mexico. Also shown are mass fractions averaged over the submicrometer and sub-200 nm size ranges for (c) geographical sampling locations and (d) wind-radon regimes.
but from inland locations and, thus, represents background air entering Texas plus local sources near the sampling site, and 3) Northerly Flow which includes samples taken during northerly flow and high radon concentrations and, therefore, represents continentally-influenced air masses impacted by both distant and local sources.
3.1 Aerosol composition and size during GoMACCS
3.1.1 Aerosol composition
Previously reported AMS measurements indicate several general features concerning the regional distribution of POM in terms of particle size and composition (Canagaratna et al., 2007). In general, in both rural and urban environments, the POM that occurs in the accumulation mode size range (200
to 500 nm Dvaero) has a mass spectra that is characteristic
of oxygenated organic molecules (e.g., Zhang et al., 2005a, b; Alfarra et al., 2004; Allan et al., 2003; Boudries et al., 2004). This OOA is typically internally mixed with inor-ganic species such as ammonium sulfate salts (e.g., Cubison et al., 2005). However, in urban environments there often is a second mode of POM with a smaller average mass mean
diameter (Dvaero∼100 nm) that has a mass spectrum
charac-teristic of hydrocarbons (Allan et al., 2003; Drewnick et al., 2004; Zhang et al., 2005b) and that is very similar to what
has been measured in fresh vehicle exhaust (Canagaratna et al., 2004; Schneider et al., 2005).
Results from GoMACCS are consistent with these previ-ously reported measurements. The mass fraction of HOA
for Dvaero<200 nm often exceeded 0.5 for the inland
por-tions of the cruise track (Galveston Bay, Barbours Cut, Beau-mont, and Port Arthur) where urban and marine vessel emis-sions were most pronounced (Fig. 1). Size distributions of the POM components, sulfate, and POM mass fraction are shown in more detail in Fig. 2a for a period when the ship was docked for thirty hours at Barbours Cut on 4 and 5 Au-gust. The POM mass fraction is calculated as the mass con-centration of POM divided by the total mass measured by the AMS. AMS size distributions averaged over this period show the occurrence of POM in the accumulation mode at about one third the mass concentration of sulfate. The major-ity of this POM was OOA. In contrast, POM dominated the
Aitken mode (mass mean Dvaero of 160 nm) and was
com-posed primarily of HOA. The POM mass fraction was 0.45 at Dvaero=200 nm and increased steadily to near one at Dvaero
of 50 nm.
Figure 2b shows the same information for a 13 h period on 11 September when the ship was offshore in the Gulf of Mexico. During this period, local winds were from the south
at less than 5 m s−1and radon concentrations were low
with land. In this case, sulfate dominated the submicrometer mass at all sizes such that the POM mass fraction was 0.25 or less for all particle diameters. The majority of the sulfate was most likely due to emissions from the large number of ma-rine vessels in the upwind region (Bates et al., in preparation, 2008).
To compare the degree to which HOA contributed to the sub-200 nm mass versus the entire submicrometer size range, HOA, OOA, and sulfate mass fractions were calculated for these two size ranges. Mass fractions were calculated as the mass of the component divided by the total mass mea-sured by the AMS. Average mass fractions for the periods spent in Barbours Cut, Galveston Bay, the Houston Ship Channel, and the Gulf of Mexico are shown in Fig. 2c. On average, for the inland sampling locations, sulfate domi-nated the submicrometer mass with OOA having the
sec-ond largest mass fraction. Average submicrometer mass
fractions of HOA were less than 0.14 for each of the in-land locations (Barbours Cut: 0.13±0.11, Galveston Bay: 0.07±0.08, Houston Ship Channel: 0.11±0.08). The sub-200 nm mass fractions look very different, however, with
av-erage HOAMFof 0.53±0.20 at Barbours Cut, 0.47±0.21 in
Galveston Bay, and 0.45±0.16 in the Houston Ship Channel. Relative to the inland sampling locations, both
submicrome-ter and sub-200 nm HOAMFwere lower for the offshore trips
into the Gulf of Mexico. Averaged over all the times the ship
spent in the Gulf of Mexico, the submicrometer HOAMFwas
0.02±0.03 compared to a sub-200 nm value of 0.26±0.19. Figure 2a shows that not only the mass fractions but also the size distributions of HOA, OOA, sulfate are different within the sub-200 nm size range. Sulfate and OOA tail into this size range meaning that their largest concentrations occur at large diameters while HOA peaks in this size range and, therefore, has more broadly distributed concentrations throughout the size range.
Average submicrometer and sub-200 nm mass fractions are shown for the different wind-radon regimes in Fig. 2d. For all three regimes, the submicrometer mass is dominated by sulfate with OOA having the second largest average mass fraction. However, for the Inland Texas – Southerly Flow
regime, HOAMF and OOAMF are nearly the same
reflect-ing the close proximity of the ship to anthropogenic sources.
The OOAMF is about three times greater than the HOAMF
for the Northerly Flow regime reflecting the mix of distant and local sources in this category. Submicrometer average mass fractions for the Gulf-Southerly Flow regime are sim-ilar to the “Gulf of Mexico” category in Fig. 2b. For the two wind-radon regimes impacted by continental emissions,
HOA dominated the sub-200 nm size range. The HOAMF
for this size range averaged 0.51±0.21 for the Inland Texas-Southerly Flow regime and 0.42±0.23 for the Northerly Flow regime.
In summary, the particle size range most sensitive to com-position effects in CCN activation was, for much of the ex-periment, dominated by HOA, an organic component whose
mass spectrum is similar to those of diesel exhaust, lu-bricating oil, and freshly emitted traffic aerosols (Zhang
et al., 2005a). In contrast, the organics within particles
with Dvaero>200 nm were dominated by a component with
a mass spectrum indicative of aged, oxygenated organic aerosols. In the following analysis, the mass fraction of HOA
for Dvaero<200 nm was used to represent the variability of
aerosol composition during the GoMACCS experiment be-cause of its prevalence in this size range and its limited sol-ubility which is expected to impact the CCN activation pro-cess.
3.1.2 Aerosol number size distribution
The geometric mean number diameter based on a lognormal fit of each measured size distribution was used to indicate the variability of particle size during GoMACCS. Only number modes contained in the submicrometer size range were
con-sidered. The geometric standard deviation, σsg, or width of
the mode also has been shown in modeling studies to affect cloud drop number concentrations (Feingold, 2003). At high
particle concentrations, for a given Dgn and total number
concentration, increases in σsglead to a decrease in the drop
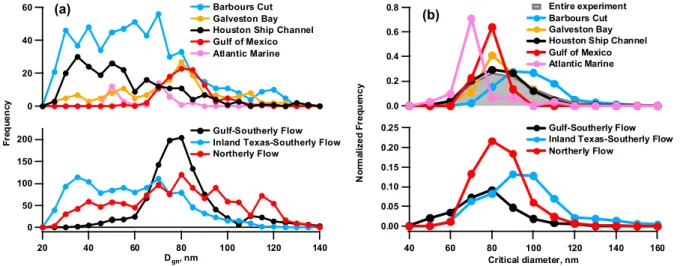
concentration because as the mode becomes broader, rela-tively more large particles are present and activated which leads to a suppression of the supersaturation. The decrease in supersaturation may lead to fewer particles being acti-vated to CCN especially in polluted air masses dominated by larger particles. Near-source sampling locations (Bar-bours Cut and Houston Ship Channel) had high frequencies
of lower values of Dgn(<70 nm) (Fig. 3a). Larger
frequen-cies of Dgn>70 nm occurred for Galveston Bay and Gulf of
Mexico which are more distant from anthropogenic conti-nental sources. Correspondingly, the local sources picked up under Inland-Texas-Southerly Flow conditions led to a
high frequency of smaller Dgnvalues while Gulf-Southerly
Flow conditions had a high frequency of Dgn>70 nm. The
Northerly Flow regime which included both local and more distant continental sources had more broadly distributed
val-ues of Dgn.
Both the sub-200 nm HOA mass fraction and the mean diameter displayed general trends in the context of sam-pling location and wind direction-radon regimes as discussed above. There was no significant correlation between these two parameters, however, for either the individual sample categories or for the overall data set. The coefficient of
deter-mination, r2, for HOAMF versus Dgnfor the whole
experi-ment was 0.10 indicating that the HOAMFcould only explain
Figure 3. Frequency distributions based on aerosol sampled at different geographical
60 40 20 0 140 120 100 80 60 40 20 Dgn, nm 200 150 100 50 0 F re q u e n c y Barbours Cut Galveston Bay Houston Ship Channel Gulf of Mexico Atlantic MarineGulf-Southerly Flow Inland Texas-Southerly Flow Northerly Flow 0.8 0.6 0.4 0.2 0.0 N o rm a li z e d F re q u e n c y 160 140 120 100 80 60 40 Critical diameter, nm 0.25 0.20 0.15 0.10 0.05
(a) Entire experiment
(b) Barbours Cut
Galveston Bay Houston Ship Channel Gulf of Mexico Atlantic Marine
Gulf-Southerly Flow Inland Texas-Southerly Flow Northerly Flow
0.00
Fig. 3. Frequency distributions based on aerosol sampled at different geographical locations and the three wind-radon regimes of (a) the
geometric mean diameter (Dgn) and (b) critical diameter at S=0.44%.
3.2 Impact of composition on CCN formation
3.2.1 Calculation of critical diameter
The correlation between critical diameter for CCN activation
(Dc) and aerosol composition was used to quantify the
im-pact of composition on particle activation. Dc is defined in
this analysis as the diameter at which
CCNmeasured = CNCintegrated (1)
where CNCintegrated, the integrated condensation nuclei
con-centration, was found by integrating the number-size distri-butions from the largest diameter measured down to the di-ameter where the above equation was satisfied. Uncertainty
in Eq. (1) and, therefore in Dc, is estimated at ±20% based
on a quadrature of the errors in the number concentrations de-rived from the CCN counter (±10%) and the measured size
distributions (±18%). The actual uncertainty in Dc will
de-viate from this estimate depending on the slope of the size
distribution around Dc, i.e., whether Dc is greater than or
less than Dgn.
Normalized frequency distributions of Dc are shown at
S=0.44% in Fig. 3b. Values of Dc calculated for the
en-tire experiment extended up to near 170 nm. The highest
frequency of small values of Dc (<80 nm) corresponded to
measurements of marine aerosol made as the ship transited from South Carolina to the study region (denoted here as
At-lantic Marine). Locations with a high frequency of Dc
be-tween 70 and 90 nm included the Gulf of Mexico and Galve-ston Bay. These locations are impacted by anthropogenic
emissions but are not immediately downwind. Values of Dc
greater than 90 nm were most frequent for inland sampling locations next to urban and industrial sources (Barbours Cut and the Houston Ship Channel). A comparison of values
200 180 160 140 120 100 80 60 40 C ri ti c a l D ia m e te r, D c (n m ) 1.0 0.8 0.6 0.4 0.2 0.0 HOA MF (Dvaero < 200 nm)
All data at 0.44% supersaturation Barbours Cut
Freeport Galveston Bay Gulf of Mexico Houston Ship Channel Jacinto Port Atlantic Marine (NH4)2SO4 test aerosol
y = 43x +75, r2 = 0.4
Figure 4. HOAMF of the AMS mass for the size range Dvaero < 200 nm vs. critical
diameter calculated at 0.44% supersaturation. Highlighted are data from different
Fig. 4. HOAMFof the AMS mass for the size range Dvaero<200 nm
vs. critical diameter calculated at 0.44% supersaturation. High-lighted are data from different sampling locations and ammonium sulfate test aerosol.
of Dc calculated for the different wind-radon regimes
re-veals distinct differences similar to those for the geograph-ical sampling locations (Fig. 3b). The Gulf-Southerly Flow regime had the highest frequency of values at or less than 80 nm while the Inland Texas-Southerly Flow regime was just the opposite with the highest frequency of values at or greater than 90 nm. The highest frequency of values for the Northerly Flow regime occured between 70 and 90 nm which spans those of the other two regimes.
3.2.2 Relationship between HOA mass fraction and critical
diameter
The HOA mass fraction for the sub-200 nm size range is
plotted versus Dc in Fig. 4 for the entire experiment and
200 160 120 80 40 C ri ti c a l D ia m e te r, D c (n m ) 1.0 0.8 0.6 0.4 0.2 0.0 HOA MF ( Dvaero< 200 nm) 200 160 120 80 40 200 160 120 80 40 Gulf-Southerly Flow Inland Texas-Southerly Flow Northerly Flow (NH4)2SO4 test aerosol
y = 25x + 75, r2 = 0.1
y = 51x +75, r2 = 0.34
y = 31x + 77, r2 = 0.41
Fig. 5. HOA mass fraction of the AMS mass for the size range Dvaero<200 nm vs. critical diameter calculated at 0.44%
supersat-uration. Shown are the data from the three wind-radon regimes and ammonium sulfate test aerosol.
for the three wind-radon regimes. These plots include all measurements taken at S=0.44%. Over the course of the
experiment, HOAMF spanned the maximum possible range
from near zero to near one. Dc ranged from around 50 nm,
which corresponds to Dcof ammonium sulfate at S=0.44%,
to near 170 nm. For each geographical location, an increase
in HOAMFcorresponded to an increase in Dc(Fig. 4). A
re-gression of these two parameters for all measurements made
at S=0.44% yields a coefficient of determination, r2, of 0.4
indicating that the HOAMF explained 40% of the variance
in Dc. The slope corresponds to a change in Dc of around
40 nm (75 to 115 nm) for the full range of HOAMFobserved.
Positive correlations also were found for each of the three wind-radon regimes although the degree of correlation
var-ied (Fig. 5). The correlation was strongest (r2=0.41) for
the Northerly Flow regime where HOAMF varied between
near zero and near one and mass concentrations were high so that the AMS signal-to-noise ratio was high. The correla-tion was weaker for the Inland Texas-Southerly Flow regime as concentrations were lower and signal-to-noise ratio was higher. This noise issue and the occurrence of a narrower
range of HOAMF most likely contributed to a poor
correla-tion (r2=0.1) for the Gulf-Southerly Flow regime.
The HOAMF–Dcrelationship is a strong function of
saturation. Segregating the data set by measurement super-saturation reveals a positive slope at each supersuper-saturation but
the magnitude of the slope and the r2values decreases with
increasing supersaturation (Table 1). As the supersaturation increases, more smaller particles will activate. Hence, the change in slope may be due to a less variable particle com-position (number of soluble molecules or ions per unit mass) in the lower end of Aitken size range. This response to in-creasing supersaturation may also be due to non-linearities
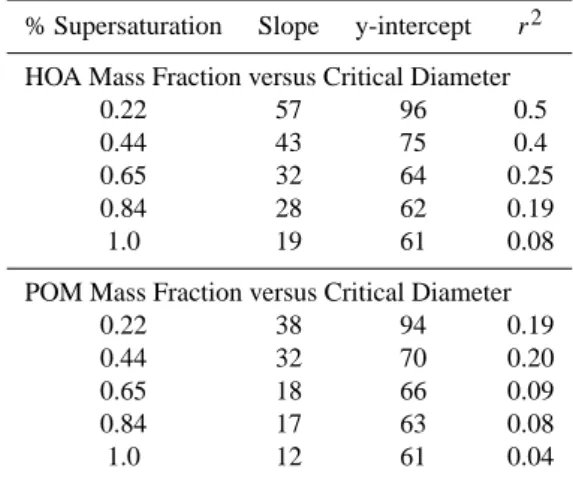
Table 1. Coefficients of linear regression for HOA and POM mass
fractions (Dvaero<200 nm) vs. critical diameter at 5
supersatura-tions.
% Supersaturation Slope y-intercept r2
HOA Mass Fraction versus Critical Diameter
0.22 57 96 0.5
0.44 43 75 0.4
0.65 32 64 0.25
0.84 28 62 0.19
1.0 19 61 0.08
POM Mass Fraction versus Critical Diameter
0.22 38 94 0.19
0.44 32 70 0.20
0.65 18 66 0.09
0.84 17 63 0.08
1.0 12 61 0.04
in the K¨ohler equation. For comparison, a similar regression analysis (i.e., with the data segregated by measurement su-persaturation) was performed on the sub-200 nm POM mass
fraction and Dc. As for HOAMF versus Dc, a positive slope
was found at each value of S with the magnitude of the slope decreasing with increasing S (Table 1). However, the slope
and r2values at each supersaturation were less than those for
the HOAMF–Dc relationship. All r2values were less than
or equal to 0.2 indicating only a weak correlation between
POM mass fraction and Dc. Hence, the chemical properties
of HOA that affect CCN activation are distinct from those of the bulk POM aerosol.
A multivariate factor analysis was performed to further as-sess the correlation between critical diameter and compo-sition. Factor analysis often is used to separate chemical species and other relevant parameters into different groups based on their degree of covariance (e.g., Sweet and Ver-mette, 1992; Millet et al., 2005; Quinn et al., 2006). Pa-rameters with a high degree of covariance are grouped to-gether into factors. The analysis results in a loading matrix that reveals the strength of the association between parame-ters within and between factors. The analysis performed here was done using a principal component method with varimax rotation (SYSTAT 11, SYSTAT Software, Inc.). The goal was to test for the degree of covariance between aerosol
com-ponent mass fractions (SO=4, NH+4, OOA, and HOA) in the
submicron and sub-200 nm size ranges and Dcand, in
partic-ular, to determine with which variables Dcwas most strongly
correlated.
Five factors explained 91% of the total variance. Factor
one, which contained a high loading for Dc (−0.84),
ex-plained 27% of the total variance in the parameters included
in the factor analysis. Also highly loaded on this factor
(+0.64), indicating a strong covariance between them and
Dc. A high HOA mass fraction forced a larger Dc value for
a given supersaturation because the particle, as a whole, had fewer water soluble molecules or ions. The positive loading
for the sub-200 nm SO=4 mass fraction indicates an increase
in soluble mass led to a decrease in Dc. Hence, the
multivari-ate analysis confirms the strong relationship between compo-sition and critical diameter within this data set. Factor four, which explained 15% of the total variance had a high loading
for only Dgn(+0.92) indicating it was independent from all
other parameters included in the factor analysis.
3.3 Modeled sensitivity of CCN concentration to observed
variability in composition and particle size
A model study based on K¨ohler theory was performed to determine to what degree calculated CCN concentrations would be under- or overestimated if the variability in the HOA mass fraction observed during GoMACCS was ne-glected. The equilibrium vapor pressure over the surface of a solution droplet is described by the K¨ohler Equation (e.g., Fitzgerald and Hoppel, 1984)
S = e ′ es −1 ≈ 2A d − Bdo3 d3 (2)
where e′ is the equilibrium vapor pressure over the curved
surface of a solution droplet, esis the equilibrium vapor
pres-sure over a flat surface of pure water,
A = 2σ Mw ρwRvT (3) and B = iερsMw ρwMs . (4)
Here, d and doare the droplet and dry particle diameters, σ
is the surface tension, Mwand Msare the molecular weights
of water and solute, ρwand ρs are the densities of water and
solute, Rvis the gas constant for water vapor, T is the
tem-perature, i is the van’t Hoff factor, and ε is the water soluble fraction of the dry particle. By taking the first derivative of Eq. (1) with respect to diameter and finding the maximum,
the following equation relating critical supersaturation (Sc)
to Dccan be derived (e.g., Rogers and Yau, 1989; Corrigan
and Novakov, 1999; Hudson, 2007)
Sc= " 32A3 27B #1/2 Dc−3/2. (5)
Using Eq. (5), Dc was calculated for Sc values of 0.22,
0.44, and 1.0% which correspond to three of the measure-ment supersaturation values (S) used during the experimeasure-ment.
CCN concentrations for Sc=0.22, 0.44, and 1.0% were
cal-culated by integrating a modeled unimodal, log-normal size
distribution over all diameters greater than the Dc that was
found to correspond to the value of Scusing Eq. (5). Modeled
size distributions were constructed using a geometric mean diameter varying between 20 and 140 nm. For each size
dis-tribution regardless of Dgn, the total number concentration
was normalized to 3000 cm−3 and the geometric standard
deviation was set to 1.5. Using this method, CCN concen-trations were calculated for a matrix (201×201) of insoluble mass fractions ranging from 0 to 1 and mean diameters rang-ing from 20 to 140 nm.
The percent under- and overestimation of the CCN con-centration due to neglecting the variability in the HOA mass fraction observed during GoMACCS was calculated by tak-ing the difference between a matrix where the insoluble frac-tion was made constant at 0.4 for all diameters and a ma-trix where the insoluble mass fraction varied from 0 to 1.0 at each diameter. Hence, the base case was an insoluble mass fraction of 0.4 which corresponded to the average sub-200
nm HOAMF for GoMACCS. The end result for calculated
CCN concentrations and percent under- and overestimation of CCN concentrations is shown in Fig. 6.
Several assumptions made in this analysis warrant further
discussion. Assuming that the HOAMF represents the
insol-uble mass fraction requires assuming not only that the mea-sured HOA was insoluble but that all other chemical compo-nents present were fully or highly soluble. As stated above, the mass spectrum of HOA is characteristic of long chain hydrocarbons and is similar to spectra measured for fresh ve-hicle exhaust and lubricating oil. Based on this information, assuming that HOA is insoluble is reasonable. Furthermore, this assumption is supported by Petzold et al. (2005) who, based on measurements of combustion particles generated in a gas turbine engine, concluded that carbonaceous particles are very poor CCN. Furthermore, Saxena et al. (1995) re-ported that for urban aerosol, organic compounds decrease water adsorption by the inorganic fraction of the aerosol which, presumably, would lead to fewer particles being acti-vated to CCN. Finally, based on simultaneous measurements of the hygroscopic growth factor and HOA mass concentra-tion, Cubison et al. (2006) reported that fresh, urban aerosol emissions dominated by HOA are virtually insoluble.
The difference between the HOAMF and Dc relationship
and the POM mass fraction and Dc relationship shown
in Table 1 indicates that the HOA measured during Go-MACCS had chemical properties different from the bulk
POM aerosol. The result of the factor analysis (Dc being
proportional to the HOAMFand inversely proportional to the
sulfate and OOA mass fractions) indicates a similarity be-tween the solubility of OOA and sulfate while HOA was dis-tinctly different. Finally, measurements of marine aerosol
when HOAMFwere near zero and Dc values were near that
of (NH4)2SO4 (Fig. 5 – Gulf-Southerly Flow) indicate that
highly soluble aerosol was encountered during the experi-ment.
This analysis only includes composition effects on CCN activation that are associated with the fraction of insoluble
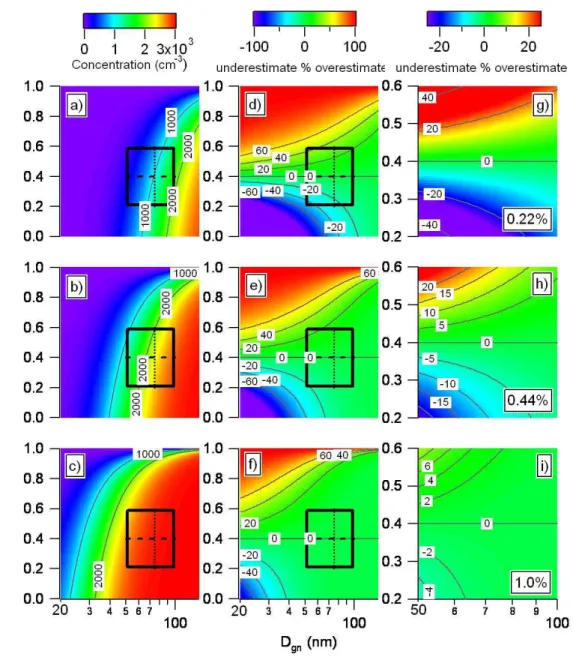
Figure 6. Left panel shows calculated CCN concentrations based on a matrix of
number-mean diameters ranging from 20 to 140 nm and insoluble mass fractions ranging from 0
σ
Fig. 6. Left panel shows calculated CCN concentrations based on a matrix of number-mean diameters ranging from 20 to 140 nm and
insoluble mass fractions ranging from 0 to 1 at (a) S=0.22%, (b) S=0.44%, and (c) S=1.0%. The superimposed box represents the variability in HOA mass fraction and mean diameter observed during GoMACCS (average ±1σ standard deviation over the whole experiment). Mean HOAMFof 0.4 is shown as the dashed line and mean Dgnof 75 nm is shown as the dotted line. Center panel shows the percent under- and
overestimation of the CCN concentration due to neglecting the variability in the HOAMFobserved during GoMACCS for (d) S=0.22%, (e)
S=0.44%, and (f) S=1.0%. Plots were constructed by taking the difference between a matrix where the insoluble fraction was made constant
at 0.4 for all diameters and a matrix where the insoluble mass fraction varied from 0 to 1 at each diameter. Right panel is the same but showing only the GoMACCS box for (g) S=0.22%, (h) S=0.44%, and (i) S=1.0%.
material in the aerosol. In principle, the model could be modified to include chemical effects such as surface tension changes. However, the lack of surface tension data for the complex composition and mixture of atmospheric aerosol en-countered would make the resulting calculations highly un-certain and would not necessarily improve the result.
The combined effects of HOA mass fraction, mean diam-eter, and supersaturation on calculated CCN concentrations
are shown in Fig. 6a–c. As expected, relatively few particles are activated to form CCN for small diameter aerosol with a large insoluble mass fraction. Conversely, most particles are activated to form CCN for large aerosol that is composed pri-marily of soluble species. Also as expected, as S increases, only the smallest particles with the smallest insoluble frac-tion remain unactivated.
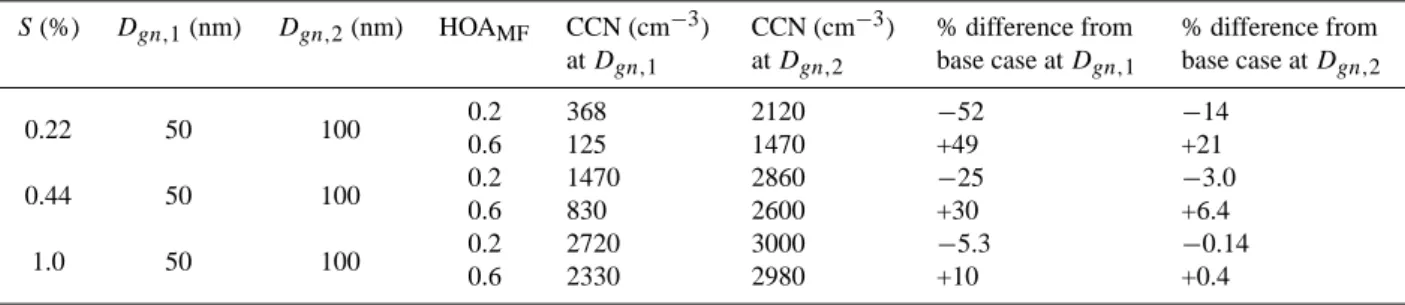
Table 2. Calculated CCN concentrations at three supersaturations for mean diameters of 50 and 100 nm and HOAMFof 0.2 and 0.6. Also
shown is the percent under- or overestimate of CCN concentrations for HOAMFof 0.2 and 0.6 relative to the base case of HOAMF=0.4.
S (%) Dgn,1(nm) Dgn,2(nm) HOAMF CCN (cm−3) at Dgn,1 CCN (cm−3) at Dgn,2 % difference from base case at Dgn,1 % difference from base case at Dgn,2 0.22 50 100 0.2 368 2120 −52 −14 0.6 125 1470 +49 +21 0.44 50 100 0.2 1470 2860 −25 −3.0 0.6 830 2600 +30 +6.4 1.0 50 100 0.2 2720 3000 −5.3 −0.14 0.6 2330 2980 +10 +0.4
Superimposed on Fig. 6d–e is a box (shown expanded in Fig. 6g–h) representing the range of composition and mean diameters observed during GoMACCS. Combining the mea-sured variability with the model output allows the calcu-lated CCN concentrations and percent under- and overesti-mation in calculated CCN concentrations due to neglecting
the observed variability in HOAMFto be put into “real-world
space”. The box representing GoMACCS observed variabil-ity is based on the standard deviation (1σ ) of the mean of
the HOAMF and Dgn averaged over the entire experiment.
Hence, it is a conservative estimate of the variability and does not include the full range of values observed. The modeled CCN concentrations and percent under- and overestimation in calculated CCN concentrations for each corner of the
Go-MACCS box relative to the base case of an HOAMF of 0.4
are reported in Table 2.
Calculated CCN concentrations corresponding to the
range of observed variability in HOAMF (insoluble mass
fraction) are a strong function of supersaturation and mean diameter (Fig. 6a–c and Table 1). Figure 6a shows that, for
S=0.22% and Dgn=50 nm, an increase in the HOAMF from
0.2 to 0.6 results in a decrease in CCN concentration from
368 to 125 cm−3or a decrease of 66%. In contrast, Fig. 6c
shows that for S=1.0% and Dgn=50 nm, the same increase
in HOAMFresults in a decrease in the CCN concentration of
only 14%. At S=0.22 and 1.0% and Dgn=100 nm, the change
in HOAMFfrom 0.2 to 0.6 results in a decrease in CCN
con-centration of 31 and <1%, respectively. Figure 6d–f shows the percent under- and overestimation in calculated CCN
concentrations due to neglecting the variability in HOAMF
(insoluble mass fraction) observed during GoMACCS. The GoMACCS box is superimposed on Fig. 6d–f and expanded and plotted full-scale in Fig. 6g–i. At S=0.22% and a mean
Dgnof 50 nm, an increase in the HOAMFfrom the base case
of 0.4 to the +1σ standard deviation of 0.6 results in an over-estimation of the CCN concentration by 49% (Table 1). A decrease to the −1σ standard deviation of 0.2 results in an underestimation of 52%.For the same supersaturation but a
mean Dgnof 100 nm, an increase in the HOAMFfrom 0.4 to
0.6 results in a 21% overestimation in the CCN
concentra-tion while a decrease from 0.4 to 0.2 results in a 14%
under-estimation. At S=1.0%, the same changes in HOAMFresult
in minimal under- or overestimates in the CCN concentra-tion of ≤10%. Overall, for the variability in composiconcentra-tion observed during GoMACCS, the impact on the calculated CCN concentration of neglecting the variability in the
ob-served HOAMFis significant for S=0.44% and lower.
3.4 Calculated CCN concentrations as a function of aerosol
history
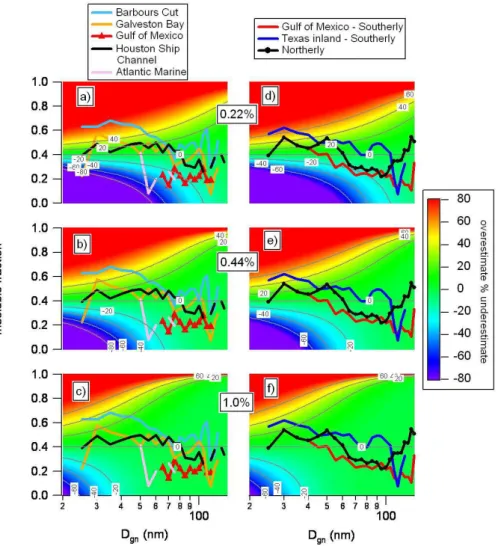
A more detailed presentation of data from GoMACCS is shown superimposed on the modeled percent under- and overestimation of CCN concentration plots in Fig. 7. Here,
average mean Dgnvalues are plotted versus HOAMFfor the
specific geographical sampling locations and for the three
wind-radon regimes. The lowest HOAMF and largest
sub-200 nm mean diameters correspond to the Atlantic Marine and Gulf of Mexico sampling locations as well as the Gulf-Southerly Flow wind-radon regime. Aerosol in each of these cases was sampled away from continental anthropogenic sources and had a sub-200 nm composition dominated by
sulfate and/or OOA; the HOAMF was less than 0.2 at some
diameters. At S=0.22%, the percent underestimation in cal-culated CCN concentrations relative to the base case of an
HOAMF(insoluble mass fraction) of 0.4 ranged from greater
than 60% for Atlantic Marine to between 20 and 40% for the Gulf of Mexico and Gulf-Southerly Flow regime.
By comparison, model CCN concentrations were overes-timated for sampling locations next to continental anthro-pogenic sources (Barbours Cut, Galveston Bay, Houston Ship Channel). In addition, CCN concentrations were over-estimated for the Inland-Southerly Flow regime, where the aerosol was a result of local industrial and urban sources and background Gulf of Mexico aerosol, and for the Northerly Flow regime which was impacted by both near and
dis-tant anthropogenic sources. The highest HOAMF were
ob-served at Barbours Cut and during the Inland-Southerly Flow regime for mean diameters less than 60 nm. As a result, CCN concentrations were overestimated by greater than 60%. For
Figure 7. The percent under- and overestimation of the CCN concentration due to
Fig. 7. The percent under- and overestimation of the CCN concentration due to neglecting the variability in the HOAMF observed during
GoMACCS for S=0.22%, S=0.44%, and S=1.0%. Plots were constructed by taking the difference between a matrix where the insoluble fraction was made constant at 0.4 for all diameters and a matrix where the insoluble mass fraction varied from 0 to 1 at each diameter. Superimposed on the figure is the average Dgnversus HOAMF for the geographic locations (left panel) and wind-radon regimes (right
panel).
larger mean diameters (between 70 and 120 nm), the HOAMF
was still sufficiently large relative to the base case value of 0.4 to result in an overprediction of CCN concentrations up to 20%.
4 Conclusions
The mass fraction of HOA in the Dvaero<200 nm size range
was used to represent the observed variability in chemical composition during GoMACCS and to assess the sensitivity of CCN activation to composition. For sampling locations impacted by urban, industrial, and marine vessel emissions, HOA dominated the mass in the sub-200 nm size range. A
re-gression of the sub-200 nm HOAMF versus critical diameter
for all measurements made at 0.44% S resulted in an r2value
of 0.4 indicating that HOA could explain 40% of the variance
in Dc. An increase in the HOAMFfrom 0 to 1 corresponded
to an increase in Dcof 40 nm.
Model calculations, which assumed that HOA was com-pletely insoluble, were performed to determine the percent under- or overestimation in the calculated CCN
concentra-tion if the variability in the HOAMF observed during
Go-MACCS were neglected. The mean HOAMFover the entire
experiment was 0.4 with a 1σ standard deviation of ±0.2. At a mean diameter of 50 nm and a supersaturation of 0.22%, neglecting the 1σ standard deviation resulted in an under- or overestimation of the CCN concentration of about 50%. Per-cent overestimations of CCN conPer-centrations were largest for aerosol sampled from inland locations in close proximity to
anthropogenic sources due to higher HOAMF but still
con-siderable for aerosol sampled further offshore in the Gulf of Mexico.
The calculations presented here did not include other chemical effects of the HOA on CCN activation (e.g., sur-face tension) due to a lack of information about the chemical properties of the HOA. They were able, however, to indicate the importance of considering the unique composition of the sub-200 nm size range which is the size range where chemi-cal effects are most pronounced in CCN activation and where the majority of the observed HOA is found. In addition, the unique combination of measurements and model calculations presented here serve to relate errors in CCN calculations to observed variability in aerosol composition and size. Further measurements of the chemical composition in this size range and in different geographical regions are required to refine the calculations presented here.
Acknowledgements. This work was supported by the NOAA
Climate Program Office, the NOAA Health of the Atmosphere Program, and the Texas Air Quality Study. We thank D. Hamilton, J. Johnson, K. Schulz, C. Hoyle and the officers and crew of the
Ronald H. Brown for logistical, technical, and scientific support.
This is PMEL contribution number 3136.
Edited by: J. Curtius
References
Abdul-Razzak, H. and Ghan, S. J.: A parameterization of aerosol activation 3. Sectional representation, J. Geophys. Res., 107(D3), 4026, doi:10.1029/2001JD000483, 2002.
Alfarra, M. R., Coe, H., Allan, J. D., et al.: Characterization of ur-ban and rural organic particulate matter in the lower Fraser valley using two Aerodyne mass spectrometers, Atmos. Environ., 38, 5745–5758, 2004.
Allan, J. D., Alfarra, M. R., Bower, K. N., et al.: Quanti-tative sampling using an Aerodyne aerosol mass spectrome-ter. Part 2: Measurements of fine particulate chemical com-position in two UK cities, J. Geophys. Res., 108, 4091, doi:410.1029/2002JD002359, 2003.
Bates, T. S., Coffman, D. J., Covert, D. S., and Quinn, P. K.: Re-gional marine boundary layer aerosol size distributions in the In-dian, Atlantic and Pacific Oceans: A comparison of INDOEX measurements with ACE-1, ACE-2, and Aerosols99, J. Geophys. Res., 107(D19), 8026, doi:10.1029/2001JD001174, 2002. Bates, T. S., Quinn, P. K., Coffman, D. J., et al.: Marine boundary
layer dust and pollutant transport associated with the passage of a frontal system over eastern Asia, J. Geophys. Res., 109, D19S19, doi:10.1029/2003JD004094, 2004.
Berner, A., Lurzer, C., Pohl, F., Preining, O., and Wagner, P.: The size distribution of the urban aerosol in Vienna, Sci. Total Envi-ron., 13, 245–261, 1979.
Boudries, H., Canagaratna, M. R., Jayne, J. T., et al.: Chemical and physical processes controlling the distribution of aerosols in the Lower Fraser Valley, Canada during the PACIFIC 2001 field campaign, Atmos. Environ., 38, 5759–5774, 2004.
Canagaratna, M. R., Jayne, J. T., Ghertner, D. A., et al.: Chase stud-ies of particulate emissions from in-use New York city vehicles, Aerosol Sci. Tech., 38, 555–573, 2004.
Canagaratna, M. R., Jayne, J. T., Jimenez, J. L., et al.: Chemical and microphysical characterization of ambient aerosols with the Aerodyne Aerosol Mass Spectrometer, Mass Spectrom. Rev., 26, 185–222, 2007.
Corrigan, C. E. and Novakov, T.: Cloud condensation nucleus activ-ity of organic compounds: a laboratory study, Atmos. Environ., 33, 2661–2668, 1999.
Cubison, M. J., Alfarra, M. R., Allan, J., Bower, K. N., Coe, H., McFiggans, G. B., Whitehead, J. D., Williams, P. I., Zhang, Q., Jimenez, J. L., Hopkins, J., and Lee, J.: The characterisation of pollution aerosol in a changing photochemical environment, Atmos. Chem. Phys., 6, 5573–5588, 2006,
http://www.atmos-chem-phys.net/6/5573/2006/.
Drewnick, F., Schwab, J. J., Jayne, J. T., Canagaratna, M., Worsnop, D. R., and Demergian, K. L.: Measurement of ambient aerosol composition during the PMTACS-NY 2001 using an Aerosol Mass Spectrometer, Part II: Chemically speciated mass distribu-tions, Aerosol Sci. Tech., 38, 104–117, 2004.
Dusek, U., Frank, G. P., Hildebrandt, L., et al.: Size matters more than chemistry for cloud-nucleating ability of aerosol particles, Science, 312, 1375–1376, 2006.
Ervens, B., Feingold, G., and Kreidenweis, S. M.: The influence of water-soluble organic carbon on cloud drop number concentra-tion, J. Geophys. Res., 110, 18211, doi:10.1029/2004JD005634, 2005.
Feingold, G.: Modeling of the first indirect effect: Analysis of measurement requirements, Geophys. Res. Lett., 30, 1997, doi:10.1029/2003GL017967, 2003.
Fitzgerald, J. W. and Hoppel, W. A.: Equilibrium size of atmo-spheric aerosol particles as a function of relative humidity: Cal-culations based on measured aerosol properties, in: Hygroscopic Aerosols, edited by: Ruhnke, L. H. and Deepak, A., A. Deepak, Hampton, VA, 21–34, 1984.
Fountoukis, C. and Nenes, A.: Continued development of a cloud droplet formation parameterization for global climate models, J. Geophys. Res., 110, 11212, doi:10.1029/2003JD004324, 2005. Hudson, J.: Variability of the relationship between particle size
and cloud-nucleating ability, Geophys. Res. Lett., 34, L08801, doi:10.1029/2006GL028850, 2007.
Huffman, J. A., Jayne, J. T., Drewnick, F., Aiken, A. C., Onasch, T., Worsnop, D. R., and Jimenez, J. L.: Design, Modeling, Op-timization, and Experimental Tests of a Particle Beam Width Probe for the Aerodyne Aerosol Mass Spectrometer, Aerosol Sci. Tech., 39, 1143–1163, 2005.
IPCC (Intergovernmental Panel on Climate Change): Radiative forcing of climate change, in Climate Change 2001, Cambridge Univ. Press, New York, Cambridge University Press, 2001. IPCC (Intergovernmental Panel on Climate Change): Changes in
Atmospheric Constituents and in Radiative Forcing, in: The IPCC 4th Assessment Report, 2007.
Lance, S., Medina, J., Smith, J. N., and Nenes, A.: Mapping the operation of the DMT continuous flow CCN counter, Aerosol Sci. Tech., 40, 242–254, 2006.
Maßling, A., Wiedensohler, A., Busch, B., Neusuß, C., Quinn, P., Bates, T., and Covert, D.: Hygroscopic properties of different aerosol types over the Atlantic and Indian Oceans, Atmos. Chem. Phys., 3, 1377–1397, 2003,
http://www.atmos-chem-phys.net/3/1377/2003/.
C., Feingold, G., Fuzzi, S., Gysel, M., Laaksonen, A., Lohmann, U., Mentel, T. F., Murphy, D. M., O’Dowd, C. D., Snider, J. R., and Weingartner, E.: The effect of physical and chemi-cal aerosol properties on warm cloud droplet activation, Atmos. Chem. Phys., 6, 2593–2649, 2006,
http://www.atmos-chem-phys.net/6/2593/2006/.
Mircea, M., Facchini, M. C., Decesari, S., Fuzzi, S., and Charlson, R. J.: The influence of the organic aerosol component on CCN supersaturation spectra for different aerosol types, Tellus B, 54, 74–81, 2002.
Nenes, A., Charlson, R. J., Facchini, M. C., Kulmala, M., Laak-sonen, A., and Seinfeld, J. H.: Can chemical effects on cloud droplet number rival the first indirect effect?, Geophys. Res. Lett., 29, 1848, doi:10.1029/2002GL015295, 2002.
Petzold, A., Gysel, M., Vancassel, X., Hitzenberger, R., Puxbaum, H., Vrochticky, S., Weingartner, E., Baltensperger, U., and Mirabel, P.: On the effects of organic matter and sulphur-containing compounds on the CCN activation of combustion par-ticles, Atmos. Chem. Phys., 5, 3187–3203, 2005,
http://www.atmos-chem-phys.net/5/3187/2005/.
Quinn, P. K., Coffman, D. J., Bates, T. S., Miller, T. L., Johnson, J. E., Welton, E. J., Neus¨uss, C., Miller, M., and Sheridan, P.: Aerosol optical properties during INDOEX 1999: Means, vari-abilities, and controlling factors, J. Geophys. Res., 107(D19), 8020, doi:10.1029/2000JD000037, 2002.
Quinn, P. K., Coffman, D. J., Bates, T. S., Welton, E. J., Covert, D. S., Miller, T. L., Johnson, J. E., Maria, S., Russell, L., Ari-moto, R., Carrico, C. M., Rood, M. J., and Anderson, J.: Aerosol Optical Properties Measured Onboard the Ronald H. Brown During ACE Asia as a Function of Aerosol Chemical Com-position and Source Region, J. Geophys. Res., 109, D19S01, doi:10.1029/2003JD004010, 2004.
Roberts, G. C. and Nenes, A.: A continuous-flow streamwise thermal gradient CCN chamber for atmospheric measurements, Aerosol Sci. Tech., 39, 206–221, 2005.
Rogers, R. R. and Yau, M. K.: A Short Course in Cloud Physics, Elsevier, New Yori, 1989.
Saxena, P., Hildemann, L. M., McMurry, P. H., and Seinfeld, J. H.: Organics alter hygroscopic behavior of atmospheric particles, J. Geophys. Res., 100, 18 755–18 770, 1995.
Schneider, J., Hock, N., Weimer, S., Borrmann, S., Kirchner, R., Vogt, R., and Scheer, V.: Nucleation particles in diesel exhaust: Composition inferred from in situ mass spectrometric analysis, Environ. Sci. Tech., 39, 6153–6161, 2005.
Shantz, N. C., Leaitch, W. R., and Caffrey, P. F.: Effect of organics of low solubility on the growth rate of cloud droplets, J. Geophys. Res., 108, 4168, doi:10.1029/2002JD002540, 2003.
Stratmann, F. and Wiedensohler, A.: A new data inversion algo-rithm for DMPS measurements, J. Aerosol Sci., 27, 339–340, 1997.
Twomey, S.: The influence of pollution on the shortwave albedo of clouds, J. Atmos. Sci., 34, 1149–1152, 1977.
Whittlestone, S. and Zahorowski, W.: Baseline radon detectors for shipboard use: Development and deployment in the First Aerosol Characterization Experiment (ACE 1), J. Geophys. Res., 103, 16 743–16 751, 1998.
Winklmeyer, W., Reischl, G. P., Lindner, A. O., and Berner, A.: New electromobility spectrometer for the measurement of aerosol size distributions in the size range 1 to 1000 nm, J. Aerosol Sci., 22, 289–296, 1991.
Zhang, Q., Alfarra, M. R., Worsnop, D. R., Allan, J. D., Coe, H., Canagaratna, M. R., and Jimenez, J. L.: Deconvolution and quan-tification of hydrocarbon-like and oxygenated organic aerosols based on aerosol mass spectrometry, Environ. Sci. Tech., 39, 4938–4952, doi:10.1021/es0485681, 2005a.
Zhang, Q., Worsnop, D. R., Canagaratna, M. R., Jayne, J. T., and Jimenez, J. L.: Hydrocarbon-like and oxygenated organic aerosols in Pittsburgh: Insights into sources and processes of or-ganic aerosols, Atmos. Chem. Phys., 5, 3289–3311, 2005b.