HAL Id: hal-02898123
https://hal.archives-ouvertes.fr/hal-02898123
Submitted on 13 Jul 2020
HAL is a multi-disciplinary open access
archive for the deposit and dissemination of
sci-entific research documents, whether they are
pub-lished or not. The documents may come from
teaching and research institutions in France or
abroad, or from public or private research centers.
L’archive ouverte pluridisciplinaire HAL, est
destinée au dépôt et à la diffusion de documents
scientifiques de niveau recherche, publiés ou non,
émanant des établissements d’enseignement et de
recherche français ou étrangers, des laboratoires
publics ou privés.
Ongoing flyby in the young multiple system UX Tauri
F. Menard, Nicolas Cuello, C. Ginski, G. van der Plas, M. Villenave, J.-F
Gonzalez, C. Pinte, M. Benisty, A. Boccaletti, D. Price, et al.
To cite this version:
F. Menard, Nicolas Cuello, C. Ginski, G. van der Plas, M. Villenave, et al.. Ongoing flyby in the
young multiple system UX Tauri. Astronomy and Astrophysics - A&A, EDP Sciences, 2020, 639,
pp.L1. �10.1051/0004-6361/202038356�. �hal-02898123�
https://doi.org/10.1051/0004-6361/202038356 c F. Ménard et al. 2020
Astronomy
&
Astrophysics
L
ETTER TO THEE
DITOROngoing flyby in the young multiple system UX Tauri
?
F. Ménard
1, N. Cuello
1,2,3, C. Ginski
4,5, G. van der Plas
1, M. Villenave
1,6, J.-F. Gonzalez
3, C. Pinte
7,1, M. Benisty
1,
A. Boccaletti
8, D. J. Price
7, Y. Boehler
1, S. Chripko
9, J. de Boer
5, C. Dominik
4, A. Garufi
10, R. Gratton
11,
J. Hagelberg
12, Th. Henning
13, M. Langlois
3, A. L. Maire
14,13, P. Pinilla
13, G. J. Ruane
15, H. M. Schmid
16,
R. G. van Holstein
5,6, A. Vigan
17, A. Zurlo
17,18,19, N. Hubin
20, A. Pavlov
13, S. Rochat
1,
J.-F. Sauvage
21,17, and E. Stadler
11 Univ. Grenoble Alpes, CNRS, IPAG, 38000 Grenoble, France
e-mail: [email protected]
2 Instituto de Astrofísica, Pontificia Universidad Católica de Chile, Santiago, Chile
3 Univ Lyon, Univ Claude Bernard Lyon1, Ens de Lyon, CNRS, Centre de Recherche Astrophysique de Lyon UMR5574, 69230
Saint-Genis-Laval, France
4 Sterrenkundig Instituut Anton Pannekoek, Science Park 904, 1098 XH Amsterdam, The Netherlands 5 Leiden Observatory, Leiden University, PO Box 9513, 2300 RA Leiden, The Netherlands
6 European Southern Observatory, Alonso de Córdova 3107, Casilla 19001 Vitacura, Santiago, Chile 7 School of Physics and Astronomy, Monash University, Clayton, Vic 3800, Australia
8 LESIA, Observatoire de Paris, Université PSL, CNRS, Sorbonne Université, Univ. Paris Diderot, Sorbonne Paris Cité, 5 place
Jules Janssen, 92195 Meudon, France
9 CECI, Université de Toulouse, CNRS, CERFACS, Toulouse, France
10 INAF, Osservatorio Astrofisico di Arcetri, Largo Enrico Fermi 5, 50125 Firenze, Italy 11 INAF, Osservatorio Astronomico di Padova, Vicolo dell’Osservatorio 5, 35122 Padova, Italy 12 Geneva Observatory, University of Geneva, Chemin des Mailettes 51, 1290 Versoix, Switzerland 13 Max Planck Institute for Astronomy, Königstuhl 17, 69117 Heidelberg, Germany
14 STAR Institute, Université de Liège, Allée du Six Août 19c, 4000 Liège, Belgium
15 Jet Propulsion Laboratory, California Institute of Technology, 4800 Oak Grove Dr., Pasadena, CA 91109, USA 16 Institute for Particle Physics and Astrophysics, ETH Zurich, Wolfgang-Pauli-Strasse 27, 8093 Zurich, Switzerland 17 Aix Marseille Université, CNRS, CNES, LAM, Marseille, France
18 Núcleo de Astronomía, Facultad de Ingeniería y Ciencias, Universidad Diego Portales, Av. Ejercito 441, Santiago, Chile 19 Escuela de Ingeniería Industrial, Facultad de Ingeniería y Ciencias, Universidad Diego Portales, Av. Ejercito 441, Santiago, Chile 20 European Southern Observatory (ESO), Karl-Schwarzschild-Str. 2, 85748 Garching, Germany
21 DOTA, ONERA, Université Paris Saclay, 91123 Palaiseau, France
Received 5 May 2020/ Accepted 1 June 2020
ABSTRACT
We present observations of the young multiple system UX Tauri to look for circumstellar disks and for signs of dynamical interactions. We obtained SPHERE/IRDIS deep differential polarization images in the J and H bands. We also used ALMA archival CO data. Large extended spirals are well detected in scattered light coming out of the disk of UX Tau A. The southern spiral forms a bridge between UX Tau A and C. These spirals, including the bridge connecting the two stars, all have a CO (3–2) counterpart seen by ALMA. The disk of UX Tau C is detected in scattered light. It is much smaller than the disk of UX Tau A and has a major axis along a different position angle, suggesting a misalignment. We performed
Phantom
SPH hydrodynamical models to interpret the data. The scattered light spirals, CO emission spirals and velocity patterns of the rotating disks, and the compactness of the disk of UX Tau C all point to a scenario in which UX Tau A has been perturbed very recently (∼1000 years) by the close passage of UX Tau C.Key words. protoplanetary disks – circumstellar matter – stars: pre-main sequence – binaries: general
1. Introduction
Star formation occurs in molecular clouds where the stellar den-sity is higher than in the field and the probability for encounters and dynamical interactions is enhanced. The presence of other stars in the vicinity of a forming young stellar and planetary sys-tem can dramatically affect the disk morphology and evolution (Pfalzner 2003;Vincke et al. 2015;Bate 2018).
The probability of a system to undergo a flyby decreases rapidly with time in a stellar association in unison with the stellar density, which decreases with cluster expansion. During the first
?
Movies associated to Fig. 3 are available at
https://www.aanda.org
million years of a stellar cluster,Pfalzner(2013) andWinter et al. (2018a) estimated that the probability of a stellar encounter can be on the order of 30% for solar-type stars, a flyby being defined in this case as a single passage within 100–1000 au. These calcu-lations assumed a background stellar density that is larger than in Taurus. In Taurus the stellar density is low (1–10 stars pc−3)
and at first sight the flyby rate would be equivalently low. How-ever, the stellar distribution in Taurus is patchy; several denser groups have been identified in Taurus (e.g.,Joncour et al. 2018) and there is a higher probability that encounters might happen in these groups.
Clarke & Pringle (1993) considered coplanar parabolic
encounters between equal-mass stars with periastron separations
Open Access article,published by EDP Sciences, under the terms of the Creative Commons Attribution License (https://creativecommons.org/licenses/by/4.0),
A&A 639, L1 (2020)
on the order of the initial disk size and found that prograde encounters were the most destructive. These prograde encoun-ters tidally truncate the disk and unbind material that is either captured by the perturber or escapes (Breslau et al. 2017). Ret-rograde encounters, on the contrary, were found to be much less perturbative. More recently,Cuello et al.(2019) showed through hydrodynamical simulations – including dust and gas – that the solids within the disk react differently than the gas to the per-turbation because of gas drag and radial drift. This dynamical effect renders the gas spirals rich in micron-sized grains (well coupled to the gas) and hence detectable in scattered light. In addition, the disk seen in thermal emission is expected to be more compact since larger grains are more prone to radial drift (Weidenschilling 1977). The detailed observational signatures of these flyby models – obtained through radiative transfer post-processing – can be found inCuello et al.(2020).
Only a few cases of flybys have been observed so far: RW Aur (Dai et al. 2015), HV Tau and DO Tau (Winter et al. 2018b), and AS 205 (Kurtovic et al. 2018).Zapata et al.(2020) recently suggested that UX Tauri might also be the site of dynamical interactions. In this Letter we present SPHERE images of the UX Tauri multiple system. Supported by tailored hydrodynami-cal simulations, the new data strongly favors a recent passage of UX Tauri C near UX Tauri A, whose disk is still being perturbed. The UX Tauri system includes four T Tauri stars. It is located in the Taurus molecular cloud at d = 147 ± 2 pc (Gaia
Collaboration 2018). This system consists of a primary star
(UX Tau A) and two companions: UX Tau B at ∼500. 8 to the west
and UX Tau C at ∼200. 7 to the south of the primary. UX Tau B
is itself a tight (∼000. 1) binary (e.g.,Duchêne 1999;Correia et al.
2006; Schaefer et al. 2014).Kraus & Hillenbrand (2009) esti-mated the stellar masses at 1.3±0.4 M for A and 0.16±0.04 M
for C. Zapata et al.(2020) report dynamical masses from CO data: 1.4 ± 0.6 M for A, and (0.067 ± 0.029/ sin i) M for C. So
far only the disk of UX Tau A has been detected.Andrews et al. (2011), using the Submillimeter Array (SMA), resolved an inner cavity around the central star extending to a radius of 25 au: the dust disk is a ring at 880 µm.Tanii et al.(2012) resolved the disk at H band with SUBARU/HiCIAO in polarized intensity and detected scattered light emission all the way to the coronagraphic mask, that is, down to r= 000. 15 or r = 22 au. Unfortunately, the
coronagraphic mask has a size similar to the millimeter-emission cavity and it is not known whether small dust (detectable in scat-tered light) is present in the millimeter cavity or not. The shape of the spectral energy distribution however led Espaillat et al. (2007) to identify UX Tau A as a so-called pre-transition disk, that is, a disk that shows a slight near-infrared (NIR) excess and significant excesses in the mid- and far-infrared. Interestingly, a SpitzerIRS spectrum revealed the absence of any silicate feature emission at 10 µm (Espaillat et al. 2010), also implying a lack of small hot silicate dust grains in the disk.
In Sect.2 we present new SPHERE high-contrast corona-graphic images and archival ALMA data. In Sect.3we present hydrodynamical models of the gravitational interaction in the UX Tauri A–C system. In Sect.4we discuss the data and model results and their implications for the disk structure and evolution. In Sect.5we summarize our findings.
2. Observations and results
2.1. Near-infrared high-contrast imaging with SPHERE We obtained three different NIR differential polarization imag-ing data sets (DPI; see van Holstein et al. 2020;de Boer et al. 2020) with the IRDIS camera (Dohlen et al. 2008) of SPHERE
1.0 0.5 0.0 0.5 1.0 RA (arcsec) 1.0 0.5 0.0 0.5 1.0 DE C (a rc se c) 100 101 102
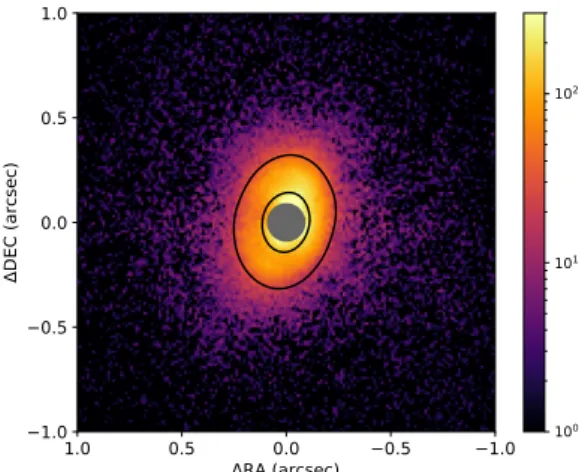
Fig. 1.Qφ, J-band (linearly) polarized intensity image of the disk of
UX Tau A, shown in logarithmic scale. The intensity scale is in arbitrary detector units, levels below 1 (i.e., ∼2.5 times the rms noise level at ≥100
) are set to black. The gray circle traces the 185 mas coronagraphic mask. The continuum ring detected by ALMA (see Fig.B.2, left insert) is shown in black contours traced at 60% of the ALMA continuum peak level.
(Beuzit et al. 2019). Two data sets were obtained in the broad-band H filter (as part of the GO program 0100.C-0452; PI Benisty) and one was taken in the J band (as part of the SPHERE DISK GTO program 096.C-0248). The H-band data were taken on 2017 October 6 and 12, the J-band data on 2015 Decem-ber 18. The final data reduction was performed with the IRDAP pipeline1presented invan Holstein et al.(2020). The data reduc-tion process is described in detail in the same paper.
The disks of UX Tau A and UX Tau C are both resolved in the J and H bands. Figure1shows the J-band polarized inten-sity image of UX Tau A in color, with the ALMA continuum ring overlayed in black contours. The SPHERE image shows that the disk is brighter on the western side, suggesting this is the front side, facing us. This is a natural consequence of the forward-scattering phase function of the grains at the disk sur-face. This implies, coupled with the velocity gradient presented in Appendix B, that the disk is rotating counter-clockwise as seen by the observer. The compact disk of UX Tau C is shown in Fig.A.1.
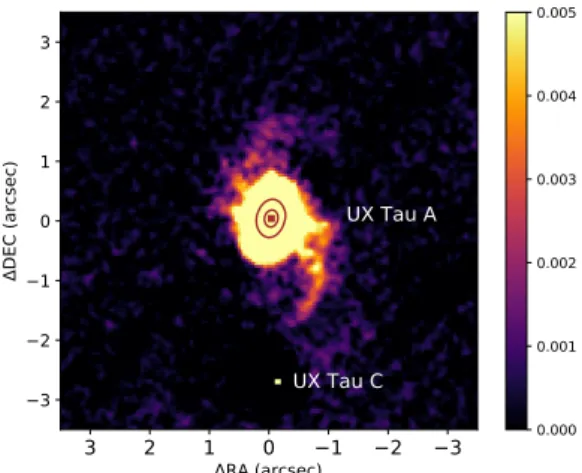
Figure2shows a deep rendering of the close environment of UX Tau A. The disk is the bright saturated yellow patch at the center. Two spirals are clearly visible emerging from the disk: one toward the north and one toward the south. The locations of UX Tau A and C are indicated. UX Tau C has a projected separation of 2.7000± 0.0200at PA= 181.5◦± 1.0◦ (east of north;
this is the convention throughout the paper). The southern spiral extends toward UX Tau C, creating a bridge between UX Tau A and C, which is immediately suggestive of a dynamical interac-tion. We note, critically, that the two spirals are detected in each individual data set, although at lower signal-to-noise ratio (S/N). 2.2. ALMA archival data
ALMA CO observations of UX Tauri were presented inFrancis & van der Marel(2020) andZapata et al.(2020). We used the same data set. The data reduction procedure and the main results are presented in AppendixB. We highlight the main results in Fig.B.1. Disks are detected around both stars and a comparison with Fig.2immediately reveals the correspondence between the scattered light and CO spirals. This is discussed in Sect.4.1 1 https://irdap.readthedocs.io
3 2 1 0 1 2 3 RA (arcsec) 3 2 1 0 1 2 3 DE C (a rc se c) UX Tau A UX Tau C 0.000 0.001 0.002 0.003 0.004 0.005
Fig. 2. J- and H-band combined image. The native image (12.25 mas px−1) was binned by a factor of 4 and smoothed with a
Gaussian filter of 2 binned pixels. The intensity scale is relative to the peak of the image. The color scale saturates (in yellow) at 0.5% of the peak. The mean signal in the southern spiral is detected at 3.9σ above background in the binned images, before smoothing. For comparison, the dust ring seen by ALMA is overplotted in red, to scale. A different rendering of the spirals in the J band, using a novel de-noising proce-dure (Price et al., in prep.), is presented in Fig.C.1.
3. Hydrodynamical modeling of UX Tau
We now test the hypothesis that the spirals observed in UX Tau A are due to the dynamical response of the disk to a gravitational perturbation by UX Tau C. In the following, we place ourselves in the reference frame of UX Tau A and call UX Tau C the per-turber.
We model the hydrodynamical evolution of the disk around UX Tau A by means of the smoothed particle hydrodynamics (SPH)
Phantom
code (Price et al. 2018a). The disk is mod-eled using 500 000 gas SPH particles and assuming a total disk mass of 0.05 M (Akeson et al. 2019). At the beginning of thecalculation, the disk surface density follows a power-law pro-file Σ ∝ R−1. We further assume that the disk is vertically
isothermal. We adopt a mean Shakura–Sunyaev disk viscosity αSS ≈ 0.005 by setting a fixed artificial viscosity parameter
αAV = 0.25 and using the “disk viscosity” flag of
Phantom
(Lodato & Price 2010). The disk inner and outer radii are ini-tially set to Rin = 10 au and Rout = 60 au. The value of Rin –
although in agreement with the SPHERE and ALMA observa-tions – is not critical in this study since we are interested in the spirals external to the disk. The value of Routis more difficult to
choose a priori because we expect the disk to be truncated as a result of the gravitational interaction with the perturber. There-fore Routshould not be compared directly with the observations.
In order to ease the comparison with the observations, the disk is set with an inclination id = 40◦ and PA= 167◦ before the
perturbation, following the analysis ofFrancis & van der Marel (2020).
There are few observational constraints regarding the orbit of the perturber. This yields a highly degenerate geometry for the multiple system. The projected separation in the plane of the sky between UX Tau C and UX Tau A is known: dC ≈ 400 au
at position angle θC = 181◦, east of north. There is no apparent
motion between A and C in the period 2009–2018 (<000. 05, 7 au).
Lastly, the mass ratio q= MC/MAranges between 0.08 and 0.22
(Kraus & Hillenbrand 2009;Zapata et al. 2020). The systemic velocities measured byZapata et al.(2020) indicate, marginally, that UX Tau C is slowly approaching to us with respect to UX
Tau A (Zapata et al. 2020). In this work, we do not intend to explore the whole orbital parameter space available, but rather to compare two possible scenarios: a bound companion where the orbital eccentricity 0 ≤ e < 1 and a parabolic flyby where e= 1. These runs are labeled B- and F-, respectively. We assume that the orbit of the perturber lies in the plane of the sky. Hence there is an angle of 40◦between the orbit of the perturber and the disk
midplane. The masses of the primary star and the perturber are set to 1.0 M and 0.2 M , for a mass ratio q = 0.2, within the
range given above.
For B-runs, we fix the semimajor axis to 400 au, that is, equal to the current projected distance, and vary the orbital eccen-tricity: e = 0 (B60−e0), e = 0.5 (B60−e05), and e = 0.75 (B60−e075). In addition, we perform a calculation with Rout =
90 au and e = 0.75 (B90−e075) as the most extreme bound orbit. For e = 0.5 and e = 0.75, the distance between the stars at pericenter, Rp, is equal to 200 and 100 au, respectively. The
morphology of the spirals and the location of the perturber in the images suggest that the latter is currently past pericenter (Cuello et al. 2019). We find that an argument of pericenter of ω = −130◦ simultaneously produces a pair of spirals (shortly
after pericenter passage) and the correct current projected sep-aration of 400 au at position angle θC = 181◦. In the plane of
the sky, the pericenter is located at position angle θP = 45◦. We
compute the disk evolution for ten binary orbits. Lower values of Rp produce a disk truncation that is incompatible with the
observations.
For F-runs, we consider prograde flybys with Rp = 100 au
and ω = −130◦ as well. The flybys are non-penetrating since Rp/Rout> 1. However, because this ratio is close to 1, the flybys
trigger a pair of prominent trailing spiral arms, in agreement with the observational data. For comparison, non-penetrating retro-grade flybys with q < 1 are unable to produce such prominent spiral arms (e.g.,Cuello et al. 2019). Since the perturbation that truncates the disk occurs only once, the disk size prior to the encounter can in principle be larger than the observed value. Hence, we compute two simulations, F60-a100 and F90-a100, where Rout = 60 and 90 au. The results, which are presented in
Fig.3and discussed below, strongly favor a stellar flyby over a bound orbit in UX Tau.
4. Discussion
4.1. UX Tau C: Bound companion or flyby
The results of the SPH calculations demonstrate that in B-runs the disk around UX Tau A always becomes heavily truncated after a few orbital periods. The direct observational consequence is that the spirals triggered by UX Tau C would be more tightly wound and less dense compared to those triggered by a flyby. Moreover, since in F-runs the gravitational interaction occurs only once, there is more material available at large disk radii to feed the spirals. During such a close and inclined prograde flyby, a bridge of material is created and remains between both stars for a long time after the passage at pericenter. This bridge should be detectable in deep NIR scattered light observations and deep CO line observations as shown byCuello et al.(2020, see their Fig. 4). This is because micron-sized dust grains are strongly coupled to the gas and are efficiently trapped and dragged along the gas spiral arms.
We observe that in F60−a100 and F90−a100 there is a small fraction of the initial disk that is captured by the perturber. This is an expected dynamical outcome of prograde flybys when Rp
A&A 639, L1 (2020) y [au] -600 -400 -200 0
200 B60-e0: Rout=60 au, e=0 B60-e05: Rout=60 au, e=0.5 B60-e075: Rout=60 au, e=0.75
y [au] x [au] -400 -200 0 200 400 -600 -400 -200 0
200 F60-a100: Rout=60 au, Rp=100 au
x [au]
-400 -200 0 200 400 F90-a100: Rout=90 au, Rp=100 au
x [au]
-400 -200 0 200 400 -1 0 1 2
log column density [g/cm
2]
B90-e075: Rout=90 au, e=0.75
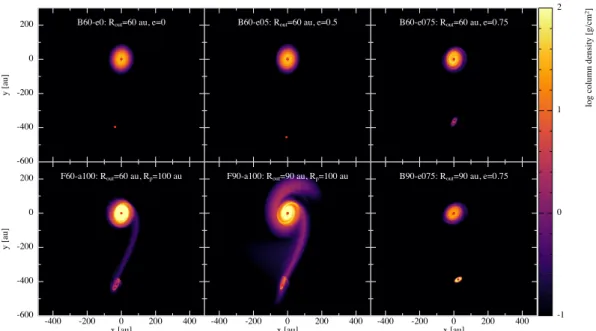
Fig. 3.Gas column density of the disk around UX Tau A being gravitationally perturbed by UX Tau C. The orbit of the perturber is in the plane of the sky and the disk is inclined by 40◦
with PA= 167◦
, as in the observations. The letters F- and B- label flyby and bound orbit models, respectively. The morphology of the spirals and the current projected distance between the stars suggest that UX Tau C is on an unbound orbit. We note that increasing the outer disk radius for a flyby (as in F90-a100) renders the spirals denser and brighter in scattered light, as they capture more disk material. In each panel, the position (separation, PA) and relative motion (proper motion, relative Vrad) of UX Tau C are compatible with
observations. Videos of F90−a100 and B90−e075 are availableonline.
expected to form a disk around the perturber, presumably on an inclined orbital plane compared to the primary disk midplane. This is also seen for B90−e075 and B60−e075 since some mate-rial is stripped from the disk around UX Tau A during the first orbit. However, after a few orbits the spirals become much more tenuous and the bridge disappears.
Interestingly, the velocity gradients observed in the two disks are not along the same position angle (see also Zapata
et al. 2020) and the inclination of UX Tau C, i ≥ 60◦ (see
Appendix A), is significantly different from UX Tau A. The two disks are likely not coplanar. In addition, the peak veloc-ity map (Fig.B.2, right panel) shows that the bridge connecting the two stars overlaps significantly with the scattered light spi-rals of Fig. 2. This kind of kinematics and material exchange is typical of prograde flybys. The presence of a disk around the perturber prior to the flyby cannot be excluded. However, if present, that disk probably had a compact radial extension. Otherwise, given our choice of pericenter, there would be much more disk material scattered all around and the disk of UX Tau C would harbor large spirals. Our simulations are unable to repro-duce the outer spiral located to the southwest (see right panel in Fig.B.2).
The relative orientations of the disks cannot be used safely to infer the origin of the multiple system. If UX Tau C acquired its disk during the flyby, then the disk misalignment is a nat-ural outcome of the three-dimensional interaction (Bate 2018;
Cuello et al. 2020). If UX Tau A, B, and C were born from the
same molecular core, misaligned disks could indicate a turbu-lent formation process (Offner et al. 2016;Bate 2018) or, more likely, trace the effects of dynamical evolution within the sys-tem. Indeed, the perturber is unlikely to come from the larger, low stellar density, Taurus star formation region, but instead is likely to come from within the smaller UX Tau group (already known to contain three other T Tauri stars). A similar conclusion was drawn byWinter et al.(2018b) for DO Tau and HV Tau.
4.2. UX Tau A: Disk inner cavity
At millimeter wavelengths, it is well documented that the disk of UX Tau A has a ringed shape (Andrews et al. 2011; Pinilla et al. 2014).Francis & van der Marel(2020) studied in detail the continuum emission obtained from the same archival data set we used for12CO. Our reduction of the same continuum data is
pre-sented in Fig.B.2, left insert.Francis & van der Marel(2020) modeled a decrease (a jump) in dust surface density in the cavity by a factor in excess of 200, based on the nondetection of mil-limeter flux inside the cavity. We show in Fig.1that NIR scattered light may be marginally detected inside the cavity observed by ALMA. However, these results are not immediately in contradic-tion with those ofFrancis & van der Marel(2020) because small dust particles have low millimeter opacity and because the coro-nagraphic mask used for the SPHERE observations also covers most of the cavity (see Fig.1). Pending a deep non-coronagraphic image that would confirm this, the detection of scattered light inside millimeter cavities is common for transition disks whose cavities are not fully devoid of gas, as is the case here (see Fig.B.2 middle panel and right insert). This is also in agreement with the pre-transition disk nature identified byEspaillat et al.(2010).
Regarding the origin of the inner cavities in transition disks, it is often suggested that they are carved by an inner very low-mass companion. One or several undetected low-low-mass planets could easily create a decrease in the gas surface density, thereby causing large dust particles to remain trapped at the edge of the cavity and explaining the ring shape seen by ALMA; small dust particles, however, may be able to filter into the cavity together with the accreting gas (see, e.g.,Perez et al. 2015;van
der Marel et al. 2018). However, a more massive stellar
com-panion within the cavity can probably be excluded on dynamical grounds since in that case we should see more asymmetries in the dust and in the gas. Similarly, a stellar companion within the cav-ity can potentially trigger prominent spirals arms in protoplane-tary disks, as in, for example, HD 142527 (Price et al. 2018b),
but the radial extent and brightness of the spirals observed in UX Tau A exclude such a dynamical scenario. Therefore, based on our simulations and despite the orbital degeneracy, we con-clude that the disk of UX Tau A is perturbed by a recent flyby by UX Tau C and that UX Tau C is likely on an unbound orbit.
5. Concluding remarks
In this Letter we presented deep scattered light linearly polar-ized intensity images of the disks of UX Tau A and UX Tau C obtained with the SPHERE instrument at the ESO/VLT. Sev-eral features are revealed for the first time by SPHERE. First, two faint and extended scattered light spirals are seen emanat-ing from the outer disk of UX Tau A, propagatemanat-ing outward. The southern spiral points to and extends almost all the way to UX Tau C, which is very suggestive of a tidal bridge between A and C. Second, a faint and compact disk is also resolved around UX Tau C. The ALMA archival 12CO (3–2) line data
show unambiguously that the two spirals seen in scattered light are also detected nicely in the gas emission. The two disks of UX Tau A and C are also detected in CO data, with clear rota-tional signatures. The rotarota-tional velocity gradients of the two disks are misaligned.
To understand the origins of the spirals, SPH hydrodynam-ical simulations were used to examine two hypothesis: one in which UX Tau C is orbiting around UX Tau A in a bound orbit, and one in which UX Tau C is a one-time perturber, having recently flown by UX Tau A on a parabolic orbit. A prograde flyby (e.g., panel F90-a100 in Fig.3) provides an excellent qual-itative match to the ensemble of observations. A bound orbit solution can also provide a decent qualitative match, but only during the first few orbits. That solution produces fainter spirals but, more problematically, requires that we are also seeing the system very early in its evolution because the spirals vanish after a few orbital periods as the disk gets truncated and the loosely bound material is no longer available, having been stripped away during previous passages. The orbital period is of order 7000 yr in our simulations. It is not expected that after 1–2 Myr, the age of UX Tau A, the spirals would still be formed.
In summary, the ensemble of multiwavelength observational constraints available very clearly favors the flyby scenario. All the reported features are also in good qualitative agreement with the dynamical and observational flyby signatures shown in Cuello et al.(2019,2020), in particular the prominent gaseous spirals and the compact dusty disk detected around UX Tau A. We hypothesize that the disk around UX Tau C was formed during the flyby shortly after the passage at pericenter. This would explain why the disk of UX Tau C is detected in CO emission (trac-ing gas) and in scattered light (trac(trac-ing small dust), but remains undetected in the millimeter continuum (tracing larger particles). Cuello et al. (2020, see their Sect. 3.2) reported that flybys in disks where radial drift has had time to sort the large from the small particles would result in the perturber capturing only gas and small dust, leaving the larger particles unaffected. This would be in good agreement with UX Tau. Given the compact size of the disk around UX Tau C, and its relative faintness in CO and scattered light, a deeper ALMA continuum image will be needed to confirm this conjecture. Similarly, the SPH model cannot cur-rently explain the origin of the outermost spiral features seen in CO. No doubt, UX Tau is a fantastic laboratory to study disk dynamics during a stellar flyby that deserves further attention.
Acknowledgements. SPHERE was designed and built by a consortium made of IPAG (Grenoble, France), MPIA (Heidelberg, Germany), LAM (Marseille,
France), LESIA (Paris, France), Laboratoire Lagrange (Nice, France), INAF– Osservatorio di Padova (Italy), Observatoire de Genève (Switzerland), ETH Zurich (Switzerland), NOVA (Netherlands), ONERA (France) and ASTRON (Netherlands) in collaboration with ESO. SPHERE was funded by ESO, with additional contributions from CNRS (France), MPIA (Germany), INAF (Italy), FINES (Switzerland) and NOVA (Netherlands). Additional funding from EC’s 6th and 7th Framework Programmes as part of OPTICON was received (grant number RII3-Ct-2004-001566 for FP6 (2004–2008); 226604 for FP7 (2009–2012); 312430 for FP7 (2013–2016)). We acknowledge the Programme National de Planétologie (PNP) and the Programme National de Physique Stellaire (PNPS) of CNRS-INSU, France, the French Labex OSUG@2020 (Investissements d’avenir – ANR10 LABX56) and LIO (Lyon Institute of Ori-gins, ANR-10-LABX-0066 within the programme Investissements d’Avenir, ANR-11-IDEX-0007), and the Agence Nationale de la Recherche (ANR-14-CE33-0018) for support. This paper makes use of the following ALMA data: ADS/JAO.ALMA#2015.1.00888.S. ALMA is a partnership of ESO (represent-ing its member states), NSF (USA) and NINS (Japan), together with NRC (Canada), MOST and ASIAA (Taiwan), and KASI (Republic of Korea), in coop-eration with the Republic of Chile. The Joint ALMA Observatory is operated by ESO, AUI/NRAO and NAOJ. This research has made use of the NASA Astro-physics Data System. We acknowledge funding from ANR of France under contract ANR-16-CE31-0013. NC acknowledges support from the European Union’s Horizon 2020 research and innovation programme under the Marie Skłodowska-Curie grant agreements No 210021 and 823823. The Geryon clus-ter at the Centro de Astro-Ingenieria UC was extensively used for calcula-tions. BASAL CATA PFB-06, the Anillo ACT-86, FONDEQUIP AIC-57, and QUIMAL 130008 provided funding for several improvements to the Geryon cluster. AZ acknowledges support from the FONDECYT Iniciación en inves-tigación project number 11190837.
References
Akeson, R. L., Jensen, E. L. N., Carpenter, J., et al. 2019,ApJ, 872, 158
Andrews, S. M., Wilner, D. J., Espaillat, C., et al. 2011,ApJ, 732, 42
Bate, M. R. 2018,MNRAS, 475, 5618
Beuzit, J. L., Vigan, A., Mouillet, D., et al. 2019,A&A, 631, A155
Breslau, A., Vincke, K., & Pfalzner, S. 2017,A&A, 599, A91
Clarke, C. J., & Pringle, J. E. 1993,MNRAS, 261, 190
Correia, S., Zinnecker, H., Ratzka, T., & Sterzik, M. F. 2006,A&A, 459, 909
Cuello, N., Dipierro, G., Mentiplay, D., et al. 2019,MNRAS, 483, 4114
Cuello, N., Louvet, F., Mentiplay, D., et al. 2020,MNRAS, 491, 504
Dai, F., Facchini, S., Clarke, C. J., & Haworth, T. J. 2015,MNRAS, 449, 1996
de Boer, J., Langlois, M., van Holstein, R. G., et al. 2020,A&A, 633, A63
Dohlen, K., Langlois, M., Saisse, M., et al. 2008,Proc. SPIE, 7014, 70143L
Duchêne, G. 1999,A&A, 341, 547
Espaillat, C., Calvet, N., D’Alessio, P., et al. 2007,ApJ, 670, L135
Espaillat, C., D’Alessio, P., Hernández, J., et al. 2010,ApJ, 717, 441
Francis, L., & van der Marel, N. 2020,ApJ, 892, 111
Gaia Collaboration (Brown, A. G. A.) 2018,A&A, 616, A1
Joncour, I., Duchêne, G., Moraux, E., & Motte, F. 2018,A&A, 620, A27
Kraus, A. L., & Hillenbrand, L. A. 2009,ApJ, 704, 531
Kurtovic, N. T., Pérez, L. M., Benisty, M., et al. 2018,ApJ, 869, L44
Lodato, G., & Price, D. J. 2010,MNRAS, 405, 1212
McMullin, J. P., Waters, B., Schiebel, D., Young, W., & Golap, K. 2007,ASP Conf. Ser., 376, 127
Monaghan, J. J., & Lattanzio, J. C. 1985,A&A, 149, 135
Offner, S. S. R., Dunham, M. M., Lee, K. I., Arce, H. G., & Fielding, D. B. 2016,
ApJ, 827, L11
Perez, S., Casassus, S., Ménard, F., et al. 2015,ApJ, 798, 85
Petkova, M. A., Laibe, G., & Bonnell, I. A. 2018,J. Comput. Phys., 353, 300
Pfalzner, S. 2003,ApJ, 592, 986
Pfalzner, S. 2013,A&A, 549, A82
Pinilla, P., Benisty, M., Birnstiel, T., et al. 2014,A&A, 564, A51
Price, D. J. 2007,PASA, 24, 159
Price, D. J., & Monaghan, J. J. 2007,MNRAS, 374, 1347
Price, D. J., Wurster, J., Tricco, T. S., et al. 2018a,PASA, 35, e031
Price, D. J., Cuello, N., Pinte, C., et al. 2018b,MNRAS, 477, 1270
Schaefer, G. H., Prato, L., Simon, M., & Patience, J. 2014,AJ, 147, 157
Tanii, R., Itoh, Y., Kudo, T., et al. 2012,PASJ, 64, 124
van der Marel, N., Williams, J. P., Ansdell, M., et al. 2018,ApJ, 854, 177
van Holstein, R. G., Girard, J. H., de Boer, J., et al. 2020,A&A, 633, A64
Vincke, K., Breslau, A., & Pfalzner, S. 2015,A&A, 577, A115
Weidenschilling, S. J. 1977,MNRAS, 180, 57
Winter, A. J., Clarke, C. J., Rosotti, G., et al. 2018a,MNRAS, 478, 2700
Winter, A. J., Booth, R. A., & Clarke, C. J. 2018b,MNRAS, 479, 5522
Zapata, L. A., Rodríguez, L. F., Fernández-López, M., et al. 2020, ApJ, submitted, [arXiv:2005.01652]
A&A 639, L1 (2020)
Appendix A: Disk of UX Tau C
1.0
0.5
0.0
0.5
1.0
RA (arcsec)
1.0
0.5
0.0
0.5
1.0
DE
C
(a
rc
se
c)
1 0 1 2 3 4Fig. A.1.SPHERE J-band linearly polarized intensity image (Qφ) of the disk of UX Tau C. The image is binned by a factor of 2 to improve contrast. The data are shown in linear stretch, and the scale is absolute in detector units (ADU). The disk is faint and compact. The disk position angle is PA= 5◦
± 2◦
. The axis ratio suggests an inclination larger than i= 60◦
. The disk is detected over 000.13, or ∼19 au.
Appendix B: ALMA archival data
The UX Tau system was observed multiple times with ALMA. The continuum emission of component UX Tau A was discussed byPinilla et al.(2014) andAkeson et al.(2019). Only the disk of UX Tau A is detected in the continuum.Francis & van der Marel(2020) andZapata et al. (2020) presented archival deep and high-resolution data obtained by program 2015.1.00888.S (PI Akiyama). This program included12CO (3-2) line emission data that we use here as well. The observations have a veloc-ity resolution of 410 m s−1for the CO line data. The observation took place on 2016 August 10. We performed our own reduc-tion using the supplied reducreduc-tion script and version 4.7.2 of the CASA software (McMullin et al. 2007). We self-calibrated the continuum visibilities using three rounds of phase-only self-calibration using successively shorter solution intervals (∞, 60s, 40s), resulting in a gain of a factor ∼2 in RMS noise and dynamic range.
We imaged the continuum visibilities using Briggs weight-ing resultweight-ing in a 000. 20 × 000. 17 beam at PA = −21.0◦. For the CO
emission we subtracted the continuum data using the
uvcon-tsub
routine of CASA, and applied the self-cal solution to the resulting visibilities. We imaged the CO line using a channel width of 0.24413 MHz and a natural weighting resulting in a 000. 24 × 000. 18 beam at PA = −24.7◦. The CO line emission andthe dust continuum emission maps are shown in Fig.B.2. From
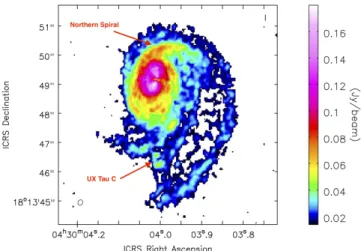
Fig. B.1. Peak intensity map (moment 8) made from the Briggs-weighted CO(3-2) data. The black contour is the continuum emis-sion traced at the 1σ level (58 µJy). The position of UX Tau C is labeled. The northern spiral arm seen in scattered light in Fig.2is also indicated.
the same continuum data,Francis & van der Marel(2020) fit an inclination id= 40◦at a PA= 167◦.
The middle panel of Fig.B.2shows the CO (3–2) integrated intensity map (moment 0) of the region spanning UX Tau A and C found at offset [0,0] and [−2.7,0], respectively. The CO emis-sion overlaps with the two stars. The left insert is a zoom of the Band 7 (0.84 mm) continuum emission showing the ringed structure of the disk at that frequency. The insert on the right is an overlay of the CO (3–2) map of the velocity of the peak emission in color with the deep J-band SPHERE image of Fig.2 in contours. The bridge between components A and C suggested in Fig.2is located just inside the inner CO spiral labeled in the figure. Two, possibly three, spirals can be identified in CO emis-sion on the western side of UX Tau A: the one seen in scattered light, which may correspond to a distinct CO spiral; and two oth-ers labeled inner and outer spirals, which have the same general curvature but are located further away. The northern spiral seen in scattered light is also clearly detected in the CO peak intensity map shown in Fig.B.1. This spiral is part of the same dynamical structure creating the inner and outer CO spirals. The front face of the disk being on the western side, the faint spirals detected by SPHERE and the CO spirals observed by ALMA are trailing spirals.
The rotational signature of the two disks is well resolved. The orientation of the velocity gradients is indicated by green lines in Fig.B.2, right panel. They are not parallel to each other. SPHERE marginally resolved the disk of UX Tau C and the incli-nation is i ≥ 60◦. The disks of UX Tau A and C are likely not coplanar. The tail of material attached to UX Tau C reported by Zapata et al.(2020) is also visible on the same panel, to the left of UX Tau C. All these are expected signatures of stellar flybys with pericenters approximately the size of the original primary disk radius.
Fig. B.2.CO J= 3 − 2 integrated intensity map (moment 0, in grayscale at the center) of the region spanning UX Tau A and C, located at offset [0,0] and [0,−2.7], respectively. Left insert: zoom of the ringed-disk seen in 0.84 mm continuum emission. Right insert: map of the peak intensity velocity, where the rotation signature of the disk of both UX Tau A and C are clearly seen. Labels indicating the various features are added. The two green lines indicate the direction of the velocity gradients in the disks. The deep J-band scattered light map of Fig.2is shown in black contours. In each panel the brown contour ellipse around UX Tau A is drawn at 10 times the continuum RMS of 58 µJy. The beam is shown in the bottom left of each panel.
Appendix C: Novel DE-NOISING procedure
To smooth the noise in the SPHERE images and highlight the spirals directly from the native images without stacking or bin-ning, we used a novel adaptive de-noising procedure based on the adaptive kernel smoothing employed in SPH and imple-mented in the
splash
software (Price 2007). FigureC.1shows the native J-band polarized intensity image on the left and the de-noised image in the right panel. The two spirals are visible on both images, but more contrast and more details are visible in the de-noised version. We note that only one data set was used to produce Fig.C.1, contrarily to Fig.2.The main idea behind the de-noising procedure is to use a beam size (smoothing length) that is locally adaptive for each pixel, inversely proportional to the square root of the intensity. Specifically, we constructed a smoothed intensity image from the original image according to
hI(x, y)i=X
i
X
j
I(xi, yj)∆x2W(|x − xi|, |y − yj|, h(xi, yj)), (C.1)
where i and j sum over the number of pixels in the x and y direc-tions,∆x is the pixel spacing, and W is a 2D smoothing kernel. We then implemented an adaptive smoothing by relating h to the local pixel intensity using
h(x, y)= hmin
s Imax
hI(x, y)i, (C.2)
where hminis the beam size at I= Imax. Since both the smoothed
intensity and the smoothing length itself are mutually depen-dent, we solved (C.2) and (C.1) iteratively, according to the usual practice in SPH (e.g.,Price & Monaghan 2007). We adopted the usual cubic B-spline kernel (Monaghan & Lattanzio 1985) for the interpolation. We also employed the exact sub-pixel interpo-lation method fromPetkova et al.(2018) to ensure that the total flux is conserved by the interpolation procedure. The new set of pixels (x, y) is arbitrary, but in practice we interpolated to a set of pixels that are the same as those in the original image.
We chose Imaxto be the maximum intensity in the image and
found best results with hmin= 1.25 times the original pixel
spac-ing for the UX Tau J-band polarized intensity image presented
Δ Dec (arcsec) -ΔRA (arcsec) -2 -1 0 1 2 -2 0 2 -ΔRA (arcsec) -2 -1 0 1 2 -1 0 1 2 log intensity
Fig. C.1.J-band polarized intensity images. Left panel: native J-band image shown in log stretch. The two spirals a barely detectable above background noise. Right panel: denoised J-band image. At the expense of a slight loss of angular resolution, the de-noised spirals are easily detectable. Δ Dec (arcsec) -ΔRA (arcsec) -1 0 1 -2 0 2 -ΔRA (arcsec) -1 0 1 -ΔRA (arcsec) -1 0 1 0 1 2 log intensity
Fig. C.2.J-band polarized intensity images. Left panel: native J-band image shown in log stretch. Middle panel: de-noised J-band polarized intensity image where the Stokes Q and U images were combined before applying the de-noising procedure. Right panel: de-noised J-band image where the Q and U images were de-noised separately before combining to produce the polarized intensity de-noised image.
in Fig.C.1, right panel. For polarized intensity images we found it best to de-noise each polarization separately before combin-ing to form a total polarized intensity image. This is shown in Fig.C.2. A paper describing our open source de-noising tool in detail is in preparation (Price et al., in prep.).
![Fig. B.2. CO J = 3 − 2 integrated intensity map (moment 0, in grayscale at the center) of the region spanning UX Tau A and C, located at offset [0,0] and [0,−2.7], respectively](https://thumb-eu.123doks.com/thumbv2/123doknet/14777513.594599/8.892.80.814.123.364/integrated-intensity-moment-grayscale-center-spanning-located-respectively.webp)
