HAL Id: insu-01322886
https://hal-insu.archives-ouvertes.fr/insu-01322886
Submitted on 9 Nov 2020
HAL is a multi-disciplinary open access
archive for the deposit and dissemination of
sci-entific research documents, whether they are
pub-lished or not. The documents may come from
teaching and research institutions in France or
abroad, or from public or private research centers.
L’archive ouverte pluridisciplinaire HAL, est
destinée au dépôt et à la diffusion de documents
scientifiques de niveau recherche, publiés ou non,
émanant des établissements d’enseignement et de
recherche français ou étrangers, des laboratoires
publics ou privés.
and Cloud Radar Reflectivity in Tropical Convective
clouds.
Alain Protat, Julien Delanoë, J. W. Strapp, E. Fontaine, D. Leroy, Alfons
Schwarzenboeck, L. Lilie, C. Davison, F. Dezitter, A. Grandin, et al.
To cite this version:
Alain Protat, Julien Delanoë, J. W. Strapp, E. Fontaine, D. Leroy, et al.. The Measured Relationship
between Ice Water Content and Cloud Radar Reflectivity in Tropical Convective clouds.. Journal of
Applied Meteorology and Climatology, American Meteorological Society, 2016, 55 (8), pp.1707-1729.
�10.1175/JAMC-D-15-0248.1�. �insu-01322886�
The Measured Relationship between Ice Water Content and Cloud Radar Reflectivity
in Tropical Convective Clouds
A. PROTAT,aJ. DELANOË,bJ. W. STRAPP,cE. FONTAINE,dD. LEROY,dA. SCHWARZENBOECK,d L. LILIE,eC. DAVISON,fF. DEZITTER,gA. GRANDIN,gANDM. WEBERg
aResearch and Development Branch, Australian Bureau of Meteorology, Melbourne, Victoria, Australia bLaboratoire des Atmosphère Milieux Observations Spatiales (LATMOS), Guyancourt, France
cMet Analytics Inc., Toronto, Ontario, Canada
dLaboratoire de Météorologie Physique (LaMP), Université Blaise Pascal, Clermont-Ferrand, France eScience Engineering Associates, Mansfield Center, Connecticut
fNational Research Council Canada, Ottawa, Ontario, Canada gAirbus, Inc., Toulouse, France
(Manuscript received 14 September 2015, in final form 2 May 2016) ABSTRACT
In this paper, unprecedented bulk measurements of ice water content (IWC) up to approximately 5 g m23 and 95-GHz radar reflectivities Z95are used to analyze the statistical relationship between these two
quantities and its variability. The unique aspect of this study is that these IWC–Z95relationships do not use
assumptions on cloud microphysics or backscattering calculations. IWCs greater than 2 g m23are also in-cluded for the first time in such an analysis, owing to improved bulk IWC probe technology and a flight program targeting high ice water content. Using a single IW–Z95relationship allows for the retrieval of IWC
from radar reflectivities with less than 30% bias and 40%–70% rms difference. These errors can be reduced further, down to 10%–20% bias over the whole IWC range, using the temperature variability of this re-lationship. IWC errors largely increase for Z95. 16 dBZ, as a result of the distortion of the IWC–Z95
relationship by non-Rayleigh scattering effects. A nonlinear relationship is proposed to reduce these errors down to 20% bias and 20%–35% rms differences. This nonlinear relationship also outperforms the temperature-dependent IWC–Z95relationship for convective profiles. The joint frequency distribution of
IWC and temperature within and around deep tropical convective cores shows that at the2508 6 58C level, the cruise altitude of many commercial jet aircraft, IWCs greater than 1.5 g m23were found exclusively in convective profiles.
1. Introduction
Cloud microphysical properties are major drivers of cloud–radiation interactions, through complex processes that are still a challenge to accurately simulate in large-scale models. The vertical distribution of ice water con-tent (IWC) inside nonprecipitating and deep convective clouds plays a central role in the interaction between clouds and incoming and outgoing radiation (e.g.,
Stephens et al. 1990). Different climate models still produce a very different ice water path, spanning up to an order of magnitude difference (Waliser et al. 2009;Li et al.
2012). New global datasets (Delanoë and Hogan 2010;
Deng et al. 2013) offer new avenues to shed more light on the global and regional properties of nonprecipitating ice cloud microphysics, the cloud–radiation interactions, and the relationship between cloud properties and the large-scale environment (e.g.,Su et al. 2008;Protat et al. 2011). Although the retrieval of IWC in nonprecipitating ice clouds has been found to be reasonably accurate (Mace 2010;Protat et al. 2010a;Deng et al. 2013;Delanoë et al. 2013;Avery et al. 2012), there are reasons to believe this is not the case for convective cloud systems. The CloudSat IWC retrieval techniques currently rely on an assumed single statistical relationship between 95-GHz radar reflectivity (denoted as Z95) and IWC,
sometimes with temperature T as an additional constraint (e.g., Hogan et al. 2006;Protat et al. 2007, hereinafter referred to as P07). These IWC–Z95 and IWC–Z95–T
Corresponding author address: Alain Protat, Australian Bureau of Meteorology, 700 Collins St., Docklands, Melbourne, VIC 3008, Australia.
E-mail: [email protected]
AUGUST2016 P R O T A T E T A L . 1707
DOI: 10.1175/JAMC-D-15-0248.1 Ó 2016 American Meteorological Society
relationships were derived from aircraft in situ micro-physical data collected in nonprecipitating ice clouds at midlatitude and tropical locations, and did not include any data collected within and around deep convective cores. Furthermore, these relationships were not de-rived using direct measurements of IWC and Z95.
Rather, IWC was generally estimated from measured particle size distributions (PSDs) and a prescribed single statistical relationship between ice crystal mass and diameter [the so-called m(D) relationship], while Z95was also simulated using the same PSD
measure-ments and assumed m(D) relationship as inputs into T-matrix (Mishchenko et al. 1996) or simpler non-Rayleigh scattering calculations for spherical particles with corrected densities (e.g.,Hogan et al. 2006;P07). The resulting variability around the fitted IWC–Z95
relationship was found to be very large in these studies, with IWCs having up to an order of magnitude differ-ence for a given Z95, as discussed in, for example,
Matrosov et al. (2002)andP07. An unknown fraction of this variability could actually be artificially produced by the use of a single m(D) for all ice clouds. More recent studies have used either bulk IWC or Z95
mea-surements combined with PSD meamea-surements in order to refine m(D) (e.g., A. J. Heymsfield et al. 2010, hereinafter referred to asH10) or to include some of its variability in the calculations (e.g.,Fontaine et al. 2014, hereinafter referred to as F14). However, in none of these studies were both bulk IWC and Z95
measure-ments available to directly characterize the real vari-ability of the IWC–Z95relationship.
It is also obvious in past studies that the fitted IWC– Z95 power-law relationship does not capture at all
the largest IWCs simulated from the PSDs, owing to the non-Rayleigh scattering effects at 95 GHz dis-torting the IWC–Z95relationship for high IWCs (see,
e.g., the right panels in Fig. 1 in P07). This is why
Matrosov and Heymsfield (2008, hereinafter referred to asMH08) developed a specific CloudSat IWC–Z95
relationship using only data points for which Z95 .
0 dBZ. However, thisMH08relationship is still based on IWCs and Z95 derived from measured PSDs and
assumes a single m(D) for all ice clouds. In addition, the maximum estimated IWC and Z95values included
in theMH08 study were 2 g m23and 14 dBZ, respec-tively. This relationship cannot be extrapolated to larger values.
High ice water content detrained by deep convec-tion in the upper troposphere is also a significant is-sue for aviation safety, especially in the tropics and subtropics where jet engines are found to be sus-ceptible to engine power loss and damage in the vi-cinity of deep convection (e.g., Lawson et al. 1998;
Mason et al. 2006;Grzych and Mason 2010;Strapp et al. 2016a), which have been related to a previously not well recognized form of engine icing involving high concentrations of small ice crystals, now re-ferred to as ice crystal icing. Safety concerns related to these engines led the international regulation au-thorities and scientific community to organize an in-ternational airborne field campaign based in Darwin, Northern Territory, Australia, called the High Alti-tude Ice Crystal (HAIC)–High Ice Water Content (HIWC) campaign (Dezitter et al. 2013;Strapp et al. 2016a, see summary in section 2) during January– March 2014. Data collected during this field experi-ment include state-of-the-art particle size distribu-tion, bulk IWC (including high values), and multibeam 95-GHz radar reflectivity measurements, providing an unprecedented opportunity to characterize the IWC–Z95
relationship and its true variability by using actual measurements.
The first objective of this paper is to develop and analyze the first ever IWC–Z95relationship that does
not include any assumption on the m(D) relationship and that includes measured IWC values reaching about 5 g m23 (section 3). We then investigate how accurately IWC can be characterized from Z95alone
or with additional inputs such as temperature and/or location within a convective cloud system (convective or stratiform region). Accordingly, the variability of the IWC–Z95 relationship as a function of
tempera-ture and as a function of a convective index is studied insection 4. These IWC–Z95relationships are finally
used insection 5to derive a statistical representation of the vertical distribution of IWC in and around tropical deep convective cores. Further possible ap-plications of these relationships are discussed in
section 6.
2. The HAIC–HIWC Darwin campaign measurements
The HAIC–HIWC field campaign took place from 16 January to 7 March 2014 out of Darwin. Details of the field campaign can be found in Dezitter et al. (2013). Only information relevant to this study is given in this section. Large-scale active monsoon conditions resulting in intense convective activity over the northern part of Australia were well established throughout much of the duration of the campaign, allowing for 23 scientific flights (for a total of 72 flight hours) to be conducted in very favorable conditions. The flight strategy was developed in conjunction with an aviation industry working group and is contained in the High Ice Water Content Project Science Plan
(Strapp et al. 2016a). The objective was to fly a survey pattern through mesoscale convective system anvils at scales of approximately 200 km or larger, one that would initially include penetrations as close as possi-ble to deep convective cores at flight altitude if deemed safe by the pilot. At least one convective core penetration and several flight legs in the immediate vicinity of the convective cores were ideally flown. In situ updrafts of up to 23 m s21were recorded at flight altitude, with peak updraft speeds exceeding 10 m s21 in most flights. The maximum measured peak IWC was about 5 g m23, and water contents exceeding 2 g m23for over 60 n mi (111 km) were measured.
The aircraft platform used for this campaign was the French Service des Avions Français Instrumentés de Recherche en Environnement (SAFIRE) Falcon 20, equipped with a suite of in situ microphysics probes, bulk total water content (TWC) probes, and a 95-GHz Doppler cloud radar named Radar Aéroporté et Sol de Télédétection des Propriétés Nuageuses (RASTA;Protat et al. 2004;Protat et al. 2009;Delanoë et al. 2013). The endurance of the Falcon 20 is 3.5 h, its nominal true airspeed is 200 m s21, and its ceil-ing is at about 2508C in the tropical atmosphere near Darwin.
a. In situ microphysical measurements
The PSD was measured from 1- to 6400-mm di-ameter using the Cloud Droplet Probe (CDP, size range 1–50mm, resolution of 2 mm) from Droplet Measurement Technologies (DMT), the 2D-Stereo Probe [2D-S, size range 10–1280mm, resolution of 10mm; Lawson et al. (2006)] from the Stratton Park Engineering Company (SPEC, Inc.), and the Particle Imaging Probe (PIP, size range 100–6400mm, resolu-tion of 100mm) from DMT (Baumgardner et al. 2011). These probes were fitted with antishattering tips so as to reduce the shattering of large ice crystals onto the probe tips (e.g.,Korolev and Isaac 2005). Remaining shattered particles were then removed by means of software, using the very small interarrival time of shattered particles (e.g.,Field et al. 2006;Heymsfield 2007). Both approaches are indeed needed for an effi-cient mitigation of shattering (e.g.,Jackson et al. 2014). In the present paper, we use composite 2D-S–PIP PSDs, which were derived using a simple weighting tech-nique described inF14.
The reference bulk IWC measurement was ob-tained using a new isokinetic evaporator TWC probe (IKP) that was originally developed between 2007 and 2011 by the National Research Council of Can-ada (NRC), Environment CanCan-ada (EC, now known as Environment and Climate Change Canada), and
Science Engineering Associates (SEA). The device was designed to measure high-IWC conditions up to 10 g m23 at 200 m s21 true airspeed in summer tropical and subtropical atmospheric conditions from 2108 to 2508C, with a designed accuracy of 20%. A downsized version of the probe (IKP2) was then developed for NASA and the FAA in 2013 by SEA and NRC specifically to fit within the opera-tional constraints of the Falcon 20 for the Darwin-2014 HAIC–HIWC flight measurement program. The operating principles of the IKP have been described by Davison et al. (2009), and are the same for the IKP2. The performance of the IKP2 probe has been assessed in multiple wind tunnel tests at four differ-ent facilities, and was found to operate without sat-uration and within 15% for water contents up to 5 g m23and airspeeds up to 150 m s21. More details on this probe can be found inStrapp et al. (2016b)and
Davison et al. (2016). Since the IKP2 measures the total water content, in real conditions liquid water and water vapor contributions should be subtracted to obtain IWC. Unfortunately, the hot-wire LWC sensor on the aircraft was unable to measure LWC below about 10% of the IWC in mixed-phase condi-tions, and LWC levels exceeding this value were very rare. Fortunately, the Goodrich ice detector could be used to detect the presence of liquid water. Two such regions in two very short flight segments were iden-tified at2108C, and these regions were excluded from the subsequent comparisons. The minimum detect-able IWC of the IKP2 is determined by the noise level of the water vapor measurements of the IKP2 and background probes. This resulting noise level of the subtraction of the background humidity from the IKP2 humidity is a function of temperature: it is about 0.1 g m23 at 2108C, dropping rapidly to about 0.005 g m23at2508C. Since most data were gathered at temperatures colder than about2258C, a minimum IWC of 0.05 g m23was chosen as the threshold to include in our analysis. The IKP2 dataset used in this study is at 1-s resolution and is the official final full dataset.
A second hot-wire bulk IWC probe, the so-called Robust probe developed by SEA for EC and the NRC, was integrated onto the CDP canister. The system provided reliable measurements at high alti-tude and high IWC during flight tests conducted by Airbus in 2010 and 2011 (Grandin et al. 2014). Based on results from previous hot-wire probes, it was known that the Robust probe’s collection efficiency for ice crystals would be significantly lower than unity. In this paper, we only use the Robust probe measurements to establish that the two very different bulk TWC probes provide highly correlated IWC
AUGUST2016 P R O T A T E T A L . 1709
measurements. Statistical comparisons using all Darwin 2014 HAIC–HIWC flights (not shown) reveal that these two TWC measurements of quite different operating principles track very closely (correlation coefficient 5 0.96, standard deviation of the differ-ence between the two probes ranging from 20% at IWC5 1 g m23and decreasing roughly linearly down to about 5% at IWC5 4 g m23), and that the overall efficiency factor for the Robust probe is close to 0.45 in this HIWC environment.
b. Airborne cloud radar measurements
The RASTA 95-GHz airborne cloud radar (Protat et al. 2004,2009; Delanoë et al. 2013) provides the radar reflectivities used in this study. The unique setup of this instrument includes the multibeam antenna system (three noncollinear antennas looking upward and three noncollinear antennas looking downward), allowing for the 3D wind to be retrieved below and above the aircraft flight altitude in a pseudovertical cross section during straight-line flight patterns. The RASTA radar has been carefully calibrated using accurate measurements of gains and losses through each radar component, remote fixed targets of known backscatter cross sections, and the Li et al. (2005)
ocean surface backscatter technique (Bouniol et al. 2008). Quantitative comparisons with the CloudSat spaceborne radar (Protat et al. 2009) also showed that the two radar reflectivities agreed to within 1 dB, while the CloudSat radar reflectivities also agreed statisti-cally within 0.4 dB with cloud radar data from five different ground-based sites. These results give con-fidence that the RASTA cloud radar is well calibrated, within 1 dB. Radar reflectivities in linear units from the nadir and zenith antennas nearest to the aircraft were linearly spatially interpolated, typically over 360 m (since the first nadir and zenith radar bins are at 180-m range), to produce a time series of Z95at flight
level, with a 1.2-s temporal resolution. Deriving the IWC–Z95 relationships from the nadir or zenith
re-flectivities instead of the interpolated ones did not result in any change in the coefficients of these re-lationships. It must be acknowledged that since the RASTA radar frequency (W band, around 95 GHz) is much higher than the frequency of the pilot radars on commercial aircraft (X band, around 10 GHz), the IWC–Z95 relationships derived in the present paper
cannot be readily used to mitigate the HIWC threat in real time on commercial aircraft. More work will be done in the near future to derive the same relation-ships at X band and to evaluate the differences with the relationships from this paper, when data become available.
3. The IWC–Z95relationship in deep tropical
convective clouds
As explained in section 1, the dataset collected during the HAIC–HIWC campaign using the IKP2 probe and the RASTA cloud radar allows us the un-precedented opportunity to characterize the IWC– Z95relationship without any assumption on the PSD
or the ice crystal mass–size relationship and including high values of IWC up to 5 g m23. For the sake of comparison with earlier approaches for which direct IWC and/or Z95measurements were not available, we
have also estimated IWC and Z95 using the PSD
measurements, the single mass–size relationship used inP07(which is that fromBrown and Francis 1995), and T-matrix calculations using the aspect ratios es-timated from the projected aspect ratio measured by raw in situ probes. This will be referred to as the PSD approach in the following. The resulting joint distri-bution of IWC and Z95using this technique is shown
in Fig. 1, using a Z95 and an IWC bin of 1 dB and
0.05 g m23, respectively.Figure 2shows the same joint distribution but derived from direct IKP2 IWC and RASTA Z95measurements. For the sake of
compar-isons betweenFigs. 1and 2, the mean IKP2 IWC in each Z95bin is also given in both figures. The joint
distributions are normalized for each reflectivity bin by the sum of all points in each IWC bin. In other words the sum of IWC frequencies is 1 for each re-flectivity bin. Using such normalization allows for changes in the width of the IWC distribution for each Z95bin to be readily observed.
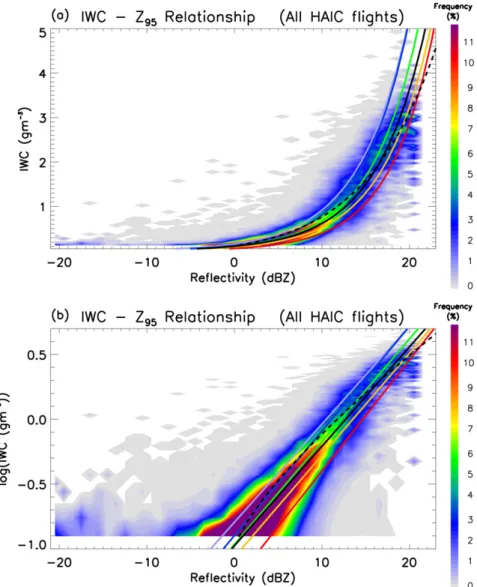
Figure 2 shows that there is a very well-defined power-law relationship between IWC and Z95,
char-acterized by a narrow IWC distribution width for Z95
of less than 10 dBZ. For Z95. 10 dBZ the IWC
dis-tribution becomes wider, indicating that the retrieval of IWC from radar reflectivity will be characterized by larger errors for larger IWCs. This increase in the variability of IWC as a function of Z95is consistent
with the fact that higher 95-GHz radar reflectivities are more sensitive to the variabilities in the shape and density of the ice particles as non-Rayleigh scattering effects increase. Despite these potential effects though, the relationship is still well defined. It must be noted that there are currently no data available to assess whether this relationship can be applied to other regions of the world. This regional variability will be investigated to some extent in the future by collecting more data in different large-scale environ-ments conducive to deep convection.
Comparison between Figs. 1 and 2 highlights the impact of using a single mass–size relationship and
T-matrix calculations versus direct measurements for the first time. For Z95 , 5 dBZ, the widths of the IWC
distribution are very similar for any Z95bin. The
dif-ferences between the two joint distributions are largest for Z95. 10 dBZ and IWCs . 1.5 g m23, where a
bi-modal distribution of Z95 as a function IWC appears
with the PSD approach (Fig. 1; see the two possible values of Z95for a given IWC for IWC. 1.5 g m23).
The more frequent of the two modes is in good agree-ment with the distribution obtained with the direct measurements (Fig. 2), with a tendency to slightly overestimate IWC for any Z95. The second mode
largely overestimates IWC. The IWC distribution is also generally wider when direct measurements are used. This result shows that the natural variability of the mass–size relationship tends to broaden the range of possible IWCs for any Z95greater than 10 dBZ.
A simple power-law fit to the joint frequency distri-bution of Fig. 2 yields the following IWC–Z95
relationship:
IWC5 0:108Zm950:770, (1) where Zm955 10Z95/10:0is the radar reflectivity expressed
in linear units (mm6m23). The solid red line in Fig. 2
shows the mean IKP2 IWC for each Z95bin. The
com-parison of the power-law fit and the mean IWC values
shows that the power-law IWCs tend to slightly but systematically underestimate the mean IWC for Z95,
17 dBZ and overestimate IWC for Z95. 17 dBZ. This is
quantified further in Fig. 3 using the relative bias (hereinafter referred to as the bias) and the relative root-mean-square difference (hereinafter referred to as the rms difference) as a function of IWC and Z95.
Figure 3ashows that IWCs greater than 0.5 g m23can be retrieved from(1)with less than 30% bias and less than 40% rms difference. For IWCs lower than 0.5 g m23, the bias is less than 20% but the rms differences increase as IWC decreases, up to 70% for IWC5 0.05 g m23. The cumulative frequency of the absolute errors (not shown) indicates that the absolute errors grow linearly as a function of IWC up to IWC5 1.8 g m23, above which they tend to be constant at less than 0.5 g m23for 45% of the time and less than 1 g m23about 80% of the time.
It is also important to characterize the errors as a function of the reflectivity itself, since that is the way IWC is retrieved from(1).Figures 3c,dshow that for Z95,
15 dBZ, there is a systematic underestimation of IWC by about 10%–20%, with rms differences decreasing linearly from 70% at Z955 0 dBZ to 30% for Z955
15 dBZ. For Z95 . 15 dBZ, the bias then sharply
in-creases from 210% to about 50% between 15 and 21 dBZ, and the rms differences range from 30% to 55% in that reflectivity range. As observed in Fig. 2, these
FIG. 1. Joint frequency distribution of simulated IWC and Z95from all HAIC–HIWC flights,
using Z95and IWC bins of 1 dB and 0.05 g m23, respectively. Both IWC and Z95are derived
from the particle size distribution measurements and assuming theBrown and Francis (1995)
mass–size relationship. The Z95reflectivity is simulated using the T-matrix code. The
fre-quencies are normalized by the total number of IWC points in each reflectivity bin. The solid black line is the power-law fit to the data. The red line is the mean IKP2 IWC in each Z95bin.
AUGUST2016 P R O T A T E T A L . 1711
larger IWC errors for Z95. 17 dBZ can be attributed to
strong departures from the power-law shape in the joint IWC–Z95distribution.
An important implication of this result is that al-though the errors are larger for Z95 . 17 dBZ,
non-Rayleigh scattering effects at the W band in that reflectivity range do not alter the accuracy of the IWC retrieval to a point that IWC cannot be retrieved. This indicates that ice crystals contributing to producing high IWC are not of a size large enough to induce large non-Rayleigh scattering effects. Matrosov and Heymsfield (2008)suggest that these errors can be reduced by using Z95. 0 dBZ data only. Nevertheless, we found that the
power-law shape was still not suitable to reducing errors at high reflectivities. So we developed a nonlinear fit expressed as log(IWC)5 aZb
951 c instead. The fit to the
data yielded the following relationship:
log(IWC)5 0:1564Z950:7532 1:01, (2) with Z95. 0 dBZ.
This fit is shown inFig. 2(dashed line). The error analysis as a function of reflectivity (Fig. 4, dashed red) shows that IWCs retrieved using relationship (2)
are slightly overestimated (bias less than 20% over the [0; 10] dBZ range) Z95 , 10 dBZ, with a similar rms
FIG. 2. Joint frequency distribution of measured IWC and Z95from all HAIC–HIWC flights
using Z95and IWC bins of 1 dB and 0.05 g m23, respectively, on (a) linear and (b) logarithmic
IWC scales. The frequencies are normalized by the total number of IWC points in each re-flectivity bin. The solid black line is the power-law fit to the data [relationship(1); see text for details]. The dashed black line is a different fit [relationship(2); see text for details]. The solid red line is the mean IWC in each reflectivity bin. The total number of points is 83 231.
difference for the results from relationship (1). The main benefit, as expected, is in the large improvement in the IWC retrieval for Z95. 10 dBZ when compared
to relationship (1) (cf. solid and dashed red lines in
Fig. 4). The IWC retrieval bias is less than 10% up to Z955 19 dBZ, and increases up to only 25% at Z955
21 dBZ, which is a factor of 2 lower than when using relationship(1)(Fig. 4b). The rms difference decreases linearly from 65% to 20% between 0 and 20 dBZ, then
increases sharply and up to 35% at Z95 5 21 dBZ
(Fig. 4), which is again a large improvement over re-lationship(1), where the rms difference was up to 55% for Z955 21 dBZ.
When using IWC–Z95relationships to retrieve IWC
from Z95, it is assumed implicitly that the radar
cali-bration is perfect. As indicated above, we believe from our calibration work that the RASTA cloud radar cali-bration is accurate to within 1 dB. The effect of a
FIG. 3. Error analysis of radar-derived IWCs. The (a) bias and (b) rms difference as a function of the IKP2 IWC, and the (c) bias and (d) rms difference as a function of radar reflectivity, as derived from the IWC–Z95–T (black) or
IWC–Z95(red) relationship(1).
FIG. 4. Error analysis of radar-derived IWCs: (a) bias and (b) rms difference as a function of radar reflectivity, as derived from the IWC–Z95–T relationship (black) and the IWC–Z95
relationships(1)(red solid) and(2)(red dashed).
AUGUST2016 P R O T A T E T A L . 1713
systematic 1-dB offset on the IWC retrieval can simply be estimated by fitting two power-law relationships such as(1)with 1 dB added or subtracted from the measured reflectivities, resulting in biases of 119% and 216%, respectively, over the whole reflectivity range. If the RASTA radar calibration is off by 1 dB, the IWCs pro-duced using relationship (1) will be subject to this additional bias.
4. The variability of the IWC–Z95relationship
In this section, we investigate two possible sources of the variability in the IWC–Z95 relationship shown in
Fig. 2: the ambient temperature and the location within the convective cloud system (convective versus strati-form region). The underlying motivation for this vari-ability study is to potentially use these parameters as additional constraints to the radar retrieval of IWC to reduce errors. It would have also been interesting to investigate the variability introduced by the underlying surface type (land versus ocean); however, too few cases of pure land-based convection were sampled during the HAIC–HIWC campaign. We also compare in this sec-tion the obtained relasec-tionships with tropical relasec-tion- relation-ships found elsewhere in the literature.
a. Temperature variability
The IWC–Z95relationships derived inHogan et al.
(2006)andP07were found to vary with temperature. In contrast, MH08 did not report a large temperature variability in their dataset. Recently,F14demonstrated using tropical anvil datasets that this variability could be very different for different m(D) assumptions ap-plied to the same PSD dataset, highlighting that pre-vious studies may have overlooked this potential problem. Using their retrieved m(D) and T-matrix calculations of radar reflectivity employing measured particle size distributions and ice crystal aspect ratios as inputs, F14 showed that errors in IWC could be reduced by 9%–12% with temperature-dependent IWC–Z95 relationships. However, there was no bulk
IWC measurement to constrain the F14 datasets. Therefore, the HAIC–HIWC dataset again provides an unprecedented opportunity to directly measure (with-out any microphysical assumption) and analyze the variability of the IWC–Z95relationship with
tempera-ture. The number of samples collected at each tem-perature level during the HAIC–HIWC experiment is given inFig. 5f. This figure shows that over 1000 sam-ples were collected at each temperature level from2508 to 2108C, and the largest number of samples was collected in the [2458C; 2358C] layer (over 12 000 samples). The variability of the joint IWC–Z95
distribution with temperature is shown in the other panels of Fig. 5, where the HAIC–HIWC data between 2558 and 258C have been reorganized into 108C bins. The following IWC–Z95–T relationship was
then derived from the whole HAIC–HIWC dataset:
IWC5 10a(T)Z951b(T), (3)
a(T)5 1:173 3 1026T31 0:000 109T2
1 0:003 152T 1 0:1075, and (4) b(T)5 21:071 3 1025T32 0:001 112T2
2 0:045 05T 2 1:606, (5)
where T is the temperature (8C). A third-order poly-nomial was required to adequately fit the a(T) and b(T) coefficients. Different possible functional forms of the a(T) and b(T) coefficients were tested, and those above pro-vided the best error statistics. The IWC–Z95–T
relation-ships obtained by using(3)–(5)and the central temperature value of each temperature interval are shown in each panel ofFig. 5(colored lines). The temperature variability of the IWC–Z95relationship is found to be largest in the 0 dBZ,
Z95, 13 dBZ range, with IWC systematically larger for a
given Z95at lower temperatures in this reflectivity range. In
contrast, for IWCs larger than about 2 g m23,Fig. 5shows that the IWC–Z95fit does a better or similar job at fitting
the joint IWC–Z95distribution, suggesting that
tempera-ture does not add any value for the retrieval of IWCs larger than 2 g m23. In general, as the temperature drops lower, the shape of the joint IWC–Z95distribution departs more
strongly from the power-law shape, especially in the T 5 2508 6 58C interval. Finally, we see that the joint distributions of IWC and Z95 are narrower in each
tem-perature interval (Fig. 5) than when all temperatures are included (Fig. 2). This clearly indicates that a large part of the variability observed inFig. 2can indeed be attributed to temperature.
This large variability of the IWC–Z95relationship with
temperature suggests that the ratio of the number of large ice particles to medium/small ice particles changes with temperature, thereby changing the relationship between IWC (less sensitive to the large particles than Z95) and Z95
(very sensitive to the size of the larger ice particles). This is investigated further inFig. 6, which shows the mean PSD for all HAIC–HIWC flights in the same 108C temperature intervals as in Fig. 5. The temperature variability of the PSD is characterized by two main signatures. Both signa-tures are consistent with small ice particle formation and growth through water vapor deposition processes domi-nating in the upper troposphere, followed by the aggre-gation process dominating during particle sedimentation at warmer temperatures in convective ice clouds (e.g.,
Protat et al. 2010b). The first signature is a strong increase in the number of large ice particles in the 2–8-mm maxi-mum diameter range as temperature increases. The sec-ond signature is a decrease of similar magnitude in the
number of ice particles smaller than 1 mm, with the ex-ception of the2108 6 58C temperature interval, where a very interesting increase in the number of particles smaller than 0.1 mm is observed, which may be an important result
FIG. 5. As inFig. 2, but for different temperature slabs: (a)2508 6 58C, (b) 2408 6 58C, (c) 2308 6 58C, (d) 2208 6 58C, and (e) 2108 6 58C. The solid black line is the overall IWC–Z95fit, and the colored lines in each panel are the individual fits in each temperature slab. The
solid red line is the mean IWC in each reflectivity bin. (f) The number of samples vs temperature using all profiles (solid), convective profiles (dotted), and stratiform profiles (dashed).
AUGUST2016 P R O T A T E T A L . 1715
that can help us to understand the formation of high-IWC regions. This enhancement of the number of small parti-cles may be the result of an efficient secondary ice pro-duction mechanism, such as that described byHallett and Mossop (1974), where ice splinters are produced under certain conditions in a temperature window of 288 to258C. Ice crystal growth from supercooled liquid water lifted in ice phase by the convective updraft also poten-tially contributes to this increase in the number concen-tration of ice crystals of maximum diameter less than 0.1 mm. These processes will be investigated in more detail in a subsequent study, and are outside the scope of this paper. The main finding in Fig. 6 relevant to our un-derstanding of the variability of the IWC–Z95relationship
with temperature is that the proportion of large to small particles increases with increasing temperature, implying lower IWCs for the same Z95 at warmer temperatures.
This is fully consistent with the observed variability of the IWC–Z95relationship with temperature inFig. 5, as well as
early studies (e.g.,Heymsfield et al. 2013).
As observed in Fig. 7, where the IWC–Z95–T
re-lationship is superimposed every 108C onto the initial overall joint distribution of Z95and IWC, a large part of
the variability in the joint frequency distribution is captured by the spread in the IWC–Z95relationships
for different temperatures.Figures 3a and 3bshow that there is indeed a measurable improvement of about 15% in bias for IWC. 1 g m23 and a slight improve-ment of about 5% in the rms difference for 0.8 g m23, IWC , 2 g m23 when using temperature as an addi-tional constraint. Overall,Fig. 3shows that IWC can be retrieved from(1)with a bias of less than 20% and an rms difference of less than 40% for IWC. 0.5 g m23.
The IWC errors as a function of reflectivity (Figs. 3c,d) show that there is indeed an improvement in the IWC bias when using temperature (biases are less than 65%), but only up to Z955 16 dBZ (corresponding to a
mean IKP2 IWC of about 2 g m23). For Z95. 16 dBZ,
the bias and rms difference get slightly larger when using temperature as an additional constraint. As dis-cussed previously, this is due to non-Rayleigh scatter-ing effects alterscatter-ing the relationship between IWC and Z95at large Z95.Figure 4also indicates that
relation-ship (2), derived using a nonlinear fit applied to data with Z95. 0 dBZ, largely outperforms the IWC–Z95–T
relationship(3). This result shows that the temperature constraint is actually detrimental to the IWC retrieval for Z95. 16 dBZ.
The added value of using temperature as an additional constraint depends on the temperature layer and the reflectivity value (Figs. 8–12). There is a clear difference in the errors for reflectivities lower and larger than about 15–16 dBZ, so we will describe the errors for the two reflectivity ranges [0, 16] dBZ and [16, 21] dBZ sepa-rately. As discussed previously, this is due to the growing impact of non-Rayleigh scattering on the shape of the IWC–Z95 relationship. We will first describe how the
errors vary as a function of temperature for the IWC– Z95relationship (1)and, then, analyze to what extent
temperature helps reduce those errors.
For Z95, 15–16 dBZ, relationship(1)produces
neg-ative IWC biases for low temperatures and positive biases for warmer temperatures. The IWC bias goes from240% to 220% at T 5 2508 6 58C (Fig. 8) and to220% at T 5 2408 6 58C (Fig. 9); it then reaches an overall minimum of610% at T 5 2308 6 58C (Fig. 10), before increasing to peak overestimations of 20%–40% for T5 2208 6 58C in the [0, 5] dBZ and [10, 15] dBZ reflectivity intervals. The IWC bias is then largest at T5 2108 6 58C, reaching peaks of 60%–80% for Z95,
9 dBZ. When using the nonlinear fit(2)between log(IWC) and Z95, which was designed to produce a better
re-trieval for large IWC (dashed red curves inFigs. 8–12), the IWC bias and rms difference at Z95, 15–16 dBZ are
degraded when compared with results obtained with re-lationship(1), except for low temperatures, where some improvement is observed (Figs. 8 and 9). In contrast, when using temperature as an additional constraint for Z95, 15–16 dBZ (black curves inFigs. 8–12), the IWC
bias remains small (,20%) at all temperature intervals, and much smaller than when using the IWC–Z95
re-lationship, except for the temperature interval T5 2308 6 58C, where temperature does not have much impact. In terms of rms differences,Figs. 8–12show that there is a general improvement of about 5% in all individual temperature bins for Z95, 15–16 dBZ.
FIG. 6. Mean particle size distribution for all HAIC–HIWC flights (solid black), all convective profiles (dotted black), and all stratiform profiles (dashed black), as well as for the five tempera-ture slabs inFig. 5using the same color code.
Figure 4 showed that the use of temperature as an additional constraint was overall slightly detrimental to the IWC retrieval for Z95. 16 dBZ.Figures 8–12further
indicate that there is a compensating effect between the largely detrimental effects at low temperatures and the added value at warmer temperatures. The detrimental effect for Z95. 16 dBZ is indeed only found at lower
temperatures [especially T5 2508 6 58C (Fig. 8) and T5 2408 6 58C (Fig. 9)]. In these two temperature bins, it is therefore recommended to use IWC–Z95
relation-ships (1) or (2), not the temperatudependent re-lationship(3). Using temperature has very little impact on the IWC retrieval at T 5 2308 6 58C, while at warmer temperatures (T5 2208 6 58C and T 5 2108 6 58C), the use of temperature does improve the IWC bias and rms difference. Relationship(3)even performs at
the same level or slightly better than the nonlinear re-lationship(2), which was designed for better high IWC retrieval.
In conclusion the addition of the temperature con-straint in the IWC–Z95–T relationship (3) is overall
largely beneficial, except when Z95is larger than 16 dBZ
for temperatures lower than2258C. It is advised to use the nonlinear relationship (2) between log(IWC) and Z95in that case.
b. Convective–stratiform variability
Convective and stratiform regions of tropical deep convective cloud storms are known to be characterized by different drop size distributions [e.g., Bringi et al. (2009),Thurai et al. (2010), andPenide et al. (2013a)for the Darwin region] and ice particle size distributions
FIG. 7. As inFig. 2, but with the different fits from different temperature slabs superimposed (light blue,2508 6 58C; blue, 2408 6 58C; green, 2308 6 58C; orange, 2208 6 58C; and red, 2108 6 58C).
AUGUST2016 P R O T A T E T A L . 1717
(Heymsfield et al. 2013). These convective and stratiform regions can be classified with ground-based weather ra-dars using indices derived from reflectivity [magnitude, texture, presence of so-called radar bright band below the 08C isotherm altitude; e.g.,Steiner et al. (1995)] or from the retrieval of the drop size distribution parameters if the radar has dual-polarization capabilities (e.g.,Thurai et al. 2010;Penide et al. 2013b). It is therefore of interest to investigate whether some of the variability of the IWC– Z95 relationship is due to microphysical differences
be-tween convective and stratiform regions. Overall, the convective region is characterized by updrafts and downdrafts routinely exceeding 5–10 m s21 above the melting layer in tropical convective cores (e.g.,May and Rajopadhyaya 1999;May et al. 2002;G. M. Heymsfield et al. 2010;Giangrande et al. 2013) while the stratiform region is characterized by a slight updraft in ice phase and slight downdraft in liquid phase, generally not exceeding a few tens of centimeters per second [e.g., Protat and Williams (2011) for the Darwin region; Gamache and Houze 1982; Chong et al. 1987; Nishi et al. 2007]. To separate the RASTA cloud radar profiles into convective and stratiform profiles, we have developed a simple con-vective index based on the maximum of the drafts. The RASTA cloud radar multibeam measurements allow for the vertical profile of the two horizontal wind components
and the sum of the vertical velocity w and reflectivity-weighted terminal velocity VTto be retrieved using the
three noncollinear Doppler velocity measurements as inputs into a multi-Doppler ground-based radar retrieval technique adapted to the airborne configuration [tech-nique described in Protat and Zawadzki (1999);Collis et al. (2013)]. The criterion we use is that if (VT1 w) is
greater than 1 m s21or smaller than23 m s21for at least 1 km in height above the 08C isotherm altitude (i.e., in ice phase), then the cloud radar profile is classified as con-vective. Otherwise, it is classified as stratiform.
Joint frequency distributions of Z95 and IWC derived
using the convective and stratiform profiles from all HAIC– HIWC flightsare shown inFigs. 13a and 13b, respectively. Again, power-law relationships are also fitted to the joint frequency distributions to produce IWC–Z95relationships:
convective IWC5 0:152Zm950:715 and (6) stratiform IWC5 0:103Zm950:749. (7)
FromFig. 13, it is clearly observed that for any given Z95, IWC is systematically larger for convective
profiles than for stratiform profiles. For instance, for Z955 20dBZ, the mean IWC is 4.1gm23in convective
profiles and 3.2 g m23in stratiform profiles (;25% increase
FIG. 8. As inFig. 4, but for the2508 6 58C temperature slab.
FIG. 9. As inFig. 4, but for the2408 6 58C temperature slab.
in IWC). A much higher frequency of occurrence of IWC. 2 g m23is also found in the convective profiles. Differences between convective PSDs and stratiform PSDs (Fig. 6) provide further insights into the microphysical processes involved in the large differences observed between the two IWC–Z95 relationships. Figure 6 shows that convective
profiles are characterized by a much larger number of particles of maximum diameter up to about 2 mm than stratiform profiles (an order of magnitude difference for Dmax ; 0.1mm), while the number of large particles is
similar. This is consistent with larger IWCs for a given Z95in
convective profiles. This large difference in the number of smaller particles in convective profiles suggests again that the production of small ice in convective updrafts through secondary ice formation–multiplication has the potential to generate areas of high IWC with moderate Z95.
Error analysis of IWC derived from the convective IWC–Z95 and IWC–Z95–T relationships (Fig. 14)
shows that the bias and rms difference as a function of Z95
are very similar with or without temperature for Z95.
9 dBZ, and the IWC bias is larger when using tempera-ture for Z95, 9 dBZ (Figs. 14a,b).Figures 14a,bshow
that the nonlinear relationship(2) between log(IWC) and Z95produces the best error statistics overall, with
IWC biases less than620% over the [2, 21] dBZ range, and rms differences decreasing from about 80% at Z955
0 dBZ down to 20%–30% for Z95. 15 dBZ.
Error analysis of IWC derived from the stratiform IWC–Z95relationship(7)(Fig. 15) shows that the use
of temperature is beneficial to the IWC retrieval. Re-lationship (3) indeed outperforms relationships (1)
and(2), with an IWC bias of less than610% over the whole reflectivity range and rms differences reduced by about 5%–10%, except for Z95 . 16 dBZ, where
relationships (1) and (2) slightly outperform the temperature-dependent relationship (3). Using re-lationship (3), the rms difference decreases linearly from 60% at Z95 5 0 dBZ to 30% at Z95 5 15 dBZ,
then, is of about 25%–35% for Z95. 15 dBZ.
Overall, this analysis shows that the nonlinear re-lationship(2)between log(IWC) and Z95should be used
for convective profiles, and the temperature-dependent relationship (3)should be used for stratiform profiles. There is a large reduction of errors in stratiform IWC retrieval when temperature is used as a constraint, ex-cept for the bias in IWCs, 0.8 g m23. The use of tem-perature yields improvement in bias by about 10% for IWCs. 0.8 g m23and in rms difference by about 30% for stratiform profiles over the whole IWC range. c. Comparison with published IWC–Z95relationships
The IWC–Z95 relationships from the HAIC–HIWC
field experiment are for the first time derived from ac-tual measurements of both IWC (including high values)
FIG. 11. As inFig. 4, but for the2208 6 58C temperature slab. FIG. 10. As inFig. 4, but for the2308 6 58C temperature slab.
AUGUST2016 P R O T A T E T A L . 1719
and Z95. It is therefore appropriate to compare these
new relationships with those developed previously in the literature to assess their accuracy, as these earlier relationships have already been extensively used to derive IWC and build cloud climatologies from satel-lite measurements (e.g., Delanoë and Hogan 2010;
Mace 2010; Deng et al. 2013), and to evaluate the representation of cloud microphysics in numerical weather prediction models (e.g.,Illingworth et al. 2007;Bouniol et al. 2010;Delanoë et al. 2011). Below, we describe how these earlier tropical relationships were derived and compare them with the new HAIC–HIWC relationships.
The following relationships have been found in the tropical ice cloud literature: fromFontaine et al. (2014), IWC5 0:098Zm950:805 and (8) IWC5 0:087Z0:775m95; (9) fromA. J. Heymsfield et al. (2010),
IWC5 0:110Zm950:662 and (10) IWC5 0:240Z0:664m95; (11) fromMatrosov and Heymsfield (2008),
IWC5 0:086Z0:920m95; (12) and, fromProtat et al. (2007),
IWC5 0:149Zm950:681 and (13) IWC5 0:198Z0:701m95. (14) Data used to derive theF14relationships were collected almost exclusively in the stratiform region of deep tropical convective clouds over land [West Africa;(8)] and over the Indian Ocean [Maldives;(9)]. The same instrumentation and aircraft platform were used during these and the HAIC–HIWC campaigns, except that there was no bulk IWC measurement available forF14. The relationships
(8)and(9)were obtained by constraining the power-law m(D) relationship with Z95 and in situ microphysical
probe PSD measurements.
The H10 relationship (10) was obtained in convec-tively generated ice clouds during the Cirrus Regional Study of Tropical Anvils and Cirrus Layers–Florida-Area Cirrus Experiment (CRYSTAL-FACE; Jensen et al. 2004) and Tropical Composition, Cloud and Climate Coupling (TC4; Toon et al. 2010) tropical field experiments, which were carried out in Florida and Costa Rica, respectively. From these data a single m(D) relationship was derived using PSD measure-ments and closure with bulk IWC measuremeasure-ments, and Z95has been simulated from the PSD measurements
using Mie calculations. Mostly tropical cirrus clouds generated by deep convection were measured during these experiments. Relationship(12)was also derived in MH08 from the CRYSTAL-FACE dataset and with the same technique as that presented in H10. However, only Z95. 0 dBZ data were included in the
IWC–Z95power-law fit. Relationship(11)fromH10
uses the same technique applied to the NASA Afri-can Monsoon Multidisciplinary Analyses (NAMMA;
Zipser et al. 2009) dataset. Most data were collected in tropical stratiform clouds and in the vicinity of deep tropical convective cores off the coast of West Africa.
Finally theP07relationships(13)and(14)were obtained from a very large dataset of PSD measurements compiled from several campaigns conducted in the midlatitudes and in the tropics. This dataset includes a large variety of ice clouds, from thin cirrus to stratiform ice. TheBrown and Francis (1995) m(D) relationship was assumed for all clouds. The quantity Z95 was calculated from the PSD
measurements assuming spherical particles, but with a re-fractive index corrected following Oguchi (1983). Re-lationship(13)was obtained from the whole dataset, while relationship(14)was obtained using only the tropical data. These relationships are all displayed in linear (Fig. 16a) and logarithmic (Fig. 16b) scales, together
with the HAIC–HIWC relationships: in(1)for all pro-files, in(6)for convective profiles, and in(7)for strati-form profiles. Each relationship is drawn only within the IWC range that was used to derive them, either simu-lated from the PSDs or measured by a bulk IWC probe. Interestingly, the convective and stratiform relation-ships derived from the HAIC–HIWC dataset are bounded by theH10 relationships (10) and(11). For Z95 . 10 dBZ, the lowest IWCs are produced by
re-lationship(10), which indicates that the IWCs in tropi-cal cirrus are much lower for a given Z95than IWCs closer
to the convective cores. Using the equivalent-melted
diameter Deqas the definition of the diameter of the ice
crystals (e.g.,Delanoë et al. 2005;Delanoë et al. 2014), Z95
is proportional to a higher moment of the PSD (sixth moment under the Rayleigh scattering approximation, slightly lower and variable in non-Rayleigh scattering sit-uations) than IWC (third moment), where the nth moment of the PSD is defined as Mn5
Ð
N(Deq)Dneq dDeq. In other
words, IWC is less sensitive to size than Z95. The
ob-servation of larger IWCs closer to the convective cores for a given Z95therefore indicates that the total number
of ice particles is much larger near convective cores than in stratiform regions and cirrus layers detrained farther
FIG. 13. As inFig. 2a, but for (a) convective and (b) stratiform profiles.
AUGUST2016 P R O T A T E T A L . 1721
away from these convective cores. This has been vali-dated in Fig. 6for convective and stratiform profiles; however, not enough samples were collected in the cirrus layers to include tropical cirrus results in the present study. This systematically higher total number of small ice particles close to the convective cores for a given Z95is consistent with one of the main hypotheses
put forth to explain the apparent lack of pilot aware-ness of impending ice crystal icing events, namely that a relatively small size of the ice crystals in a high-IWC environment would result in a low pilot X-band radar reflectivity that would be insufficient to warn of high-IWC conditions ahead, given the relatively high minimum threshold of a pilot radar (nominally 20 dBZ) (e.g.,Mason et al. 2006).
It is also clearly observed inFig. 16that theF14 re-lationships (8) and (9) produce IWCs that are very similar to the general HAIC–HIWC relationship (1)
and the stratiform HAIC–HIWC relationship(7), re-spectively. The F14 relationships were obtained in tropical stratiform anvils in two very different large-scale environments and over different underlying sur-faces (end of the West African monsoon season over land vs weakly forced oceanic convection in the Indian Ocean). In practical terms, this result suggests that the variability of the IWC–Z95 relationship in tropical
stratiform anvils as a function of the underlying surface
(land versus ocean) cannot be neglected and should be studied further. This is consistent with the reported morphological and microphysical differences of these stratiform regions along the tropical belt in Cetrone and Houze (2009).
In contrast, the P07 tropical relationship (14) is found to produce much larger IWCs than the HAIC– HIWC relationships, including the convective HAIC– HIWC relationship(6), although the dataset used in
P07does not include any measurement in convective clouds. This result suggests that theP07relationship
(14)likely overestimates IWC. This may be related to the use of the Brown and Francis (1995) m(D) re-lationship, which was later found to overestimate the mass of ice crystals and to fail to capture dependences on temperature and particle size that are a result of the complex ice microphysical processes (H10). In contrast, theP07relationship(13)obtained using the whole dataset including midlatitude stratiform ice clouds produces IWCs closer to the general HAIC– HIWC relationship (1) for Z95 . 10 dBZ, but
pro-duces much larger IWCs for Z95, 10 dBZ [similar to
the HAIC–HIWC convective relationship (6)]. This overestimation is also probably due to the choice of theBrown and Francis (1995)m(D) relationship.
The only dataset other than HAIC–HIWC that in-cludes data close to the convective cores is the NAMMA
FIG. 14. As inFig. 4, but for convective profiles.
FIG. 15. As inFig. 14, but for stratiform profiles.
dataset, although the maximum values reported in this experiment did not exceed 2 g m23, possibly because of instrumental limitations. The IWC–Z95relationship(11)
derived from the NAMMA dataset appears to pro-duce IWCs larger than the convective HAIC–HIWC relationship(6)in this IWC range.
MH08only included reflectivities larger than 0 dBZ in an attempt to mitigate the departures from the power-law shape of the IWC–Z95 relationship when
fitting a power law using the whole IWC range. As
observed inFig. 16, theMH08relationship tends to produce lower IWCs than the general [(1)] and con-vective [(6)] HAIC–HIWC relationships for Z95 ,
6 dBZ and Z95 , 12 dBZ, and produces consistent
results with the HAIC–HIWC convective relation-ship(6)between 1 and 2 g m23. However, theMH08
study does not include any IWC values larger than 2 g m23. Extrapolating the MH08relationship above 2 g m23is not recommended, as it would result in large overestimations of high IWCs. It is a major added
FIG. 16. Comparison between the HAIC–HIWC relationships and selected relationships from the literature in the tropics on (a) linear and (b) logarithmic scales. See text for details.
AUGUST2016 P R O T A T E T A L . 1723
value of the HAIC–HIWC relationships that they are constrained with measured bulk IWC values exceeding 2 g m23.
5. The vertical distribution of IWC within and around tropical convective cores
One of the primary objectives of the HAIC–HIWC campaign is to characterize the microphysical properties of regions of high IWC produced by deep convective systems and the processes responsible for the formation and maintenance of these regions (Strapp et al. 2016a). Quantitative information about the 99th percentile of the IWC as a function of the distance scale will also be derived from the IKP2 reference IWC measurements at flight altitude in coming studies in order to validate a new ice crystal regulatory envelope (Government Printing Office 2010, appendix D;EASA 2011, appendix P) that has recently become law. The radar-derived IWC dataset has the potential to greatly expand the in situ TWC dataset collected by the IKP2 and therefore the amount of data possibly available for the assessment of the regulatory ice crystal envelope. Although the radar dataset has been demonstrated to contain increased uncertainty relative to in situ measurements, it is hoped that the much larger combined radar–in situ dataset may help reduce the statistical uncertainty of the results from an in situ–only analysis, as well as filling in additional altitudes that have been undersampled by in situ mea-surements as a result of practical limitations. Below, we examine some preliminary results of remotely detected
IWCs from the RASTA radar as a demonstration of how such results could be used to augment in situ measure-ments after a careful analysis of the data suitability.
Vertical profiles of radar-derived IWCs at ;200-m scale from the HAIC–HIWC dataset matched with ambient temperatures from the European Centre for Medium-Range Weather Forecasts (ECMWF) rean-alyses were assembled to characterize for the first time the vertical distribution (or temperature dependence) of high IWC in deep tropical convective clouds. Unlike the reference IKP2 probe, the RASTA airborne cloud radar measured radar reflectivity above and below the aircraft at 60-m vertical resolution, which allows for a first analysis of the vertical distribution of IWC in a high-IWC environment in our dataset over the whole tropo-sphere. It must be noted that RASTA reflectivities are not corrected for attenuation to produce Fig. 17. Un-derestimations of IWC are therefore expected for ver-tical profiles that include graupel, in which W-band attenuation is expected to be large. However, graupel produce high X-band pilot radar reflectivity (30 dBZ or more), which does not correspond to HIWC conditions thought to cause engine events (e.g.,Mason et al. 2006;
Strapp et al. 2016a).
Errors associated with the use of ECMWF tempera-tures have also been estimated by comparing flight-level temperature measurements. The bias is 0.208C and the rms difference is 0.748C. When examining only the convective profiles (stratiform profiles), the bias and rms differences are 0.278 and 0.778C (0.198 and 0.748C), re-spectively. In light of these results, in order to estimate
FIG. 17. Joint radar-derived IWC–T distribution for (a) all profiles, (b) convective profiles, and (c) stratiform profiles from the HAIC–HIWC field experiment. Probability distributions are normalized in such a way that frequencies sum to 1 in each temperature slab.
the maximum IWC error due to temperature errors when using the IWC–Z95–T relationship, we have considered a
maximum 18C systematic overestimation, applied our relationship every 58C in the interval from 2108 to 2508C with or without the overestimation, and picked the maximum error produced. The maximum IWC error was less than 3% over the [210, 20] dBZ range. In other words, the ECMWF temperature errors translate into negligible errors on the IWC retrieval using the proposed IWC–Z95–T relationship.
The statistical distribution of radar-derived IWC as a function of temperature is shown inFig. 17a. The results indicate that the probability of encountering large values of IWC increases with decreasing temperature up to2358C. At 2358C, an IWC value of 4 g m23was found in 1% of the samples. This frequency of occurrence then quickly dropped for temperatures colder than2358C. Values of IWC exceeding 4 g m23 (5 g m23) were not detected at all at temperatures of 2508C (2358C) or colder in our radar dataset, which suggests that these values may be rare. Separating these probabilities for convective and stratiform profiles (Fig. 17) using the convective–stratiform separation technique described in section 3b, IWC values greater than 4 g m23 were ex-clusively found in convective profiles at all tempera-tures. IWC values greater than 3 g m23were also almost exclusively found in convective profiles and at temper-atures colder than 2258C. Interestingly, an enhanced frequency of high IWC at the level from2108 to 258C is also found in these convective profiles (Fig. 17b). This2108C level is known to be important for micro-physical growth processes, including ice particle growth from supercooled liquid water in convective updrafts and potentially ice multiplication–splintering through the Hallett–Mossop process (Hallett and Mossop 1974) and other secondary ice formation mechanisms. As dis-cussed previously, PSDs in the2108C layer are clearly
characterized by a large increase in the number of ice crystals smaller than 0.1 mm (Fig. 6), which is consistent with secondary ice production in that specific layer.
The highest priority temperature interval for the avi-ation regulatory interests is the 2508 6 58C interval (Strapp et al. 2016a), as it corresponds to the typical cruise altitude for many commercial aircraft. At the2508C level our radar IWC statistics indicate that values greater than approximately 1.5 g m23 were only found in convective profiles (according to the radar re-trievals) during the Darwin 2014 HAIC–HIWC experi-ment. Practically, this important result suggests that future research should focus on developing convective– stratiform indices from geostationary satellites to detect high IWC and mitigate the high-IWC threat to civil aviation at this flight level.
The IWC statistics of the2508 6 58C temperature interval derived from the entirety of the radar-derived IWC profiles are next compared to radar-derived IWCs at flight level from only the 2508 6 58C temperature interval flight segments, using the same IWC–Z95
re-lationship. Assuming that there is no bias in the nature of the flight segments executed at the other levels rela-tive to those at2508C (i.e., the clouds and cloud regions sampled at other altitudes are similar to those com-prising the2508C in situ dataset), and that there are no unidentified range-dependent errors in the radar IWC estimates, the differences in IWC PDFs are most likely due simply to the number of samples.Figure 18shows the PDFs of IWC as a function of temperature for this temperature interval. The solid lines inFig. 18are the PDFs derived from the whole vertical profiles of IWC, and the dashed lines are the PDFs derived from the radar-derived IWCs at flight altitude. The flight-level PDFs are found to match the reference PDFs well down to the 0.1% frequency level, with a slight overestimation of the frequency of occurrence of IWCs of 2–3 g m23in
FIG. 18. PDFs of IWC derived from the whole radar vertical profiles (solid) and from the radar retrievals for flight level2508 6 58C (dashed) when (a) all profiles, (b) only convective profiles, or (c) only stratiform profiles are included.
AUGUST2016 P R O T A T E T A L . 1725
the convective profiles, along with an underestimation of the frequency of IWCs larger than 0.7 g m23in the stratiform profiles.Figure 18a–calso show that the PDFs at flight level are truncated at frequencies lower than about 0.1%. Since the regulatory objective is to derive 99th percentile values of IWC, this example analysis would suggest that the HAIC–HIWC in situ dataset should be sufficient to achieve this goal.
6. Conclusions
Unprecedented bulk measurements of ice water content up to about 5 g m23 collocated with 95-GHz radar reflectivities were used in this study to analyze the IWC–Z95relationship and its variability as a function of
temperature and the nature of convection (convective vs stratiform). The unique aspect of this work is that, unlike past studies, these relationships do not include any as-sumptions about the statistical relationship between crystal mass and maximum dimension or any errors arising from scattering calculations of Z95from particle
size distributions. It is also the first study to include measured IWC values greater than about 2 g m23and up to about 5 g m23.
Our results indicated that using a single power-law IWC–Z95relationship allows for the radar retrieval of
IWC with ;(10%–30%) bias and 40%–70% rms dif-ference, depending on IWC. The IWC is also found to be underestimated by about 10%–20% for reflectivities lower than 15 dBZ, but is largely overestimated for re-flectivities larger than 15 dBZ, which is attributed to non-Rayleigh scattering effects distorting the relation-ship between IWC and Z95at large Z95. A nonlinear
relationship between log(IWC) and Z95 has therefore
been developed, which allows for IWC retrievals with biases less than 20% and rms differences of 20%–35% for Z95. 15 dBZ.
We then showed that the temperature variability of the IWC–Z95relationship was large and that
tempera-ture could be used as an additional constraint to further reduce uncertainties on radar-derived IWCs, except when Z. 16 dBZ for temperatures lower than 2258C, where the nonlinear relationship between log(IWC) and Z95largely outperforms the temperature-dependent
relationship. This variability with temperature has been clearly linked to and is consistent with the nat-ural temperature variability of PSDs measured during the HAIC–HIWC campaign. Our variability study also shows that the nonlinear relationship(2)between log(IWC) and Z95should be used for convective
pro-files, and the temperature-dependent relationship (3)
should be used for stratiform profiles to minimize IWC retrieval errors.
The radar results will be combined with those from a second just-completed flight program, and then examined for suitability in augmenting in situ IWC data collected for a future assessment of new aircraft certifi-cation rules for flight in ice crystals. Some preliminary results from the Darwin flight campaign related to these aviation objectives are reported upon here. Using all profiles collected during the field experiment (72 flight hours), a joint frequency distribution of radar-derived IWC and temperature within and around deep tropical convective cores was constructed. The results showed that IWC values greater than 4 g m23on ;200-m-distance scales were exclusively found in convective profiles at all temperatures, and IWC values greater than 3 g m23 were also almost exclusively found in convective profiles and at temperatures colder than2258C. At the 2508 6 58C level, which is the cruise level of many commercial jet aircraft, IWC values greater than 1.5 g m23 were exclusively found in con-vective profiles during the HAIC–HIWC experiment. This result suggests that future efforts should be directed toward the development of a convective–stratiform in-dex from geostationary satellites in order to detect and mitigate this type of high-IWC threat to civil aviation at this flight level. Nevertheless, it must be noted that re-cent analyses have highlighted that in-service engine events are most often associated with traverses across large convective anvils, suggesting that long exposures to moderate values of IWC may be as important as short exposures to high IWC. More studies will be needed to address this potentially different type of HIWC environment.
Acknowledgments. This research has received funding from the Federal Aviation Administration, Aviation Research Division, and Aviation Weather Division, un-der Agreement CON-I-2901 with the Australian Bureau of Meteorology. The research was also conducted as part of the European Union’s Seventh Framework Program in research, technological development, and demonstration under Grant Agreement ACP2-GA-2012-314314, and the European Aviation Safety Agency Research Pro-gram under Service Contract EASA.2013.FC27. Funding to support the development and testing of the isokinetic bulk TWC probe was provided by the FAA, NASA’s Aviation Safety Program, Environment and Climate Change Canada (formerly known as Environment Can-ada), and the National Research Council of Canada. Funding for the Darwin flight project was provided by the EU Seventh Framework Program agreement and the EASA contract noted above, the FAA, NASA’s Avia-tion Safety Program, the Boeing Company, Environment and Climate Change Canada, and Transport Canada.