HAL Id: insu-02957308
https://hal-insu.archives-ouvertes.fr/insu-02957308
Submitted on 10 Nov 2020
HAL is a multi-disciplinary open access
archive for the deposit and dissemination of
sci-entific research documents, whether they are
pub-lished or not. The documents may come from
teaching and research institutions in France or
abroad, or from public or private research centers.
L’archive ouverte pluridisciplinaire HAL, est
destinée au dépôt et à la diffusion de documents
scientifiques de niveau recherche, publiés ou non,
émanant des établissements d’enseignement et de
recherche français ou étrangers, des laboratoires
publics ou privés.
Distributed under a Creative Commons Attribution| 4.0 International License
at passive margins
A. Auzemery, E. Willingshofer, Philippe Yamato, Thibault Duretz, D.
Sokoutis
To cite this version:
A. Auzemery, E. Willingshofer, Philippe Yamato, Thibault Duretz, D. Sokoutis. Strain localization
mechanisms for subduction initiation at passive margins. Global and Planetary Change, Elsevier,
2020, 195, pp.103323. �10.1016/j.gloplacha.2020.103323�. �insu-02957308�
Contents lists available at ScienceDirect
Global and Planetary Change
journal homepage: www.elsevier.com/locate/gloplacha
Strain localization mechanisms for subduction initiation at passive margins
A. Auzemery
a,⁎, E. Willingshofer
a, P. Yamato
b,c, T. Duretz
b, D. Sokoutis
a,d a Faculty of Geosciences, Department of Earth Sciences, Utrecht University, Netherlandsb Université de Rennes, CNRS, Géosciences Rennes, UMR 6118, Rennes, France c Institut Universitaire de France (IUF), France
d Department of Geosciences, University of Oslo, Oslo, Norway
A R T I C L E I N F O Keywords:
Subduction Initiation
Numerical and analogue modelling Rheology
Passive margins Weakening mechanisms
A B S T R A C T
It is widely accepted that subduction initiation at modern Earth passive margin systems critically depends on the buoyancy and strength of the oceanic lithosphere and requires failure of the load-bearing crustal and mantle layers. As such, subduction initiation upon orthogonal convergence is controlled by the age of the oceanic lithosphere and thus the strength contrast at the margin. However, it is still unclear where along the margin and how subduction initiates. In particular, rheologically-controlled mechanisms are poorly understood and require further investigation. Therefore, this combined analogue and numerical modelling study aims at exploring the effects of first order rheological and kinematic conditions on subduction initiation at passive margins. Our results highlight the sensitivity of early stages of subduction initiation to the initial rheological setup as well as evolving thermo-mechanical feedback mechanisms. Additionally, they provide more insights on the conditions re-sponsible for the locus of subduction initiation. We infer that the locus of subduction is controlled by the rheology of both the crust and the mantle lithosphere at the margin, which is in strong correlation with the thermal age of the oceanic lithosphere. Suitable conditions for subduction initiation at passive margins corre-spond to an intermediate age (ca. 80 Myr) of the oceanic lithosphere. In all other cases deformation localizes within the oceanic lithosphere or affects the entire continent. We advocate the significance of crust-mantle decoupling at the passive margin for its inversion and possible evolution towards a subduction zone. Additionally, the development of a self-sustaining subduction zone will fail in the absence of weakening me-chanisms taking place in the mantle lithosphere such as thermal softening (shear heating) and low temperature plasticity (Peierls mechanism).
1. Introduction
Although subduction initiation at passive margin is lacking direct observations, several subduction zones are believed to have been
formed at continental margins (Hall, 2019; Karig, 1982; Manzotti et al.,
2014; Marroni et al., 2017). Inverted margins possibly reflect early stages in the process of subduction initiation and several examples (Pedoja et al., 2011; Yamato et al., 2013) promote the idea that the difference in strength between the oceanic and continental lithosphere may be critical for initiating subduction. Hence, rheological and density contrasts between the oceanic and continental lithospheres have been
considered as key parameters for subduction initiation (SI) (Baes et al.,
2018; Cloetingh et al., 1989; Erickson, 1993; Faccenna et al., 1999; Goren et al., 2008; Mart et al., 2005; Nikolaeva et al., 2010; Hamai et al., 2018; Yamato et al., 2013). Although these studies used different
approaches, they consistently emphasize that the aging of the oceanic plate is key for providing favorable mechanical conditions for SI at passive margins. In the case of a young passive margin, the strength contrast required at the continent-ocean transition (COT) is not enough and intra-oceanic subduction and obduction is then likely to happen (Duretz et al., 2016a; Gülcher et al., 2019; Maffione et al., 2015; Zhong and Li, 2019). For older oceanic lithosphere, SI at passive margins re-quires additional deformation mechanisms such as flow in the
con-tinental lower crust (Nikolaeva et al., 2010). This causes deformation of
the ductile crust at the margin and deflection of the oceanic lithosphere. Aging of the oceanic plate does not only regulate the strength of the lithospheric mantle at passive margins but also leads to increased
me-chanical coupling between the oceanic and continental plate (Cloetingh
et al., 1989; England and Wortel, 1980; McKenzie, 1977; Mueller and Phillips, 1991). Consequently, most attempts of analogue and
https://doi.org/10.1016/j.gloplacha.2020.103323
Received 8 May 2020; Received in revised form 4 September 2020; Accepted 14 September 2020
Abbreviation: Subduction initiation, SI; Continent-ocean transition, COT; Bulk shortening, BS
⁎Corresponding author.
E-mail address: [email protected] (A. Auzemery).
Available online 22 September 2020
0921-8181/ © 2020 The Authors. Published by Elsevier B.V. This is an open access article under the CC BY license (http://creativecommons.org/licenses/BY/4.0/).
numerical modelling of subduction initiation required a weak litho-spheric mantle or a pre-existing weak-zone in the litholitho-spheric mantle (Faccenna et al., 1999; Mart et al., 2005; Nikolaeva et al., 2010). More recent studies mention necessary convergent forces to initiate induced
subduction initiation (contrary to spontaneous SI, Stern, 2004) in the
absence of weak zone in the mantle lithosphere, without detailing
rheological mechanisms (Zhong and Li, 2019). Additionally, it has been
shown that mechanisms that reduce the strength of the lithospheric
mantle such as Peierls creep in olivine (Crameri and Kaus, 2010; Drury,
2005; Korenaga and Korenaga, 2016), grain size reduction (Ricard and Bercovici, 2009) or shear induced thermal softening (Duretz et al., 2016a; Jaquet and Schmalholz, 2018; Kiss et al., 2020; Thielmann and Kaus, 2012) are important for the development of large-scale shear zones, which are precursor structures of future subduction plate inter-faces. On one hand Peierls creep mechanism of olivine strongly reduces the brittle strength in the uppermost strong mantle lithosphere and may be responsible for softening and localization of deformation (Kameyama et al., 1999). On another hand, thermal softening enables shear localization in rocks deforming under temperature-sensitive creep (Duretz et al., 2016a; Jaquet and Schmalholz, 2018; Kiss et al., 2020; Thielmann and Kaus, 2012).
In contrast to previous studies, we investigate rheologically con-trolled mechanisms that can be responsible for strain localization in the case of induced subduction initiation at passive margins, in the absence of pre-defined weak zones. Our combined physical analogue and nu-merical modelling approach inquires the role of the mechanical strati-fication of ocean-continent transition and associated lateral strength contrasts at various depth levels within the lithosphere for incipient stages of SI. In particular, we document the significance of decoupling horizons for inverting the passive margin and explore the role of Peierls creep deformation and shear heating for the development of shear zones that might become subduction interfaces.
2. Modelling approach
2.1. General concept and modelling setup
In this work, analogue modelling provides simple high-resolution 3D outputs of crust and lithosphere geometries, which facilitate inter-pretation of complex geological scenarios, whereas numerical model-ling allows exploring temperature driven feedback mechanisms. To ensure a meaningful complementary use of both methods we scaled the experiments to obtain, within limits, similar geometrical and
mechan-ical conditions at the onset of shortening (Fig. 1).
Through both approaches we simulate contraction of a continent- ocean transition as a consequence of far-field forces or forces arising
from an existing subduction system (Marques et al., 2014), a mid-ocean
ridges (Pascal and Cloetingh, 2009) and/or from mantle flow (Baes
et al., 2018; Yamato et al., 2013). The initial geometric setup of the analogue and numerical experiments consists of an oceanic, a
con-tinental and a wedge shape transitional lithosphere in between (Fig. 1a
& b). The latter represents the thinned continental lithosphere at the passive margin and will subsequently be referred to as “margin”. The mechanical stratigraphy of the models is characterized by an alterna-tion of brittle and viscous layers. Four in the case of continental (brittle- ductile-brittle-ductile) and two in the case of oceanic lithosphere
(brittle-ductile), respectively (Burov and Watts, 2006). Key element is
the decoupling of the continental crust from the underlying mantle li-thosphere along a viscous layer that wedges out towards the continent-
ocean transition (Fig. 1a & b). The margin's crust is tapering off towards
the oceanic lithosphere at an angle of ~5°, which falls within the range of natural examples (e.g. 4–10° the case of the Angolan margin). The wedge shape geometry of the crust at the passive margin implies that this domain coincides with the largest lateral strength gradients (Fig. 1b). Conversely, in all our models, the strength of the lithosphere at passive margins is lower than in the ocean. Similar strength
variations are predicted for natural examples (Maystrenko and Scheck-
Wenderoth, 2009). The length scale of the margin (150 km) is chosen to be representative for natural cases, which typically range between 60
and 400 km (Bauer et al., 2000; Osmundsen and Redfield, 2011;
Unternehr et al., 2010).
In our models, the strength of the lithosphere is controlled by its
thermal age, simulated using different plate thicknesses (Fig. 2 c). The
temperature and composition of the continental lithosphere is kept constant and a linear interpolation is applied between the base of oceanic and continental plate. Hence, by testing variable ages of oceanic lithosphere in the experiments, it is possible to investigate the impact of passive margins rheology on SI.
2.2. Analogue modelling specificities
The experiments were scaled according to the principles of
geo-metric, kinematic, rheological and dynamic similarity (Hubbert, 1937;
Ramberg, 1981; Weijermars and Schmeling, 1986; Sokoutis et al., 2000; Sokoutis et al., 2005) following the approach described in section 2.4. The calculation of the strength envelope is described in appendix A. The
model geometry and properties of the materials are displayed in Fig. 1
and listed in Table 1.
The models were built inside a 36 cm wide, 45 cm long and 15 cm deep tank of transparent Plexiglas. Since 1 cm in the model is equiva-lent to 30 km in nature, the dimensions of the natural prototype are 1080 km × 1350 km × 450 km. The resolution of the presented analogue experiments accounts for the first-order rheological layering of the lithosphere. Each experiment is carried out with a constant rate of deformation, which is applied through movement of a wall that si-mulates a necessary horizontal force to maintain this deformation rate. In the series of models presented, the convergence velocities have been set to 0.5 cm/h.
Brittle crustal and mantle layers exhibiting Mohr-Coulomb type behaviour are represented by layers of dry feldspar and quartz sand,
respectively (see Willingshofer et al., 2018 for a detailed description of
material properties). Sieved feldspar and quartz sand exhibit different densities and are used to simulate the crust and the mantle,
respec-tively. Mixtures of silicone putty with fillers like sand and BaSO4
re-present ductile layers. The addition of sand is required to reach suitable
densities whereas the BaSO4 is used to increase the viscosity. To
facil-itate the placement of the lithosphere on top of the asthenosphere the silicon putties were chosen to be quasi-Newtonian.
We do not impose lateral changes in rheology in the lithospheric mantle in order not to prescribe the locus of deformation. As such the ductile lithospheric mantle layers are homogenous in thickness and composition under both the continental and oceanic crust. This as-sumption allows for addressing the mechanical effects of the thermal
age of the lithosphere at passive margins (Fig. 2c) by varying the
strength of the ductile and brittle layers in the lithospheric mantle.
2.3. Numerical modelling specificities
Thermo-mechanical models were used to simulate the shortening of a visco-elastic-plastic lithosphere. We use the two-dimensional (2D)
finite-difference, marker-in-cell code (MDoodz; Duretz et al., 2016b) to
solve the equations of momentum and mass conservation, as well as the heat equation. For details regarding the mathematical model and al-gorithms, see Appendix B. Deformation is governed by frictional, dis-location, diffusion and Peierls creep equations. The heat equation
in-cludes the effect of shear heating (Qsh) and radiogenic heat production
(Qr). The presented models do not account for any predefined strain
softening parameterization.
Similarly to the analogue approach, the numerical thermo-me-chanical models were designed based on a 2D initial setting inspired
from the Angolan margin (Unternehr et al., 2010). The behaviour of the
displayed in Table 2. The model consists of a two-layer continental li-thosphere made of a 35 km crust and a lithospheric mantle with a
thermal thickness (HL) of 150 km. The oceanic lithosphere consists of
an 8 km crust and a lithospheric mantle and has a thermal thickness that depends on its age. Dry granite, dry olivine and dry diabase rheology are used for the continental crust, the mantle lithosphere and
the oceanic crust, respectively (Table 2). To obtain a rheology of the
oceanic lithosphere depending on the thermal age (aL), the thermal
base can be approximated by using the half-space cooling function, which writes: = = HL 2erfc (1 T) t c1 aL (1) And, = = q0 2kTm/ t c2/ aL (2) So, = H c c q L 1 2 0 (3)
By assuming that the thermal base experiences 20% of temperature anomaly with respect to the temperature in the mantle (ΔT = 260K)
and a thermal diffusivity of χ = 10−6 m2.s−1, =c 14 500 m. Myr
1 12
and =c2 473 mW. m . Myr2 12(Artemieva, 2011). The half-space cooling
model successfully explains the observed heat flow and bathymetry for
ocean floor younger than 80 Myr (Turcotte and Schubert, 2014).
However, this model fails to predict the thickness of the lithosphere at old ages (> 80 Myr) where lithosphere thickness approaches an equi-librium, time-independent thermal structure. To resolve this issue, the
aL is better constrained by using another variable depending on the
surface heat flow. We used the model defined by Cheng (2016) which
fits the age of the sea floor with q0 (in mW. m−2) at the surface:
=
q01 433.63aL 0.445for young oceanic lithospheres
And
=
q02 224.03aL 0.307for old oceanic lithospheres
And we chose
= > = <
q a0( )L q01whenq01 q02and ( )q a0 L q02whenq01 q02 (4)
By using this method, the base of the lithosphere as a function of age follows the same trend of the half-space cooling model for age < 80
Myr, but subsequentially plateaus off for ages > 80 Myr (Fig. 2c).
The model domain is a section of 2000 × 600 km and the numerical resolution is 500 m in both dimensions. The model top boundary is a
true free surface (Duretz et al., 2016b). A constant normal velocity is
applied at the left boundary of the model (|Vin| = 1 cm/yr) from the
Fig. 1. Model setups, (a) analogue and (b) numerical, in 2D sectional view illustrating geometric, rheologic and kinematic conditions at the onset of shortening. Black arrow shows the directions of outflow (-Vout) and the velocity applied at the left boundary of the models (+Vin). Strength envelopes of the continental lithosphere are shown on the right side of the section. The zoom in (b) shows details of the differential stress. The drop in strength highlight the decoupling between the
continental crust and the mantle at the margin. Stresses were computed using parameters displayed in Table 1 at a strain rate of 10−15 s−1. Layering in the
surface to a depth of 200 km. In order to satisfy mass conservation, an
outflow velocity (Vout) is distributed at the base of the model and on the
sides from 200 km deep to the base of the box (Fig.1b, Hout1, 2, 3). The
outflow is proportionally distributed over the length of each boundary:
=
VinHin Vout Hout (5)
The initial geotherm is computed assuming steady state and
ac-counts for different radiogenic heat productions in each layer (Table 2)
and a constant asthenosphere temperature of 1350 °C. The resulting temperature at the continental Moho is ~425 °C. We consider the mechanical base of the lithosphere as the base of the lithosphere that
can support stresses (Cloetingh and Burov, 1996; Burov and Diament,
1995). The mechanical of the lithosphere is set at the 950 °C isotherm
which fits with the base of the strength envelope. Density contrasts between a mature oceanic lithosphere and the adiabatic mantle range
between 40 and 80 kg.m-3,(Afonso et al., 2007; Schubert et al., 2001).
For this reason, a density contrast of 60 kg.m-3 is implemented between
the lithospheric mantle above the mechanical lithosphere and the asthenosphere below it to create negative buoyancy of the oceanic li-thosphere. In our study this density contrast is assumed to be constant and we refer to Faccenna et al., (1999) and Mart et al., (2003) who
discuss the importance of vertical and lateral (Maystrenko et al., 2013)
density variations for the initiation of subduction zones at passive margins.
2.4. Combined approach
Relevant scaling relationships between the natural prototype and the analogue model were obtained by keeping the average strength of the ductile layers correctly scaled with respect to the strength of the
brittle layers and the gravity forces (Brun, 1999; Hubbert, 1937;
Ramberg, 1981; Weijermars and Schmeling, 1986). Since inertia forces
are negligible in geological processes under investigation (Hubbert,
1937; Ramberg, 1981) the characteristic stress ratio σ* respects the conditions σ* = L*ρ* where (*) refers to model/prototype ratios of
stress (σ), length (L) and density (ρ) (Dombrádi et al., 2010). The
ex-periments are geometrically scaled by a length scale factor of 3.33 10−7
so that 1 cm in the model corresponds to 30 km in nature. Density is scaled based on the brittle oceanic lithosphere. The stress ratio is then
calculated using the density ratio between the sand (ρqs) and the layer
in nature (ρoc) (also used in numerical modelling) and the length ratio.
= qsg L
oc (6)
To respect the stress ratio, we adapt the material in our analogue models by scaling the stress envelops obtained in our numerical models using flow laws parameters derived from laboratory experiments (i.e., plastic, exponential-dislocation-diffusion creep). Thus, for a given age of the oceanic lithosphere, the strength and thickness of the ductile and Fig. 2. (a) Strength profiles illustrating rheological layering of a 70 Myr oceanic lithosphere and the deformation mechanism implemented in the numerical study. Extrapolated strength envelops computed for the analogue model 6 by using scaling approach described in section 2.4. BDT refers to the brittle-ductile transition. (b) Graph showing the parameter space explored by the analogue and numerical models as a function of mean ductile and mean brittle differential stress of the oceanic
lithosphere. Analogue models set 1 and set 2 address the influence of the ductile and brittle strength of the oceanic lithosphere, respectively. ∆σ and are the
differential stress and the mean differential stress. (c) Strength profiles for different oceanic lithospheres tested as function of age and thermal structure. The mechanical strong part of the lithosphere (in blue) is used as proxy for the thickness of the brittle layer and the yellow one for the thickness of the ductile layer in the analogue experiments. The red envelopes represent the strength for the analogue model 5, 6 and 7. (For interpretation of the references to colour in this figure legend, the reader is referred to the web version of this article.)
brittle layers used in analogue models must reflect the strength and thickness of the respective layers used in our numerical models (Fig. 2c). As the brittle strength is function of normal stress, the dif-ferential stress increases linearly with depth and the brittle layers are scaled to brittle layer thicknesses in nature.
However, for the ductile layer, temperature-dependent rheology makes scaling of stress more intricate. As the analogue model presented in this study is isothermal, the ductile layer strength is constant and need to be set to approximate strength profiles of the ductile lithosphere in nature. A good approximation is to consider the mean strength of the ductile layer over its thickness. From the strength envelopes calculated for our numerical models, the mechanical base (hm) of the lithosphere represents a suitable lower boundary for the ductile layer. However, the location of the brittle-ductile transition remains unclear. By setting the stress boundary at the base of the brittle layer for compression, the overall mean strength of the ductile layer is unreasonably strong. For this reason, we consider the semi-brittle domain where the exponential creep (Peierls) strain is active as the domain where the brittle-ductile
transition occurs (Aharonov and Scholz, 2019). The brittle-ductile
transition (BDT) for our analogue model is then chosen as the middle of
this domain (Fig. 2a, grey area). We reckon that this approximation is
more realistic as it reduces the strength of the mantle lithosphere and accounts for an intermediate mixed mode of deformation in nature.
The mean ductile strength is calculated in between the BDT and
the hm as defined above and is then scaled to laboratory scale. A target value for the effective viscosity is calculated using the strain rate of the
experiment (referred as scaled value in Table 3). The material for the
ductile layers was selected by comparing the viscosities of different silicone putties with the target value of viscosity, for a given strain rate (Table 3). As an example (see Fig. 2c), in the numerical model, the mean viscosity in the ductile layer of a 70 Myr lithosphere is about η ≃
1.0 1022 Pa s. Thus, the viscosity ratio is η∗= 9.0 10−18. This yield to a
time ratio =t =6.03 10−11 and so, the 20 h of the experiment
re-presents ~35 Myr in nature, the 0.5 cm/h convergence rate rere-presents ~0.8 cm/yr in nature.
To correlate analogue and numerical experiments, the overall mean strength of the ductile and brittle layer is calculated for both the
ana-logue and numerical models (Fig. 2a). However, as the brittle-ductile
transition is deeper in the analogue models, the mean brittle strength is shifted.
To infer the of role of buoyancy forces with respect to the viscous forces acting on the ductile lithospheric mantle, the buoyancy number
(Bo) is calculated (Fig. 2b). The buoyancy number is the ratio between
the stress induced by the negatively buoyant oceanic lithosphere and the viscous strength of the oceanic lithosphere, as described in Faccenna et al. (1999). = Bo gH ( ) L ductile (7)
With Δρ the density contrast between the lithosphere and the
asthenosphere and HLthe thickness of the lithosphere. To respect the
density ratio, a density difference of 30 kg.m−3 is implemented
be-tween the oceanic lithosphere and the underlying asthenosphere 3. Analogue experiments
In order to investigate favorable parameter combinations for SI, we describe two sets of experiments that document the influence of (1) the strength of the ductile lithospheric mantle, (2) the strength of the brittle oceanic lithosphere, regulated through the thickness of its brittle part. Then, we compare the results with experiments representing an in-crease of the thermal age of the oceanic lithosphere (exp 5, 6, 7), characterized by an increase of the two above-mentioned parameters. This enable us to isolate mechanisms responsible for under-thrusting with respect to the thermal age. Deformation of the experiments is monitored using digital photography and laser scanning of the model
Table 1 Summary of model configurations and material properties per experiment (EXP) together with characteristic properties of natural prototypes. EXP Ocean Brittle lithosphere Continent Brittle crust Continent Ductile curst Continent Brittle lith. Mantle Ductile lith. Mantle Bo Model Nature Model Nature Model Nature Model Nature Model Nature Model Units [cm] [kg/m 3] [km] [kg/m 3] [cm] [kg/m 3] [km] [kg/m 3] [cm] [kg/m 3] [Pa s] [km] [kg/m 3] [Pa s] [cm] [kg/m 3] [km] [kg/m 3] [cm] [kg/m 3] [Pa s] [km] [kg/m 3] [Pa s] Exp1 h = 1.4; ρ = 1500; h = 42; ρ = 3350; h = 0.8; ρ = 1300; h = 24; ρ = 2900; h = 0.4; ρ = 1300; η = 4.6e4; n = 1.08; h = 12; ρ = 2900; η = 5.2e21; n = 1.08; h = 0.5; ρ = 1500; h = 15; ρ = 3350; h = 0.8; ρ = 1500; η = 1.7e4; n = 1.04; h = 24; ρ = 3350; η = 1.8e21; n = 1.04; 1.81 Exp2 h = 1.4; ρ = 1500; h = 42; ρ = 3350; h = 0.8; ρ = 1300; h = 24; ρ = 2900; h = 0.4; ρ = 1300; η = 4.6e4; n = 1.08; h = 12; ρ = 2900; η = 5.2e21; n = 1.08; h = 0.5; ρ = 1500; h = 15; ρ = 3350; h = 0.8; ρ = 1500; η = 5.8e4; n = 1.1; h = 24; ρ = 3350; η = 6.4e21; n = 1.1; 0.63 Exp3 h = 1.4; ρ = 1500; h = 42; ρ = 3350; h = 0.8; ρ = 1300; h = 24; ρ = 2900; h = 0.4; ρ = 1300; η = 4.6e4; n = 1.08; h = 12; ρ = 2900; η = 5.2e21; n = 1.08; h = 0.5; ρ = 1500; h = 15; ρ = 3350; h = 0.8; ρ = 1500; η = 1.4e5; n = 1.4; h = 24; ρ = 3350; η = 1.7e22; n = 1.4; 0.22 Exp4 h = 1.1; ρ = 1500; h = 33; ρ = 3350; h = 0.8; ρ = 1300; h = 24; ρ = 2900; h = 0.4; ρ = 1300; η = 4.6e4; n = 1.08; h = 12; ρ = 2900; η = 5.2e21; n = 1.08; h = 0.5; ρ = 1500; h = 15; ρ = 3350; h = 0.8; ρ = 1500; η = 5.8e4; n = 1.1; h = 24; ρ = 3350; η = 6.4e21; n = 1.1; 0.58 Exp5 h = 0.8; ρ = 1500; h = 24; ρ = 3350; h = 0.8; ρ = 1300; h = 24; ρ = 2900; h = 0.4; ρ = 1300; η = 4.6e4; n = 1.08; h = 12; ρ = 2900; η = 5.2e21; n = 1.08; h = 0.5; ρ = 1500; h = 15; ρ = 3350; h = 0.8; ρ = 1500; η = 5.8e4; n = 1.1; h = 24; ρ = 3350; η = 6.4e21; n = 1.1; 0.42 Exp6 h = 1.4; ρ = 1500; h = 42; ρ = 3350; h = 0.8; ρ = 1300; h = 24; ρ = 2900; h = 0.4; ρ = 1300; η = 4.6e4; n = 1.08; h = 12; ρ = 2900; η = 5.2e21; n = 1.08; h = 0.5; ρ = 1500; h = 15; ρ = 3350; h = 1.1; ρ = 1500; η = 8.4e4; n = 1.2; h = 33; ρ = 3350; η = 9.4e21; n = 1.2; 0.40 Exp7 h = 1.7; ρ = 1500; h = 51; ρ = 3350; h = 0.8; ρ = 1300; h = 24; ρ = 2900; h = 0.4; ρ = 1300; η = 4.6e4; n = 1.08; h = 12; ρ = 2900; η = 5.2e21; n = 1.08; h = 0.5; ρ = 1500; h = 15; ρ = 3350; h = 1.4; ρ = 1500; η = 1.4e5; n = 1.4; h = 42; ρ = 3350; η = 1.6e22; n = 1.4; 0.28 AST. h = 10; ρ = 1470; η = 8e2; n = 1; Here h is the thickness, η is the viscosity, ρ is the density of the layers and n is the stress exponent. Bo is the buoyancy number as detailed in Section 2.4.
surface. The observed deformation pattern as well as the final tectonic internal structure are analysed and interpreted using cross-sections
re-trieved at the end of the experiments (Fig. 3). We use the evolution of
topography to show the spatial and temporal evolution of deformation
and topography at the surface (Fig. 3).
3.1. Effect of lithospheric mantle ductile strength
To simulate the increase in ductile strength at the base of the
li-thosphere with age (Fig. 2a, set 1), the viscosity of silicone putty
re-presenting the lithospheric mantle was increased. The thickness of the brittle layer remained unchanged to isolate the effect of ductile strength. As explained in previous sections, the ductile strength strongly affects the buoyancy of the lithosphere as the viscous strength resists the gravitational normal stress. Additionally, previous studies (Faccenna et al., 1999; Goren et al., 2008) indicate that a buoyancy number higher than one favours subduction initiation. For this reason, we discuss the result of three experiments where the bo is much larger than one (exp1), lower than one (exp2), and much lower than one
(exp3) (Table 1).
Experiment 1 is characterized by a low viscosity lithospheric mantle resulting in a buoyancy number of 1.81. Analysis of surface data shows that the deformation starts within the oceanic lithosphere after 5% of bulk shortening (BS), with the development of a thrust parallel to the
continent-ocean boundary (Fig. 3a). Activity of this fault lead to intra-
oceanic under-thrusting between 5% BS and 10% BS. This stage is marked by the development of a trench which deepens with time. Intra- oceanic thrusting is characterized by an in-sequence change of thrust vergence resulting in vertical stacking and sinking of thrust sheets (Fig. 3a). Subsequent shortening leads to the activation of thrusts 2 and 3, which all surface close to the position of the trench established during early phases of deformation. We note that deformation remains within the oceanic lithosphere throughout the duration of the experi-ment and does not affect the margin. Shear localization is limited in the lithospheric mantle. However, it does not prevent sinking of the brittle blocks and the development of pop-down structures. The frequent changes of thrust polarities impede subduction.
Experiments 2 and 6 are characterized by an intermediate viscosity of the lithospheric mantle and a buoyancy number of 0.63 and 0.40
(Table 1). Overall, they show a similar evolution. In this configuration, deformation initiates at the passive margin, where a series of thrusts
(thrust 1 and 2, Fig. 3b) develops after ca. 5% BS. The cross-sections
reveal that thrust 1 localized at the ocean continent transition, where the ductile lower crust of the margin wedges-out. Subsequently, a continent-ward propagating thrust sequence developed, using the continental ductile crust as a decollement. Coevally, the passive margin is flexed downward, and the flexural basin is flanked on both sides by
bulges (see surface scans at 5% BS in Fig. 3b & 3e). Underthrusting
initiates when the down-flexed passive margin is cut by an evolving major thrust structure that accommodates most of the shortening (fault 3, Fig. 3b). It is marked by the closure of the flexural basin. Only the deformed passive margin moves towards the continent and the thrust system continues to grow in topography (see surface scan at 15% BS). This suggests that the oceanic lithosphere underthrusts the continental margin and the margin is accreted at the subduction fault. For the whole duration of the experiment, deformation is mainly localized at the passive margin, which is affected by strong uplift and subsidence. Again, the cross-sections show that deformation within the viscous mantle lithosphere is distributed, as this layer is enveloping the down- thrust and sinking margin lithosphere. The model evolves in double- sided subduction.
Experiment 3 is characterized by a high viscosity in the lithospheric mantle resulting in a buoyancy number of 0.22. In this case deformation initiates at the boundary between the oceanic lithosphere and the
margin (thrust 1, exp. 3, Fig. 3c). Similar to experiments 2 and 6, a
thrust system develops at the ocean continent boundary that is asso-ciated with flexural basins. The oceanic lithosphere is deflected and underthrusts the continental margin by using the ductile crust as a décollement. However, the final cross-section shows that the high ductile resistance of the lithospheric mantle prevents the continuation of underthrusting. Instead long-wavelength folding (13 cm) affects both oceanic and continental lithospheres, which grow bigger and longer
over time (scans at 10%, 15%, 20% BS, Fig. 3c).
These results show the importance of the ductile strength of the lithospheric mantle, which controls (1) where deformation localizes (at the passive margin or within the oceanic domain) and (2) the extent of under-thrusting of the oceanic lithosphere at the passive margin. We also note that the presence of a ductile continental crust at the margin is Table 2
Rheological and thermal values used for the numerical models. References for rheology are R_95: Ranalli (1995); H_83: Hansen (1983); H&K_03: Hirth and Kohlstedt
(2003); M_98: Mackwell et al., (1998). Peierls mechanisms are described in detailed in the appendices. ρ
(kg.m−3) k (W.m−1.K−1) Qr (W.m−3) Φ (°) A (Pa-n.s−1) n G (Pa) Q (J.mol−1) Reference
Continent crust (dry granite) 2900 2.7 0.8e-6 30 3.1623e-26 2.3 3.0e10 154.0e3 H_83
Strong Lower crust (diabase) 2900 2.7 0.8e-6 30 8.04e-25 3.4 3.0e10 260.0e3 R_95
Ocean crust (diabase) 2900 3 1.0e-10 30 5.0477e-28 4.7 3.0e10 485.0e3 M_98
Mantle lithosphere (dry olivine)
Dislocation creep 3360 3.2 1.0e-10 30 1.1000e-16 3.5 3.0e10 530.0e3 H&K_03
Diffusion creep 1.5000e-15 1.0 375.0e3 H&K_03
Asthenosphere 3300 3.2 1.0e-10 30 1.1000e-16 3.5 3.0e10 530.0e3 H&K_03
Here ρ is the density, k is the thermal conductivity, Qr is the radiogenic heat production, ϕ is the friction angle, A is a pre-factor, n is the stress exponent, G is the shear modulus, Q is the activation energy.
Table 3
Summary of average ductile lithospheric mantle rheological values, laboratory scaled values, and actual values used in the experiments. Three experiments were
selected to represent oceanic lithosphere with various thermal ages (first column). The values represent the mean strength and the mean viscosity of the ductile
lithospheric mantle, computed with the scaling approach described in section 2.4. Scaled values were calculated using the stress and viscosity ratio.
Id ( )ductile(Pa) (Pa s)
Nature Analogue Nature Scaled values Experiments Nature Scaled values Experiments
30 Myr exp5 1.07e+08 16 14 6.41e21 5.8e4 4.9e4
70 Myr exp6 1.67e+08 25 23 1.00e22 9.0e4 8.4e4
critical for facilitating the process of underthrusting.
3.2. Effect of brittle strength of the oceanic lithosphere
In this section, we assess the importance of strength contrasts at passive margins, which is in this study regulated by decreasing the strength of the brittle oceanic lithosphere through reducing its
thick-ness (Fig. 2a, set 2). The viscosity of the lithospheric mantle remains
unchanged. Three experiments with different thickness of the brittle layer are compared: experiment 2 (1.4 cm), experiment 4 (1.1 cm), and experiment 5 (0.8 cm). They represent brittle thicknesses of litho-spheres with an age of ~30 Myr, 50 Myr and 70 Myr, respectively.
The evolution of experiment 2 has already been described in context of the previous section and will not be repeated here. Furthermore, experiments 4 and 5 develop similarly. For this reason, we will only describe experiment 5 in detail and provide the results of experiment 4 in the appendix C.
In experiment 5, deformation starts at the passive margin by
thrusting (thrust 1 at 5%BS, Fig. 3d). Similar to experiment 2, the
po-sition where strain localized coincides with the oceanward termination
of the viscous continental lower crust (Fig. 3d). In contrast to
experi-ment 2, the deformation of the margin does not continue, and de-formation jumps to the oceanic domain as documented by the
forma-tion of fault 2 (Fig. 3d). This structure cuts through the brittle oceanic
lithosphere in opposite direction to thrust 1 thereby leading to a phase
of obduction of the oceanic plate onto the continental margin (20% BS
and cross section, Fig. 3d). In contrast to experiment 2, experiment 5
shows that most of the deformation affects the oceanic domain, yet no slab-type feature develops in accordance with a buoyancy number of
less than one (Table 1). Results from this set of experiments suggest that
if the oceanic brittle lithosphere is weak, (1) deformation can still in-itiate at the margin but (2) then jumps to the oceanic domain where it dominantly resides.
3.3. Effect of the thermal age of oceanic lithospheres
The experimental results, described in the previous sections, high-light the importance of the strength of both brittle and ductile oceanic lithosphere for the locus of subduction initiation and the under- thrusting process. However, by increasing the thermal age, both brittle
and ductile strength increase (Fig. 2c). Here we present the result of
experiments (experiment 5, 6 and 7) where both, brittle and ductile strength for the oceanic lithosphere have been consecutively increased (Fig. 2c). The results are summarized in Fig. 4.
Compression of an oceanic lithosphere with an age of ~30 Myr is
represented by experiment 5 (Fig. 4a). Model evolution follows the
following pattern: (1) strain localization at the margin (2) abortion of underthrusting and migration of deformation to the oceanic domain (3) obduction on the continental margin.
Compression of an oceanic lithosphere with an age of ~60–70 Myr Fig. 3. Experimental results of the analogue modelling study. Experiments 1 to 7 are represented in corresponding panels (a, b, c, d, e, f). Topographic evolution is retrieved through surface scans at 0%, 5%, 10%, 15%, and 20% bulk shortening (BS). Vertical exaggeration is 10 times. The final scan is supported by a lithospheric scale cross-section showing internal tectonic structures. The numbers at the surface of the scans represent the apparition order of the different tectonic structures. PM: passive margin.
is represented by experiment 6 (Fig. 4b). The model development fol-lows the following pattern: (1) strain localization at the margin and development of a thrust system. (2) Rupture of the flexural basin and under-thrusting of the oceanic lithosphere by using the continental ductile crust as a decollement. (3) Deformation of the ductile litho-spheric mantle accommodates the descent of the subducting plate.
Compression of an oceanic lithosphere with an age of ~140 Myr is
represented by experiment 7 (Fig. 4c and Fig. 3f). This experiment
re-presents a case of extreme strength of the oceanic lithosphere, char-acterized by a thick brittle lithosphere and a high viscosity in the ductile lithosphere. Overall, it is characterized by lithospheric folding at the margin. The model development is similar to experiments 3. It follows the following pattern: (1) strain localization and under- thrusting at the margin. Development of a frontal thrust system. (2) Abortion of under-thrusting. (3) Strong resistance of the ductile litho-spheric mantle induces large amplitude buckling of both the continental and the oceanic lithosphere. In addition, oceanic lithosphere buckling is
associated with low-offset thrusts (fault 3′, Fig. 3f). Nevertheless,
flexure at the margin is deeper and wider than in experiment 5 and affects the whole margin (λ = 25 cm). Deformation is more distributed
in the continental domain (faults 1 to 5, Fig. 3f).
4. Numerical experiments
To investigate the impact of the rheology of the oceanic lithosphere on subduction initiation, numerical experiments have been carried out by changing thermal ages of the oceanic lithosphere, ranging from 20
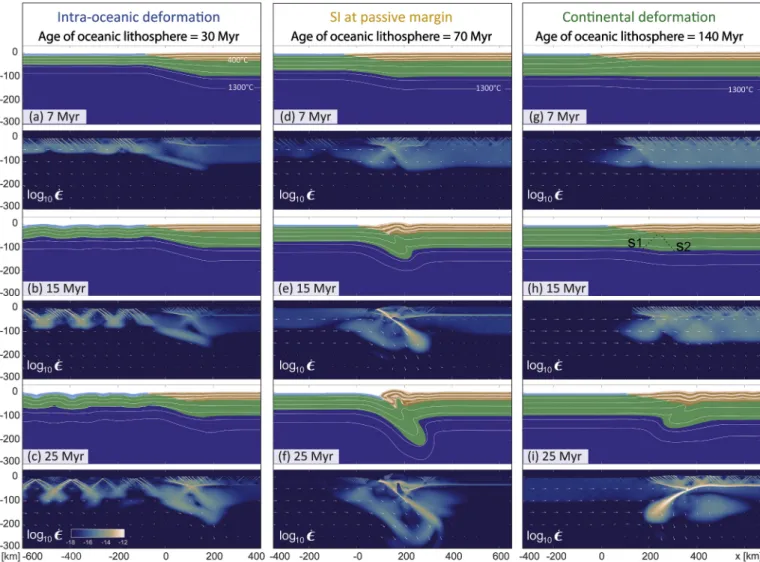
Myr to 140 Myr. In Fig. 5
we show the results of experiments representing young (30 Ma), intermediate (70 Ma) and old (140 Ma) oceanic lithosphere. These numerical experiments show distinct deformation evolutions and three end-member results similar to the results obtained in analogue experi-ments: (1) intra-oceanic strain localization for young oceanic litho-sphere (2) subduction at the passive margin for intermediate age of oceanic lithosphere, and (3) buckling/deformation of continental
lithosphere at the passive margin for old oceanic lithosphere. In this section, we describe the evolution of these end-member models.
Additionally, we show in Fig. 6 the role of key parameters relevant for
strain localization, including the coupling between the crust and the mantle at the passive margin, the importance of shear heating and Peierls creep mechanism.
4.1. Effect of the thermal age of oceanic lithospheres
In experiments that are representative for young oceanic litho-spheres with thermal ages ranging between 20 and 40 Myr, early stages of deformation affect the oceanic lithosphere as well as the passive margin as shown by shear zone type structures with elevated strain
rates (Fig. 5a, b, c). Reference model 1 shows that the margin is affected
by both plastic and ductile deformation in the upper and lower crustal layer, respectively. After 7 Myr of shortening, deformation pre-dominantly affects the oceanic lithosphere, where buckling instabilities develop with major shear deformation being concentrated at inflexion
points of the buckle folds (Fig. 5a). None of the structures developed
into a major shear zone. During advanced stages of shortening de-formation localized at the passive margin where the highest strain rates
are observed at the base of the ductile crust (Fig. 5c). However, this
strain concentration does not lead to the development of a subduction- like structure.
The locus of strain and style of deformation changed in the case an
oceanic lithosphere older than 40 Myr. In the model (Fig. 5d, e, f),
presenting an age of 70 Myr, we observe in early stages of the model evolution that deformation strongly localizes at the margin and at the base of the ductile continental crust where a shear zone initiated (Fig. 5d). Simultaneously, thrusting in the brittle crust accommodates
the shortening (Fig. 5e). After ca. 10 Myr of shortening, deformation is
transmitted from the lower crust to the lithospheric mantle, first in the semi-brittle domain (Peierls creep), and then to the ductile one
(dis-location creep). The effect of this mechanism is emphasized in Fig. 6. It
shows the rheological domains where the deformation takes place. At Fig. 4. Summary of deformation styles and evolution found in the analogue parametric study: a) intra-oceanic subduction for a young oceanic lithosphere, b) subduction initiation at the passive margin for an intermediate strength, and c) lithospheric folding for a strong oceanic lithosphere.
the top of the mantle, Peierls mechanisms becomes activated (Fig. 6b) whereas ductile deformation in the lowermost part of the lithosphere is governed by dislocation creep. At the same location, shear heating
reaches its maximum value (Fig. 6c). At this stage, the failure of the
mantle lithosphere under the margin generates deflection of the oceanic
lithosphere and initiates underthrusting. A growing flexural basin is formed at the edge of the margin in response to underthrusting (Fig. 5e). The velocity field shows that most of the convergence rate is transmitted to the subducting plate, whereas it is close to zero in the overriding plate. This mechanism produces the stress needed for the Fig. 5. Model evolution for the three reference numerical models involving three different ages of oceanic lithosphere. From left to right: 30 Myr, 70 Myr and 140 Myr. Evolution of lithological and temperature fields are depicted for the following shortening time steps: 7 Myr, 15 Myr, 25 Myr. For each time step we also show the distribution of strain-rate to emphasize strain localization. White arrows represent the velocity field.
Fig. 6. Respective contributions of frictional- (a) dislocation creep- (b) Peierls creep induced- (c) strain rates for the reference model with a 70 Myr old oceanic lithosphere. (d) shows the magnitude of shear heating. The time step is at 12 Myr to show deformation mechanisms during under-thrusting at a passive margin.
deformation of the ductile mantle lithosphere. The deformational re-sponse is the formation of a shear zone in the ductile domain, at the
plate interface (Fig. 5f). The convergence rate controls the deformation
of the ductile lithosphere until failure and generation of a slab under the margin at ~25 Myr of shortening.
For an oceanic lithosphere older than 100 Myr, underthrusting is deterred by shear resistance in the lithospheric mantle. The early evo-lution of this model shows first order similarities with experiments of
intermediate age of oceanic lithosphere (Fig. 5g) and includes (1) strain
localized at the passive margin, (2) formation of a shear zone at the base of the continental ductile crust, which acts as a décollement and (3) transfer of deformation to the mantle underlying the wedge shape margin. However, after 20 Myr of shortening, the strong resistance of the lithospheric mantle restricts the strain localization in the litho-spheric mantle. The strain is mainly distributed in the continental do-main and underthrusting is prevented. After 15 Myr of shortening, compression leads to the formation of conjugate shear zones in the
li-thospheric mantle that are referred to as S1 and S2 in Fig. 5h. In the last
stage, after 25 Myr of shortening, failure of the lithospheric mantle occurs at the first shear zone (S1) leading to the subduction of the continental lithospheric mantle under the oceanic lithosphere. How-ever, with shortening, the oceanic lithosphere penetrates through the
decollement (Fig. 5i), leading to the decoupling of the mantle from the
crust, referred as “partial delamination” by Nikolaeva et al. (2011).
Crustal deformation in the continental lithosphere is then accom-modated by long wavelength folding (λ = 200 km) and associated shear band formation.
4.2. Effect of crust-mantle coupling
Several studies (e.g., Nikolaeva et al., 2011), as well as this one
(Fig. 5e), suggest that subduction at passive margins requires the de-formation of a continental ductile lower crust, leading to the deflection of the oceanic plate. Additionally, our analogue and numerical ex-periments show that the ductile crust at the margin acts as a decolle-ment and facilitates the developdecolle-ment of thrusts at the passive margin, similar to what has been described for collisional systems upon
con-tinental subduction (Willingshofer et al., 2013). To test the role of crust-
mantle coupling at passive margins for strain localization, we run a model that includes a strong crust that enables coupling between the crust and the mantle. This model confirms that the decoupling horizon at the base of the margin is essential for underthrusting at the margin (Fig. 7a). In this case, subduction at the passive margin is very limited and occurs only for a 70 Myr oceanic lithosphere. Strain localizes at passive margin, but the overall strength of the lithosphere prevents plate rupture. Subsequently deformation shifts to the oceanic domain where the lithosphere buckles and pop-down structures may develop. Thus, crust-mantle coupling at passive margins strongly favours intra- oceanic strain localization for oceanic lithospheres younger than 70 Myr, whereas it leads to lithospheric folding for oceanic lithosphere older than 70 Myr.
4.3. Effect of Peierls creep
When Peierls creep of olivine is not considered, larger stresses are allowed to build up in the mantle. The overall lithosphere strength thus increases by about 30%. In these conditions, neither underthrusting nor subduction initiation occurred regardless of the age of the oceanic li-thosphere. Deformation localizes at the base of the continental crust but
never propagates into the mantle (Fig. 7b). Instead, intra-oceanic
sub-duction initiation occurs for ages < 70 Myr and deformation of the continental lithosphere for ages > 70 Myr. These additional results are
available in appendix D and are summarized in Fig. 8b. Deformation of
the continental lithosphere is in most cases characterized by partial delamination. In addition, the model without olivine Peierls creep
predicts underthrusting in the oceanic domain (Fig. 7b), characterized
by the development of pop-down structures.
4.4. Effect of shear heating
The modelling results underline the importance of thermal softening for strain localization in the lithospheric mantle during underthrusting (Fig. 6). Without thermal softening, strain does not localize over long periods of time and deformation typically shifts from the margin to the oceanic domain for young oceanic lithospheres. For older oceanic li-thosphere, the deformation occurs at the margin with the formation of a
shear zone at the base of the crust (Fig. 7c). The modelling results
suggest that shear heating does not change the place where deformation starts but it is essential for keeping deformation localized on individual structures like those along which underthrusting takes place. Ne-glecting shear heating typically leads to double-sided subduction
in-volving both the oceanic and continental lithospheres (Fig. 7c) similar
to the analogue experiments (see experiment 2, Fig. 3b). In the case of
young oceanic lithosphere, pop-down structures are formed in the oceanic domain. When lithosphere is older than 40 Ma, under-thrusting occurs at the passive margin, but it never reaches subduction. For an oceanic lithosphere older than 70 Ma, the oceanic and continental li-thosphere are strongly coupled at the margin and experience litho-spheric folding and no delamination.
5. Discussion
Both analogue and numerical modelling results show first order si-milarities and emphasize that subduction initiation at (or near passive) margins follows a 3-stages tectonic evolution including (1) early stage deformation of the continental crust (2) underthrusting and (3) sub-duction. We note that underthrusting characterizes the major change from distributed to localized deformation in the mantle lithosphere. We refer to “subduction” when the failure of ductile lithospheric mantle is Fig. 7. Effects of variations in rheological condition for a 70 Myr old oceanic
lithosphere at the onset of shortening. For the colour coding see Fig. 1. White
lines correspond to isotherms (200 °C spacing). Model time is 30 Myr after onset of shortening. (a) model with shear heating, Peierls creep and a strong con-tinental crust leading to crust-mantle coupling at the margin. (b) model with shear heating but without olivine Peierls creep. (c) model with olivine Peierls creep but deactivated shear heating. For b and c continental crust is the same than for the reference model.
complete and the slab sinks into the asthenosphere. These deformation stages are comparable with evolutionary schemes proposed by Nikolaeva et al. (2010) or Faccenna et al. (1999). In the following sections we discuss the conditions leading to subduction initiation and
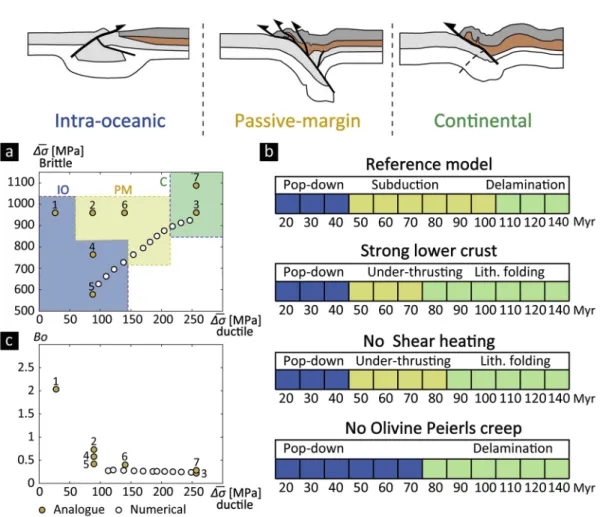
summarize the key outcomes of the study in Fig. 8. To correlate
ana-logue and numerical results, we focus on the mean ductile and brittle strength calculated over their respective thicknesses as explained in section 2.4. We remark that the analogue experiments are scaled such that the brittle-ductile transition lies slightly deeper, and that therefore the overall brittle strength is higher compared to the numerical models. To highlight the role of thermo-mechanical weakening processes, we display domain diagrams showing the effect of each studied parameter on the model development as a function of oceanic lithosphere age at
the onset of shortening (Fig. 8b).
5.1. Mechanisms of strain localization for subduction initiation
Our modelling results show that the locus of subduction initiation is strongly controlled by the strength contrast at the margin, which is controlled by compositional and rheologic differences between the oceanic and continental lithospheres. In most of the experiments,
de-formation initiated at the margin (Fig. 4 and Fig. 5). This position
co-incides with a strength minimum that is related to the oceanward
thinning of the brittle and ductile continental crust defining the passive margin. We argue that, in particular, the presence of ductile continental crust at the base of the margin is key for localizing deformation and the development of a long-lasting shear zone that eventually propagates into the mantle lithosphere. In nature, it is evidenced by recurrent
re-verse-faulting (Stein et al., 1989; Pereira et al., 2011; Ziegler and
Cloetingh, 2004) and increased seismicity at the continent-ocean
boundary (Assumpção and Sacek, 2013). When deformation has been
localized into a few structures within the crust, it propagates into the mantle lithosphere, which controls the underthrusting deformation stage. Analogue modelling results strongly emphasize that the strength contrast between the brittle part of the subducting plate and the ductile mantle lithosphere control the extent of under-thrusting at passive
margins (Fig. 8a). An increase of lithospheric mantle ductile strength
decreases the likelihood of underthrusting to evolve to subduction (Exp. 2 & 3). A similar result is obtained when decreasing the thickness of the brittle layer but keeping the viscosity unchanged. When subduction does not initiate at the margin, deformation shifts either to the oceanic domain (young lithosphere) or to the continental domain (old litho-sphere). These findings are consistent with the numerical modelling results. We note also that intra-oceanic strain localization is char-acterized by the development pop-down structure which are important during the shortening of hot and weak lithospheres (Poh et al., 2020). Fig. 8. Summary of model results from both analogue and numerical experiments. Three deformation styles have been found and are presented at the top of the figure: Intra-oceanic deformation for a young oceanic lithosphere, subduction initiation at the passive margin for an intermediate age, and continental deformation for an old oceanic lithosphere. (a) Effects of mean brittle and ductile strength of the oceanic lithosphere on strain localization. Yellow dots correspond to analogue experiments and each number corresponds to an experiment number. White dots correspond to numerical experiment with the age of the oceanic lithosphere increasing from the bottom to the top (b) Domain diagrams showing the effect of each studied parameter on the model development as a function of oceanic lithosphere age at the onset of shortening (c) Graph showing the distribution of the buoyancy number (Bo) of the oceanic lithosphere for each experiment as a function of the mean ductile strength. (For interpretation of the references to colour in this figure legend, the reader is referred to the web version of this article.)
Although we succeed at modelling intra-oceanic pop-down, main-taining subduction on the long term (> 10 Myr) would require the inclusion of stabilizing mechanism at the plate interface such as
sedi-ments or a serpentinite mantle wedge (Kiss et al., 2020; Wada et al.,
2008). Moreover, in nature, the slab pull would be enhanced by
den-sification of the mantle during eclogitisation. It increases the density contrast between the lithosphere and the asthenosphere and ensures the
sustainability of the subduction (Jolivet et al., 2013). Nevertheless, our
results also highlight the difficulty to initiate subduction within a young and weak oceanic lithosphere.
In addition to lateral changes of rheology, it has been shown that density contrasts across the COT might significantly contribute to SI (Faccenna et al., 1999; Mart et al., 2005; Nikolaeva et al., 2011). Ex-pressing density contrasts in terms of the buoyancy number reveals that deformation preferentially affects the oceanic lithosphere for buoyancy numbers > 1 (analogue experiment 1). This is in agreement with the
findings of Faccenna et al., 1999). However, strength calculations
coupled to cooling oceanic lithosphere suggests that the oceanic litho-sphere never reaches a suitable buoyancy conditions to overcome the ductile strength of the lithosphere even for density contrasts in the
order of 60 kg.m−3(Fig. 8c). Therefore, in case of induced convergence
at passive margins we consider density contrasts as a contributing, but not a dominant parameter for plate rupture and under-thrusting. It can however be an important parameter during the sinking of the sub-ducting plate during the subduction stage.
5.2. Role of thermal softening and Peierls creep
Although our analogue and numerical experiments provide first order similarities, the differences lie mainly in the weakening me-chanisms. In this sense, with the lack of intrinsic mechanisms leading to shear localization for stress levels as obtained in our analogue experi-ments, the sustainability of the subduction is uncertain. As reported, this limitation has been overcome by numerical modelling of which we
summarize the importance of weakening mechanisms in Fig. 8b and the
following paragraphs.
Models without shear heating and Peierls creep rheology do not lead to the initiation of a subduction zone. In our models Peierls creep mechanism reduces the mantle strength by ~30%, which is necessary to
trigger subduction at a passive margin (Fig. 8). In absence of Peierls
creep mechanisms, under-thrusting occurs in oceanic domain (aL < 70
Myr). It confirms the idea that the Peierls mechanism, by acting as a stress limiter, enhances strain localization in the lithospheric mantle (Kameyama et al., 1999). Additionally, there is a strong correlation between analogue experiments scaled from rheologies including Peierls creep and numerical experiments including Peierls creep rheology and no shear heating. Also, although the Newtonian mantle in our models
impedes the development of shear zone, Fig. 7c shows that strain
softening does not make a major difference. In models with no shear heating, underthrusting occurs but deformation never localizes in the
ductile mantle lithosphere (Fig. 7c). It even shows that an overall
weaker mantle lithosphere is not sufficient to localize deformation in the ductile lithosphere and that shear heating is a key mechanism for shear localization.
In the simulations, temperature increase in the ductile mantle li-thosphere due to shear heating reaching ~ 120 °C, which is in
agree-ment with previous results (Jaquet and Schmalholz, 2018; Schmalholz
and Duretz, 2015). Moreover, Peierls creep and shear heating reach maximum values at the same time and same location during under-
thrusting at the passive margin (Fig. 6c, d). It has been suggested that
shear heating is the main mechanism controlling the thermal activation
of ductile shear zone in the mantle lithosphere (Kiss et al., 2020). We
here propose, in addition, that our models of SI provide a good example of the interdependence between Peierls creep and shear-heating me-chanism. In the frame of this study, we then conclude that favorable conditions for subduction initiation include both mechanisms: when
Peierls creep controls underthrusting and trigger thermal instability in the mantle lithosphere, shear heating is essential for the development of a subduction plate boundary and for obtaining self-sustaining subduc-tion. Although not tested within this study, we acknowledge the
po-tential role of grain size-sensitive creep (Ricard and Bercovici, 2009),
percolating fluids for weakening of the system fluids (Alvarez-Marron
et al., 1997; Regenauer-Lieb et al., 2001) as well as the role of ser-pentinisation at passive margins where the mantle lithosphere has been
exhumed (Bayrakci et al., 2016; Hirauchi et al., 2016).
5.3. Timing and locus of subduction initiation
This study proposes that compression of a young margin
litho-sphere, (aL < 40 Myr) gives rise to intra-oceanic strain localization
(e.g. analogue experiments 6, Fig. 3d). The low strength of the oceanic
lithosphere does not permit deformation of the mantle lithosphere at the margin and deformation shifts towards the oceanic domain, and in
our models, close to the margin (e.g. Fig. 3d). It leads to a phase of
obduction on the continental margin. The locus of subduction initiation close to the margin is in agreement with several examples of obduction
(e.g. Agard et al., 2016; van Hinsbergen et al., 2016). These studies
point out that the short time span between supra-subduction spreading centres and ophiolites emplacement is an evidence of subduction itiation close the margin. A good example could be the subduction in-itiation in the Neo-Tethys Ocean between Gondwana and Eurasia.
Field-based tectonic reconstructions from Maffione et al. (2017) and
van Hinsbergen et al. (2016) suggest that the Late Cretaceous subduc-tion system formed parallel and near (~100 km) the main continental margins of the Anatolide-Tauride block. Strain localization would then be governed by pre-existing weakness zones such as detachment faults
at oceanic core-complexes (Maffione et al., 2015). However, in this
reconstruction, the age of the oceanic lithosphere at the margin is be-lieved to be of at least 100 Myr, which is significantly higher than our predictions. Nevertheless, this deviation needs to be put into perspec-tive as the rheology of the margin is not constrained and several parameters such as the coupling between the crust and the mantle can increase the limit of 40 Myr. Additionally, our results suggest that suitable conditions for SI initiation at passive margins occur for oceanic lithosphere with an age range between 40 and 110 Myr.
Subduction initiation at passive margins resembles a major problem in plate tectonics as no observations can be tied unequivocally to this process. However, several subduction zones are believed to have been formed at continental margins such as subduction system in the west
Pacific margins and in eastern Indonesia (Hall, 2019; Karig, 1982), or in
the Alps (Manzotti et al., 2014; Marroni et al., 2017). SI in these
ex-amples is characterized by nappe stacking of continental crust followed by formation of a sedimentary wedge at the subduction interface. In the case of the Alps, the age of the oceanic lithosphere during the inception
of subduction was estimated between 60 and 90 Myr (Manzotti et al.,
2014; Marroni et al., 2017). Additionally, dating of eclogite facies metamorphism shows that a slab has reached a significant depth after 30–40 Myr after the inception of deformation at the margin. It suggests that the required age of the margin and the duration of subduction initiation are in the range of what is observed in this study (70 Myr and ~ 30 Myr, respectively). However, if the margin is too old (age > 110 Myr) the strength of the mantle lithosphere is too high to allow for underthrusting and shortening is accommodated by the de-formation of the continental lithosphere, characterized by long wave-length buckling (750 km wavewave-length, natural scale) of the entire li-thosphere. These last deformation mode could explain the numerous records of margin inversion along the Atlantic margin, e.g. Brazilian
margin (Cogné et al., 2012; Marques et al., 2014; Riccomini et al.,
2004) or the Iberian margin (Duarte et al., 2013). For an old passive
margin, the migration of an existing plate boundary is probably the