HAL Id: hal-02552126
https://hal.sorbonne-universite.fr/hal-02552126
Submitted on 23 Apr 2020
HAL is a multi-disciplinary open access
archive for the deposit and dissemination of
sci-entific research documents, whether they are
pub-lished or not. The documents may come from
teaching and research institutions in France or
abroad, or from public or private research centers.
L’archive ouverte pluridisciplinaire HAL, est
destinée au dépôt et à la diffusion de documents
scientifiques de niveau recherche, publiés ou non,
émanant des établissements d’enseignement et de
recherche français ou étrangers, des laboratoires
publics ou privés.
A plethora of new R Coronae Borealis stars discovered
from a dedicated spectroscopic follow-up survey
P. Tisserand, G. Clayton, M. Bessell, D. Welch, D. Kamath, P. Wood, P.
Wils, Ł. Wyrzykowski, P. Mróz, A. Udalski
To cite this version:
P. Tisserand, G. Clayton, M. Bessell, D. Welch, D. Kamath, et al.. A plethora of new R Coronae
Borealis stars discovered from a dedicated spectroscopic follow-up survey. Astronomy and Astrophysics
- A&A, EDP Sciences, 2020, 635, pp.A14. �10.1051/0004-6361/201834410�. �hal-02552126�
https://doi.org/10.1051/0004-6361/201834410 c P. Tisserand et al. 2020
Astronomy
&
Astrophysics
A plethora of new R Coronae Borealis stars discovered from
a dedicated spectroscopic follow-up survey
?
P. Tisserand
1,2, G. C. Clayton
3, M. S. Bessell
2, D. L. Welch
4, D. Kamath
2,6, P. R. Wood
2, P. Wils
5,
Ł. Wyrzykowski
7, P. Mróz
7, and A. Udalski
71 Sorbonne Universités, UPMC Univ. Paris 6 et CNRS, UMR 7095, Institut d’Astrophysique de Paris, IAP, 75014 Paris, France
e-mail: [email protected]
2 Research School of Astronomy and Astrophysics, Australian National University, Cotter Rd, Weston Creek ACT 2611, Australia 3 Department of Physics & Astronomy, Louisiana State University, Baton Rouge, LA 70803, USA
4 Department of Physics & Astronomy, McMaster University, Hamilton, Ontario L8S 4M1, Canada 5 Vereniging Voor Sterrenkunde (VVS), Brugge, Belgium
6 Department of Physics and Astronomy, Macquarie University, Sydney, NSW 2109, Australia 7 Astronomical Observatory, University of Warsaw, Al. Ujazdowskie 4, 00-478 Warszawa, Poland
Received 10 October 2018/ Accepted 11 December 2019
ABSTRACT
Context.It is more and more suspected that R Coronae Borealis (RCB) stars – rare hydrogen-deficient and carbon-rich supergiant stars – are the products of mergers of CO/He white-dwarf binary systems in the intermediate mass regime (0.6 < MTot < 1.2 M ).
Following the merger, a short-lived cool supergiant phase starts. RCB stars are extremely rare as only 77 have hitherto been known in the Galaxy, while up to 1000 have been predicted from population synthesis models.
Aims.The goal is to significantly increase the number of known RCB stars in order to better understand their evolutionary paths, their spatial distribution, and their formation rate in the context of population synthesis results. A list of 2356 RCB star candidates was selected using infrared colours from the all-sky 2MASS and WISE surveys. The objective is to follow them up spectroscopically to classify the candidates and, thus, to distinguish RCB stars from other dust-producing stars.
Methods.A series of brightness and colour-colour cuts that were used as selection criteria were then tested using the sample of known Galactic and Magellanic RCB stars. RCB spectral energy distribution models were also used to understand the effects of each selection criterion in terms of circumstellar shell temperature. Optical, low-resolution spectra were obtained for nearly 500 of the candidate stars. These spectra were compared to synthetic spectra from a new grid of MARCs hydrogen-deficient atmospheric models. This allowed us to define a spectroscopic classification system for RCB stars depending on their effective temperature and photometric status.
Results.This programme has found 45 new RCB stars, including 30 Cold (4000 < Teff< 6800 K), 14 Warm (6800 < Teff < 8500 K),
and one Hot (Teff > 15 000 K). Forty of these belong to the Milky Way and five are located in the Magellanic Clouds. We also
confirmed that the candidate KDM 5651 is indeed a new RCB star, increasing the total number of Magellanic RCB stars to 30.
Conclusions.We increased the total number of RCB stars known by ∼50%, bringing it up to 147. In addition, we compiled a list of 14 strong RCB candidates, most certainly observed during a dust obscuration phase. From the detection efficiency and success rate so far, we estimate that there should be no more than 500 RCB stars existing in the Milky Way, all HdC stars included.
Key words. methods: observational – stars: carbon – stars: chemically peculiar – supergiants – stars: evolution
1. Introduction
R Coronae Borealis (RCB) stars are rare hydrogen-deficient, carbon-rich, supergiant stars that are increasingly suspected of having resulted from the merger of one CO−+ one He− white dwarfs (Clayton 2012). Therefore, they may be low-mass ana-logues of Type Ia supernova progenitors. The double-degenerate scenario has been strongly supported by the observations of abundance anomalies in RCB stars including a large18O over-abundance in their atmospheres (Clayton et al. 2007; García-Hernández et al. 2010) and of surface abundance anomalies for a few elements, fluorine in particular (Pandey et al. 2008; Jeffery et al. 2011). Furthermore, the abundances computed by ? Full Table 2 and the spectra presented in Figs. 5, 6, 9, 11,
and 13 are only available at the CDS via anonymous ftp to
cdsarc.u-strasbg.fr (130.79.128.5) or via http://cdsarc. u-strasbg.fr/viz-bin/cat/J/A+A/635/A14
simulations of such merging events agree well with the pecu-liar and disparate atmosphere abundances observed in RCB stars (Jeffery et al. 2011;Staff et al. 2012;Menon et al. 2013;Zhang et al. 2014;Lauer et al. 2019).
Interestingly, a second evolutionary scenario, the final helium shell flash, has also been proposed to explain the origin of RCB stars (Iben et al. 1996;Renzini 1990). The final-flash in a star on the verge of becoming a WD, causes it to expand into a cool supergiant star similar to RCB stars. Therefore, a fraction of RCB stars may result from the final-flash scenario. Such objects could be identified from the detection of hydrogen-rich nebulae around them (Clayton et al. 2011). However, recent studies of some RCB’s immediate circumstellar environment do not favour that scenario (Montiel et al. 2015,2018).
Our goal is to test these two scenarios by increasing the numbers of known RCB stars and consequently studying their sky distribution and formation rate. In the double-degenerate
Open Access article,published by EDP Sciences, under the terms of the Creative Commons Attribution License (https://creativecommons.org/licenses/by/4.0),
scenario, it is estimated that the He-CO WDs merger birthrate should be between ∼10−3and ∼5×10⁻³per year (Nelemans et al.
2001;Ruiter et al. 2009;Karakas et al. 2015) and that an RCB phase lifetime should last about 105years, as predicted by
the-oretical evolution models (Saio & Jeffery 2002). Therefore, we can expect between 100 and 500 RCB stars to exist in our Galaxy. RCB stars possess a large range of photospheric tempera-tures, mostly between ∼4000 and 8000 K (Tisserand et al. 2009; Tisserand 2012), but some are also known at hotter tempera-ture (>12 000 K) (De Marco et al. 2002). This wide range of effective temperatures supports the scenario that after the cata-clysmic event that creates an RCB, it goes through a supergiant phase which then evolves from a cold to a warm state while the helium-rich atmosphere contracts (Jeffery et al. 2011;Lauer et al. 2019). Fortunately, RCB stars are also known to be very bright, −5 6 MV 6 −3.5 (Tisserand et al. 2009, Fig. 3). All
RCB stars have an IR excess due to the presence of a warm cir-cumstellar dust shell with 300 < Teff,shell < 1000 K (Tisserand
2012, Fig. 2). These two characteristics facilitate the search reported here using the ensemble of photometric datasets avail-able. Finally, we note that RCB stars are members of a larger class of stars called the Hydrogen deficient Carbon stars (HdC stars) that share similar spectroscopic characteristics, but RCB stars have the particularity of being surrounded by dust and of undergoing unpredictable fast and large photometric declines due to clouds of dust newly produced.
We search for new RCB stars located in the Milky Way and the Magellanic Clouds in two steps: firstly, by selecting a short-list of targets of interest (ToI) among the 500 million objects catalogued within the two all-sky near- and mid-infrared (IR) surveys, 2MASS (Skrutskie et al. 2006) and WISE (Wright et al. 2010); secondly, by following them up spectroscopically, possi-bly with added support from photometric monitoring surveys.
Section2presents the WISE survey and describes the broad-band, colour selection criteria applied to the 2MASS and WISE ALL-Sky catalogues. The resulting list of RCB star candidates, their characteristics and the subsequent classification into pri-ority groups for the spectroscopic follow-up are discussed in Sects. 2.4and2.5. Then in Sect. 3, we detail the new spectra obtained, the light curves, and the stellar atmosphere models used. The spectral analysis and the classification system devel-oped to identify new RCB stars are discussed in Sect.4, while the status of previously discovered RCB candidates is reviewed in Sect.5. In Sect.6, we explore the RCB star spatial distribu-tion, and estimate the total number of RCB stars in the Milky Way. Finally, we summarise our results in Sect.7.
2. Infra-red broad bands selection of targets of interest
2.1. WISE All-Sky catalogue and Known RCB stars
The WISE Explorer mapped in 2010, during its full cryogenic phase, the entire sky in 3.4, 4.6, 12 and 22 µm with, respectively, angular resolutions of 6.1, 6.4, 6.5 and 12.0 arcsec and 0.08, 0.11, 1.0 and 6.0 mJy in point source sensitivities at 5 sigma (Wright et al. 2010). The four WISE photometric bands are here-after named [3.4], [4.6], [12] and [22]. There was a Preliminary Data release in 2011 (WISE-PDR1) covering 57% of the full sky area (Cutri et al. 2011), and the All-Sky Data Release (WISE All-Sky) containing more than 563 million objects in 2012 (Cutri et al. 2012).
We chose to use the WISE All-Sky catalogue instead of the latest release, the ALLWISE catalogue (Mainzer et al. 2011),
which was made after combining the data obtained during the cryogenic and post-cryogenic survey (NEOWISE) phases, for the following reasons. Firstly, it is preferable when selecting objects as highly variable as RCB stars to compare magni-tudes taken at the same epoch (photometric variations as large as ∼0.5 mag can been observed at 3 microns). Secondly, the ALLWISE combined dataset observations were made at di ffer-ent temperature states of the spacecraft and the [3.4] and [4.6] photometric sensitivities changed following the depletion of the solid hydrogen cryogen and subsequent warm-up of the detec-tors (see the Data Release Explanatory Supplement for more information). Therefore the photometric bias observed for sat-urated sources has also changed and is therefore not uniform for all measurements listed in ALLWISE. This is important as the majority of known Galactic RCB stars are saturated in the [3.4] and [4.6] photometric bands. A correction of these biases would be complicated to apply on the entire ALLWISE dataset, instead we found a pragmatic solution with the entire WISE All-Sky cat-alogue as its dataset can be considered as homogeneous. Finally, RCB stars are bright objects (all known RCB stars are brighter than 9 mag in [12] – see histogram in Fig.1, top-right) and, with a magnitude limit of ∼13 mag in [12], the WISE All-Sky cat-alogue is sufficient for our search. A deeper dataset like ALL-WISE would not improve it. The magnitude limit offered by the WISE All-Sky catalogue allow us to detect Galactic and Mag-ellanic RCB stars within about 50 kpc in all four mid-infrared bands.
From the WISE-PDR1 catalogue, a preliminary list of can-didate RCB stars was created (Tisserand 2012) using selection criteria based on the peculiar near- and mid-infrared colours of RCB stars and their circumstellar dust. This first list is now superseded by the sample selected here using the WISE All-Sky catalogue. The new catalogue is much improved in the sky coverage and the photometric sensitivity. In addition, the Mag-ellanic Clouds are now included in the catalogue. Furthermore, the WISE All-Sky detection algorithm, used in a highly crowded field, is more efficient. Consequently, some known RCB stars such as OGLE-GC-RCB-1 & -2, that were not catalogued in the WISE-PDR1 despite being clearly bright, are now listed in the WISE All-Sky catalogue.
All 101 known RCB stars (77 of those are Galactic and 24 are Magellanic) have been catalogued in the WISE All-Sky release, as well as ten stars that are considered as strong RCB candidates (Clayton 2012; Tisserand et al. 2013). The WISE magnitudes and associated 1σ uncertainties are listed in TableA.1. This list of known RCB stars has been used as a benchmark in our search for new members of the class. An update on the status of the ten strong RCB star candidates is given in Sect.5after the analysis of their broad-band IR photometry and of the newly available spectra.
We found small photometric zero-point shifts between the two WISE catalogues: All-Sky – PDR1 ∼−13 mmags [3.4], ∼−4 mmags [4.6], ∼29 mmags [12], and ∼−27 mmags [22]. These differences are small but could have a significant impact on the selection thresholds already defined inTisserand(2012) if not taken into account (see Sect.4).
Most known Galactic RCB stars are highly saturated in the [3.4] and [4.6] bands. Fortunately, photometry was neverthe-less performed by fitting only the PSF wings. However, particu-larly in the [4.6] band, this resulted in a photometric bias for all objects brighter than about [4.6] < 6.5 mag (see Sect. III.3.c of WISE All-Sky Release Explanatory Supplement for more infor-mation). For the brightest objects, the [4.6] magnitude could be over-estimated by almost 1 magnitude. To correct for this effect,
Fig. 1.Four panels representing the same colour–colour [4.6]−[12] versus [12]−[22] diagram for different WISE source subsamples. See the
explanations in the text and within the figures. The [12] magnitude distribution represented inside the top-right panel corresponds to the known RCB stars (linear scale, coloured bins: red for Galactic, blue for LMC, green for SMC) and to the WISE objects selected after cut #0 (grey bins, logarithmic scale). The names and positions of all known and candidate RCB stars that were rejected by the criterion cut #2 are indicated on the top-left panel.
we used the same strategy as the one detailed inTisserand(2012, Sect. 2.2.1). A corrected [4.6]corrmagnitude was estimated from
the spectral energy distributions (SEDs) of known RCB stars. We derived the following linear correction formula for the WISE All-Sky dataset: [4.6]corr= 0.83×[4.6]cat+1.09. We applied this
correction to all objects brighter than [4.6]cat < 6.35 mag. For
the brightest objects, [4.6]cat< 4 mag, we assume that we do not
know the brightness better than 10% and modified the respective WISE errors.
2.2. Selection criteria
RCB stars are so rare and so diverse in terms of photospheric and circumstellar-shell luminosities and temperatures that to obtain a comprehensive view over the entire range of these
parameters, we decided to cast a wide net over the entire 2MASS (Skrutskie et al. 2006) and WISE (Wright et al. 2010) databases. The association between these two catalogues is already pro-vided by the IR science archive (IRSA) from NASA. Firstly, the main selection criteria were applied to all catalogued objects that presented valid measurements in all seven (3 2MASS+ 4 WISE) bands (Sect.2.2.1). Subsequently, to catch RCB stars observed in a faint phases, new criteria are defined for a large number of detected objects that are listed with some upper limits values in up to two of these seven bands (Sect.2.2.2).
To simplify our search in these two cases, we required at the start of our analysis that each object should be detected in the WISE [12] band and be brighter than [12] < 12 mag. That corresponds to ∼21.5 and ∼33.2 million objects respectively for the first and second group, which overall correspond to nearly
Table 1. Number of selected Galactic (G) and Magellanic (M) objects remaining after each selection criterion.
Selection criterion Number of objects reported with Number of Known RCB stars 7 valid at least one upper known RCB stars eliminated measurements limit value in selected at each stage
J, H, K, [3] or [22]
0: [12] < 12 mag 21532159 33203403 100 V1157 Sgr
1: Cut on (J − H vs. H − K) 1843558 1582645 95 ASAS-RCB-8, XX Cam,
Y Mus, UV Cas and EROS2-LMC-RCB-6
2: Cut on ([4.6] − [12] 14315 243710 90 ASAS-RCB-1, DY Cen,
vs. [12] − [22]) EROS2-CG-RCB-12, MV Sgr and MACHO-11.8632.2507 3: Cut on (J − K vs. J − [12]) G: 11301, M: 482 232899 89 MACHO-308.38099.66 4: Cut on ([12] vs. [12] − [22]) G: 2568, M: 255 4279 5: Cut on (K vs. J − K) G: 2024, M: 118 4204 6: Cut on ([3.4]–[4.6]) G: 1905, M: 112 2435 7: Cut on 2MASS-WISE G: 1862, M: 109 1736 Association
Special supplementary cuts targeting objects with upper limit values in the J and/or [22] bands
8: Outside |b| < 2, |l| < 60 deg 757 88 EROS2-CG-RCB-8
9: Strict cuts on blending 473 87 EROS2-CG-RCB-5
Final, without known RCB G: 2194, M: 162 stars and the known HdC
star HD 175893
10% of the 563 million objects detected in the WISE All-Sky survey. The [12] threshold was chosen to be conservative as it is fainter than the faintest known Magellanic RCB stars by three magnitudes (see the [12] distribution in Fig.1, top-left). Using all known RCB stars, it is worth mentioning also that the median of the signal-to-noise ratio distribution in [12] is higher by a fac-tor of two than those for the three remaining WISE bands. RCB stars are therefore most noticeable in the [12] bandpass.
For the definition of our selection criteria, we used all 102 known RCB stars as benchmarks, as well as comparing to RCB SED models with a range of photospheric (4000–8000 K) and circumstellar-shell temperatures (300–1200 K). The summary of the selection criteria applied, the resulting number of candidate stars selected, and the known RCB stars rejected are presented in Table1.
2.2.1. The main selection criteria
Cut 0. We kept all objects that were detected with a valid mea-surement in each of the seven 2MASS+WISE bands, and were found to be brighter than [12] < 12 mag. Only three known RCB stars did not pass these simple requirements. V1157 Sgr was not selected because it was not detected in both [12] and [22] as it is located in a part of the sky with no observational coverage in these two bandpasses. MSX-SMC-014 and EROS2-CG-RCB-8 had two upper limit values in 2MASS J and H. However, these two RCB stars will still be considered in the second selection scenario applied to objects that possess upper limit values (see Sect.2.2.2).
Cut 1. The first colour–colour selection criterion was applied on the J − H versus H − K diagram. It targets objects presenting a high near-infrared excess as RCB stars possess warm circumstel-lar shells. This selection criterion has already proved its high e ffi-ciency in previous studies (Tisserand 2012, Fig. 6) and remains the same. It was defined as a function of the Galactic latitude as
the interstellar extinction affects these infrared magnitudes sig-nificantly. We have now rejected ∼91% of all previously selected objects at this stage. However, four known RCB stars were also rejected: ASAS-RCB-8, XX Cam, Y Mus and UV Cas. This is because all of them are warm RCB stars (Teff > 7200 K) with
their respective shells not thick enough to impact on their near-IR magnitudes. Their SEDs are displayed in Tisserand(2012) andTisserand et al.(2013).
It is important to mention here that the main locus of classical carbon stars (located at J − H ∼ 0.6 mag and H − K ∼ 1.2 mag) is entirely rejected at this stage.
Cut 2. The second colour–colour selection criterion was applied directly to the WISE photometry, and more specifically on the [4.6]−[12] versus [12]−[22] diagram. It therefore focuses on RCB dust shell temperatures. A similar criterion was used by Tisserand(2012), but we adjusted the selection thresholds here to better suit the new photometric datasets (i.e. due to the change in photometric zero-point between the preliminary and the All-Sky catalogues, see Sect.2.1) and the stellar distribution of the new known RCB stars. The selection area is illustrated in Fig.1 (bottom, left) and the limits are the following:
1.1 < [4.6]−[12] < 3.5 and 0 < [12]−[22] < 1.35
and [4.6]−[12]> 1.5 × ([12]−[22]) + 0.05 (1)
Figure1shows four examples of the same [4.6]−[12] versus [12]−[22] colour–colour diagram using different object subsam-ples and with RCB SED models illustrated for different cicum-stellar dust shell temperatures. First, top-left, the positions of the known RCB stars are indicated as well as a sample of catalogued objects selected after cut #0. This panel shows that most RCB stars form a locus with mid-infrared colours that are uncharac-teristic of ordinary catalogued objects. For the remaining three panels, the sample of objects plotted has passed the IR selec-tion cut #1 and, for illustrative purposes only, are brighter that
Fig. 2.J − Kversus J − [12] colour–colour diagrams with all objects selected after cut #2 and brighter than [12] < 9 mag, and with all known and candidate RCB stars represented. On the left side, RCB SED models are overlayed with a colour scale related to the circumstellar shell temperature. The interstellar extinction arrow is also indicated, it shows that many RCB stars were indeed affected by extinction at the time of the 2MASS epochs. This extinction includes circumstellar and interstellar dust. RCB stars observed in a deep decline have their 2MASS J magnitudes recorded with a magnitude limit. On the right side, the Magellanic extreme-AGB stars are represented with orange dots (see Fig.3). The selection area of cut #3 is delimited with red lines. Four known or candidate RCB stars that were not selected are marked with their names. This plot shows that all selected objects redder than J − K > 3.5 mag will be contaminated by extreme AGB stars. RCB stars will also be even harder to find with such high extinction.
[12] < 9 mag, which is a magnitude corresponding more closely to our reference sample of known RCB stars (see, within the top-right graph, the [12] mag distribution for the known RCB stars and for the selected WISE objects after cut #1). An elon-gated feature appears near the RCB-star locus, corresponding to highly enshrouded AGB stars with J − K > 2.5 mag. Most of the known Galactic RCB stars are distributed over the red-der part of that feature, while the Magellanic stars are more dispersed, with more than half lying above this AGB clump ([4.6]−[12] > 2 mag). It could possibly indicate that Magellanic RCB stars have thicker circumstellar dust shells than their Galac-tic counterparts. More studies will be necessary to understand this difference. We display on the bottom-right panel the theoret-ical colours of RCB stars estimated from SED models. It shows that our selection criteria cut #2 does not select RCB stars with very cold shell temperatures (Tshell < 400 K) or with hot thin
circumstellar shells.
A staggering 99% of objects, that passed the selection cut #1, were rejected by that particular criterion, while five known RCB stars were also not selected (i.e. ASAS-RCB-1, EROS2-CG-RCB-12, DY Cen, MV Sgr and MACHO-11.8632.2507), as well as three RCB candidates (i.e. KDM 5651, OGLE-GC-RCB-Cand-1 and [RP2006] 1631). Four of these eight objects, DY Cen, MV Sgr, MACHO-11.8632.2507 and OGLE-GC-RCB-Cand-1, lie far from the main RCB locus on the [4.6]−[12] ver-sus [12]−[22] diagram. For the first three, this is explained by the presence of a second bright cold dust shell around them. This is not uncommon for an RCB star to have two dust shells around them – Radiative transfer modelling of seven RCB stars with Far-IR data found that all of them have two dust shells (Montiel et al. 2018). ASAS-RCB-1 and the candidate [RP2006] 1631 lie just outside the selection limit as they both have a cold thick shell (Tshell ∼ 400 K or colder). On the contrary,
EROS2-CG-RCB-12 was eliminated because of its warm thin shell. Finally, the
RCB candidate KDM 5651 was found with a negative [12]−[22] colour, at odds with typical values found for known RCB stars. However, its [22] magnitude was reported with a very large error of 0.4 mag indicating a large uncertainty on its [22] brightness. The [22] measurement reported in the subsequent WISE ALL-WISE catalogue was corrected from this obvious photometric bias, and we found that KDM 5651 would then have passed selection cut #2.
Cut 3. This criterion is less efficient than the previous ones, as it rejects only 20% of the remaining sample (after cut #2), but it is valuable as it targets mainly the more common AGB stars. We explain the reason of this selection with the two panels presented in Fig.2. There, we illustrate the distribution of RCB stars and of the remaining sample in the colour–colour J − K versus J − [12] diagram. For a better understanding, one can also look at Fig. 7 presented byTisserand(2012), where the distribu-tions of objects coloured coded with their respective SIMBAD classification are shown.
In the left-hand panel, the RCB SED models are colour-coded by circumstellar dust shell temperature. One can recog-nize that not all known RCB stars are located within the area covered by these models. This is the case for about a quarter of them, that have a J − K colour index higher than about 3 mag. This is due to the combination of interstellar reddening and the characteristic high reddening that occurs when newly formed carbon dust clouds are on the line of sight and therefore obscure suddenly the photosphere. RCB stars that have been observed undergoing such rapid decline events, are found to have the high-est J − K colour index. This is why also the RCB stars with upper limit values in either the J or K 2MASS bands are all located outside the area covered by the RCB SED models. In the right-hand panel, we added the distribution of Magellanic extreme AGB stars (see cut #5 and Fig.3for an explanation of
Fig. 3.Colour–magnitude diagrams [12] versus [12]−[22] and K versus J − K for respectively the remaining Galactic and Magellanic objects sample selected after cut #3. The selection areas of cut #4 and cut #5 are delimited with red lines. All known and candidate RCB stars are indicated also as a reference sample. The area where Magellanic extreme AGB stars were selected to be represented in Fig.2is indicated in orange. See discussion in Sect.2.2.1, cut #4 and cut #5 for more details. The interstellar (I) and circumstellar (C) reddening effect are indicated with arrows.
the selection of these extreme AGB stars used here for illustra-tion) as well as the limits of the selection criteria. This selec-tion was designed to remove a high fracselec-tion of the extreme AGB stars. However, above a J − K colour index of 3.5 mag, our sample will still be contaminated by such objects as we designed our cuts to keep also RCB stars reddened by decline events. On the other side of the diagram, our criteria have the negative effect of removing potential RCB stars that possess a warm dust shell (Tshell > 900 K), in the following scenarios:
RCB stars with thick shells and, RCB stars observed during a high extinction phase or located near the Galactic plane. This is the reason why two known RCB stars did not pass the selec-tion, namely, MACHO-308.38099.66 and EROS2-CG-RCB-12 (which was already rejected by cut #2). Two RCB candidates, OGLE-GC-RCB-Cand-2 and EROS2-LMC-RCB-8, were also rejected in a similar way. However, the situation here may be dif-ferent as they are located in the diagram at the expected position of the AGB stars locus, and their respective light curves show unusually large amplitude oscillations for RCB stars. A more detailed discussion on their possible nature is given in Sect.5. Here are the limits of the selection applied:
J − K6 2.2 if (J − [12]) < 6 (2)
J − K6 (3.0 × (J − [12]) − 7.0)/5 if (J − [12])> 6. (3) Cut 4. At this stage, we separate the selected sample into two groups: the objects detected towards the Magellanic Clouds and the Galactic sample. It was a necessary split as the following selection is on apparent magnitude.
The first selection focuses on the shell brightness using the [12] band as an indicator. The two panels on the left side of Fig.3 represent the colour–magnitude diagrams [12] versus [12]−[22] for both samples. The applied selection criteria are listed below in Eq. (4) and are represented on each panel. They correspond
to faint limits and are used only to remove a group of faint red objects that are almost certainly all galaxies. For the Magellanic sample, we decided to be less restrictive by 1 mag as the number of objects added was small.
These criteria remove about 75% of remaining objects selected after cut #3. None of the known RCB stars were elimi-nated at that stage.
Galactic : [12]6 −1.53 × ([12]−[22]) + 10.76
Magellanic : [12]6 −1.53 × ([12]−[22]) + 11.76. (4) Cut 5. Here we apply a selection cut on the photospheric brightness. We used the K band as an indicator as it is the pho-tometric band that is the least affected by possible declines due to newly formed dust clouds that obscure the photosphere. The bright and faint limits are shown in the two colour–magnitude diagrams represented on the right side of Fig. 3 and are also listed in Eq. (5) below. For the Magellanic sample, the bright limit was truncated at J − K > 3.3 mag to keep potential interest-ing Galactic RCB candidates located on the line of sight of the Magellanic Clouds but also to remove a group of extreme AGB stars concentrated in the bright red side of that diagram. About 28% of the remaining objects were rejected at this stage, while keeping all known RCB stars. Only the Magellanic RCB candi-date, EROS2-LMC-RCB-7, did not pass these selection criteria being located within the group of extreme AGB stars.
Both samples : K> 0.68 × (J − K) + 4.0 Galactic : K6 0.68 × (J − K) + 13.0
Magellanic : K6 0.68 × (J − K) + 9.7 if (J − K)> 3.3. (5) Cut 6. We apply here a selection using the last unused fil-ter, the [3.4] WISE band. In a colour–colour [3.4]−[4.6] ver-sus [12]−[22] diagram, we found that there was a possibility to
clean up a bit more our sample by keeping all objects redder than [3.4]−[4.6] > 0.2 mag. This criterion targets objects that one cannot justify to keep in the final catalogue because they are bluer that the bluer edge of all SED models calculated and of any known RCB stars (see Fig.4). Only about a hundred objects were eliminated with this criterion.
Cut 7. Finally, we studied the distribution of distances between the 2MASS and WISE catalogues (Cutri et al. 2012). The RMS accuracy of the reconstructed WISE positions with respect to 2MASS for unsaturated sources with the signal-to-noise ratio >50 in unconfused regions of the sky is approxi-mately 200 mas on each axis. Our targets are very bright stars located mostly in a crowded environment. We decided to apply no cuts if the stars were brighter than [12] < 4 mag as we observed a wide range of variation for the association distance, however, for fainter objects we requested that the association distance to be lower than one arcsecond. Only 46 objects were rejected.
2.2.2. Description of the specific criteria targeting objects listed with upper limits
A majority of the WISE All-Sky objects detected are listed with an upper limit value in at least one of the seven bands (3 2MASS + 4 WISE). This could be due to multiple techni-cal or physitechni-cal reasons, but nevertheless some of these objects could be potentially interesting. Indeed, we found that 8 of the 101 known RCB stars are reported as such. Four of them are reported with only an upper limit value in the J band (EROS2-SMC-RCB-1, EROS2-LMC-RCB-6, EROS2-CG-RCB-5 and MACHO-6.6575.13); one with an upper limit in the K band (ASAS-RCB-20, with a surprising bright K upper limit value of ∼9.9 mag); two known RCB stars present upper limits values in the J and H bands (MSX-SMC-014 and EROS2-CG-RCB-8); and one known RCB star, V1157 Sgr, with no measurements reported in the WISE [12] and [22] bands (see discussion above in cut #0). We are particularly familiar with the game of hide and seek played by RCB stars. The upper limits for 2MASS measurements1are in most cases due to observations made
dur-ing a phase of a large photometric decline (which can go up to ∼3.0 mags in J and ∼1.6 mag in K during a maximum decline event of ∆ ∼ 9 mag observed in V). The light curves as well as the 2MASS epochs for each of the known RCB stars, listed above, can be found inTisserand et al.(2004,2008,2009). In the particular case of ASAS-RCB-20, we found that its non-detection in the K band is due to a confusion between multiple sources that the 2MASS detector algorithm did not succeed in resolving it.
About 33.2 million objects, brighter than [12] < 12 mag and detected in both [4.6] and [12] photometric bands, were reported with an upper limit in at least one of the remaining five bands: J, H, K, [3.4] or [22]. We concentrated our analysis on these objects. Understandably, for 29 million of them (∼87%), the [22] band was the only one affected. That is the least sensitive of the WISE photometric bands. We studied the 2MASS and WISE datasets more closely to analyse the reality of the situation and confirmed that when only the J or the [22] bands are reported with upper limit values, the objects are indeed predominantly 1 The typical completeness limits of the 2MASS catalogue are 15.8,
15.1 and 14.3 mag, respectively for the J, H and K s bands. It varies by one magnitude depending if observations were carried on towards the Galactic plane or at high Galactic latitude, because of the effects of confusion noise on the detection thresholds (Cutri et al. 2003).
not detected in these bands. However, in the following specific scenarios, when a measurement was only missing in the H or K bands, or only in both J and K bands, the related objects were in fact usually blended with one or more nearby objects. We have redesigned our selection criteria to suit each of these scenarios. The changes added in the main selection criteria for some spe-cific cases are described below.
Scenario 1: Objects listed with an upper limit in the H or K bands. The H band measurements are used uniquely in selection cut #1. There, if an object was to be selected at the brightness of the H upper limit value given, it would also remain selected for any fainter magnitude as the object would be shifted in the lower-right side of the IR colour–colour J − H versus H − K diagram used in cut #1. Therefore, using the H magnitude limit value as a classical measurement when we applied the seven main selec-tion criteria described in Sect.2.2.1adds no biases to our selec-tion. Concerning the K band, the situation is not the same as for fainter magnitudes than the upper limit value given, an object would shift to the left in the J − H versus H − K diagram and therefore could potentially come out the selection area. As we saw for ASAS-RCB-20, if an object misses only the K band mea-surement, the issue is most certainly due to a confusion between multiple sources and not to a non-detection. Therefore we used the K band value listed as such through all selection criteria.
Scenario 2: Objects listed with an upper limit in the J band. First, we did not keep objects that present an upper limit in the Jband and are located near the Galactic centre and plane (|b| < 2 deg and |l| < 60 deg). We considered that the search of RCB stars in this highly crowded and extinguished area is better suited to the VISTA/VVV (Minniti et al. 2010) and Spitzer/GLIMPSE (Churchwell et al. 2009) datasets which have better spatial reso-lution. Then, outside that sky area, we decided to select objects that would pass all the seven main selection criteria listed in the previous section at the upper limit value given in the J band but also if they would be fainter by up to 1 mag. In practice, we decreased the J luminosity in 0.1 mag steps and tested all cri-teria each time. If an object was selected in all 11 steps (from 0 to 1 mag), it was validated for the next selection step. Further-more, we requested that such objects present a unique possibility of association between the 2MASS and WISE catalogues, and that no blend was observed in WISE. On all six known RCB stars whose J band measurements present an upper limit, only three passed these criteria. The three rejected ones are: EROS2-LMC-RCB-6, EROS2-CG-RCB-5 and EROS2-CG-RCB-8. The candidate RCB star [RP2006] 1631, that is also listed with upper limit values in the J and H 2MASS bands, did not pass our selec-tion criteria either.
Scenario 3: Objects listed with an upper limit only in the [22] band. An object that would be fainter than the given [22] upper limit value would effectively have a bluer shell and would then move in the left side of the colour–colour diagram presented in Fig. 1. By shifting the reddest selection limit of cut #1 by 1 mag to the red:
[12]−[22] < 2.35 and [4.6]−[12]> 1.5×([12]−[22])−1.45) (6) and applying the above criterion directly on the [22] upper limit values given, we have consequently widened the selection area and kept objects that could be up to one magnitude fainter than the [22] upper limit but still be potentially selected by the main selection criterion (see cut #2). We also added a more strin-gent shell brightness lower limit by requesting a strict brightness
Fig. 4. Colour–colour [3.4]−[4.6] versus [12]−[22] diagrams. Top-left: distribution of all selected WISE targets of interest that have a valid measurement in all four WISE bands. The diagram is colour-coded with the J − K colour index. Two groups of objects are emerging; we are separating them pragmatically into two zones, A and B (see text for more details). Top-right: same sample of objects is represented in grey, while all known and candidate RCB stars are overlaid with large dots. Most RCB stars are located in zone A. Bottom-left: same diagram as the preceding except that the RCB SED models are added, colour coded with their shell temperatures. Bottom-right: here all known RCB stars are represented again by large red dots, while the large squares represent all the targets of interest that have already been followed-up spectroscopically. They are colour-coded respective to their spectral classifications.
threshold with [12] < 8 mag in selection cut #4. Finally, no blend can be present in WISE and we added a stricter cut on the colour [4.6]−[12] < 3 mag.
In conclusion, we added 469 targets of interest (397 Galactic, 72 Magellanic) to our final catalogue (about 20% of the total). They all present at least one upper limit value in the J, H, K, [3.4] or [22] bands. Most of them will be listed in the low priority group #4 for spectroscopic follow-up (see Sect.2.4).
2.3. Results
The summary of the selection criteria applied is stated in Table1. Out of the sample of 101 Known RCB stars used as a reference, 14 were not selected by our analysis. It corresponds to a detec-tion efficiency of ∼85%. Overall, the selection suits well typical RCB stars with effective temperatures between 4000 < Teff <
8000 K and surrounded by a thick circumstellar dust shell with a temperature between 400 < Tshell< 900 K.
Using RCB SED models, we found that RCB stars that pos-sess one of these three characteristics: (1) a cold circumstellar shell (Tshell < 400 K), (2) a very thin shell as their SED would
appear similar to classical F or G stars, or (3) a second colder
and thicker shell, like the one seen around MV Sgr (Tisserand 2012), have a low detection efficiency. Furthermore, we are less efficient at detecting RCB stars that possess a warm shell whose 2MASS epoch coincides with a large decline in brightness or are already affected by a high extinction due to any combination of interstellar and circumstellar dust. The first reason is that RCB stars may not be detected in 2MASS J or H passbands, or both, and secondly, even if they are detected, RCB stars with warm shells would be so red that they may exit the defined selection area defined (see cut #3 and Fig.3).
Due to the low resolution of 2MASS and WISE surveys (>3 arcsec) and the high interstellar extinction, our detection e ffi-ciency most certainly drops in the highly crowded central part of the Galactic bulge. We expect that it is strongly impacted in the sky area −2 < b < 2 deg and −60 < l < 60 deg where the inter-stellar dust extinction reaches AK> 3 mag. Higher resolution IR
Surveys such as VISTA/VVV and Spitzer/GLIMPSE could be of great help to probe that crowded part of the sky.
Overall, out of 563 million objects catalogued by WISE, our final list of targets of interest, rich in RCB stars, contains 2356 objects, 2194 in the Galaxy and 162 in the Magellanic Clouds. Their distribution on the sky is presented in Fig.16.
2.4. Prioritisation for spectroscopic follow-up
The second stage of our search is to follow-up spectroscopically each of the candidates selected. For that task, we classified them into five different groups of increasing priority.
We considered as the lowest priority all targets that we found to have a genuine identification in the SIMBAD database. We classified them in Group #5. We carefully looked at the infor-mation reported for each object selected and marked the ones that either have already been reported with a spectral type, or have been classified as Mira/OH-IR stars from a radio survey or from optical photometric monitoring datasets with strong bibli-ographic support. We found also that our selection was contam-inated by emission stars, RV Tauri stars and also some young stellar objects, T Tauri or pre-main sequence stars. Naturally, objects identified as carbon stars were not included in the low priority group as new observations with the same spectroscopic set-up as our on-going follow-up survey are necessary. We kept all objects from Group #5 in case of mis-classification. RCB stars are sometimes confused with Mira type stars as they both present light curves with large changes in luminosity (for example, MSX-LMC-1795 was classified as Mira in SIMBAD). Group #4 contains all objects that have been reported with a upper limit in at least one of the four WISE photometric bands or only in the 2MASS J band. We can expect that these objects are harder to follow-up as they could either be affected by a strong blending with neighbouring stars and/or have a strong extinction due to interstellar or circumstellar dust. At any given epoch, a fraction of RCB stars will be in a significant decline. Recently, the prototype R CrB returned to maximum light after a period of 9 years continuous decline, and V854 Cen was in a deep decline lasting at least 50 years before it was discovered (Kilkenny & Marang 1989;Lawson & Cottrell 1989).
The categorisation of the three highest priority groups is explained with the colour-colour [3.4]−[4.6] versus [12]−[22] diagrams presented in Fig.4. In the top-left diagram, one can clearly recognise two distinct clumps of objects. We define two zones, A and B, to separate them. Interestingly, most of the known RCB stars are found in zone A (see top-right diagram). Using RCB SED models (bottom-left diagram), we understand that RCB stars located in zone B are the ones presenting a thin shell (therefore undergoing a low dust production phase) or having a thicker but colder shell than average (Teff,shell< 500 K),
while, conversely, RCB stars with more typical warm thick shells are expected to be detected in zone A. Furthermore, looking at the distribution of objects classified as Mira or OH-IR stars in SIMBAD, or in our own on-going spectroscopic follow-up survey (see bottom-right diagram), we found that these stars occupy principally the top-left side of zone B. Therefore, we place all objects located in zone B in Group #3. As it contains the highest number of targets, but is also highly contaminated by Mira type stars and RV Tauri stars, further specific selection within that sample would therefore be useful to not misuse telescope time. However, the targets of Group #3 should not be disregarded as some less common RCB stars, that are useful to help to understand RCB’s evolutionary path, can be discovered amongst them. Monitoring photometric surveys should be a very useful tool to detect and reject Mira type stars from this sample as their characteristic large periodic photometric oscillations are easily recognisable. RV Tauri stars are also expected to be present as some of them, the ones surrounded by dusty discs, show similar WISE colours (seeGezer et al. 2015).
For the two highest priority groups, we separated targets in zone A based on their J − K colour index as redder objects can be more difficult to follow-up due to high extinction, but
also because these redder targets are contaminated by extreme AGB stars (see cut #3 in Sect.2.2.1and Fig.2). So, Group #1 includes all objects located in zone A and bluer than J − K < 3.5 mag, and Group #2 includes all redder objects (see top-left diagram). Among the targets listed in priority Groups #2 and #4, are some intrinsically bright RCB stars, as they may have been observed in a high extinction phase during the 2MASS epoch and later returned to maximum light. They can also include uncommon highly-enshrouded RCB stars, such as MSX-SMC-014 and EROS2-SMC-RCB-4.
Group #1 contains only 375 targets (329 in our Galaxy and 46 in the Magellanic Clouds). We consider that it should hold the highest percentage of bona-fide RCB stars. Indeed, of the 87 known RCB stars that passed the selection criteria, ∼70% would be classified in Group #1, while only ∼15%, ∼12%, ∼3% would classified in Group #2, #3 and #4 respectively. There are respec-tively 375, 463, 1005, 298 and 215 targets reported in Groups #1 to #5. An identification number is given to each target. This identifier was assigned depending on which location, Galactic or Magellanic, and which priority Group the target belongs to. As that corresponds to ten ensembles, each of them was given an interval of 1000 units between 1 and 10 000, starting at 1 for the Galactic sample and 5001 for the Magellanic one. For example, the Galactic (Magellanic) Group #1 targets are ranked between 1 (5001) and 1000 (6000), Group #2 between 1001 (6001) and 2000 (7000), etc.
2.5. A new catalogue of candidate RCB stars
We compiled a new catalogue of targets of interest in our search for RCB stars using the all-sky 2MASS and WISE surveys. This new catalogue supersedes the one created byTisserand(2012) using the WISE Preliminary data release. Further studies and spectroscopic follow-ups are now needed to classify each star. From the approximately 563 million objects catalogued by the WISE All-Sky survey, we have selected only 2356 targets (2194 in the Galaxy and 162 in the Magellanic Clouds) that present similar near- and mid-infrared colours and brightness to typical RCB stars. We used the 101 known RCB stars as a reference sample and determined a high detection efficiency of 85%. Fur-thermore, we found that the HdC star, HD 175893, also passed all our photometric selection criteria. It is in fact not surprising as HD 175893 is the only HdC star known to possess a circum-stellar dust similar to RCB stars (Tisserand 2012). As we have a similar efficiency for selecting RCB stars in the Magellanic Cloud as in the Galactic sample, we conclude that our search should allow us to detect any RCB stars located within ∼50 kpc from the sun.
We present a short version of the RCB enriched catalogue in Table 2. The entire catalogue will be available through the VizieR catalogue service. Each target is listed with its identifi-cation number related to its priority group and its own WISE identification. Then in the following order, one will find their equatorial and Galactic coordinates, as well as all their four WISE and three 2MASS magnitudes with their associated 1-sigma errors. The last three columns of the catalogue give information listed by the SIMBAD (as of 2015-08-11) database using a 3 arcsec matching radius, for instance: name, object type and spectral classification. When no information was given, the number −99 is listed in replacement.
To simplify the coordination of the follow-up of each candi-date, a dedicated web interface2, has been created to be able to monitor the status of each star and give access to all relevant 2 http://rcb.iap.fr/trackingrcb/
Table 2. First 10 rows of the published catalogue.
ID WISE ID RA Dec l b WISE WISE WISE (deg) (deg) (deg) (deg) [3.4] σ[3.4] [4.6]corr σ[4.6] [12] σ[12]
(mag) (mag) (mag) (mag) (mag) (mag) 1 J000842.12+630033.6 2.1755086 63.0093535 118.1051790 0.5388797 7.875 0.023 7.088 0.020 5.521 0.014 2 J001910.61+520203.5 4.7942272 52.0343285 117.8955721 −10.5215968 6.771 0.041 5.87827 0.026 4.603 0.015 3 J002921.18+644850.6 7.3382829 64.8140565 120.5838170 2.0431257 11.433 0.024 11.046 0.023 9.784 0.043 4 J003901.29+592805.0 9.7554102 59.4680639 121.3528413 −3.3655336 11.025 0.024 10.476 0.021 7.428 0.017 5 J004628.27+585420.8 11.6177924 58.9057907 122.2891557 −3.9596824 11.556 0.022 10.874 0.020 9.309 0.040 6 J004822.34+741757.4 12.0930919 74.2992817 122.7203357 11.4288814 6.679 0.040 5.17692 0.028 3.067 0.008 7 J004947.53+633810.0 12.4480736 63.6361242 122.7492110 0.7650405 9.247 0.023 8.343 0.021 6.871 0.018 8 J005128.08+645651.7 12.8670235 64.9477022 122.9351159 2.0760360 6.911 0.033 5.63923 0.029 3.876 0.015 9 J010500.10−054003.6 16.2504303 −5.6676941 132.0909095 −68.2979230 8.042 0.023 7.145 0.021 5.938 0.015 10 J013000.19+631044.5 22.5008221 63.1790352 127.2660314 0.6323574 10.320 0.024 9.821 0.020 8.673 0.030 Columns continued
WISE 2MASS 2MASS 2MASS SIMBAD
[22] σ[22] J σJ H σH K σK Name Object Spectral
(mag) (mag) (mag) (mag) (mag) (mag) (mag) (mag) type class 4.622 0.024 10.285 0.018 9.603 0.017 9.059 0.020 −99 −99 −99 4.163 0.023 9.501 0.022 8.192 0.017 7.187 0.018 V* V858 Cas sr* −99 9.178 0.517 12.923 0.024 12.465 0.031 11.947 0.026 −99 −99 −99 7.318 0.097 13.939 0.024 12.983 0.021 12.104 0.021 −99 −99 −99 8.722 0.281 12.931 0.023 12.704 0.033 12.389 0.023 −99 −99 −99 2.200 0.014 10.286 0.023 8.990 0.027 7.642 0.024 2MASS J00482232+7417574 IR −99 6.126 0.049 11.135 0.024 10.733 0.030 10.208 0.020 −99 −99 −99 3.367 0.022 10.936 0.027 10.066 0.030 9.177 0.019 IRAS 00483+6440 * −99 5.654 0.038 10.643 0.024 9.386 0.025 8.378 0.025 [BEM91] 7 C* C 8.000 0.261 11.329 0.022 10.774 0.028 10.248 0.025 −99 −99 −99
Notes. The full table is available at the CDS.
information: available light curves, spectra and/or observing charts. The authors invite everyone to report any information that would help them to identify new RCB stars. As of today, we have information that 313 of the candidates are Mira-type stars from their light curves or spectra. These targets do not need additional follow-up and their status is indicated on the website.
3. Spectroscopic data, light curves, and models
3.1. Spectroscopic data
The spectroscopic follow-up of the ToI, listed above, was con-ducted with four telescopes. Table4lists the characteristics of the spectra obtained. Predominantly, we used the Wide Field Spectrograph (WiFeS) instrument (Dopita et al. 2007) attached to the 2.3 m telescope of the Australian National University at Siding Spring Observatory (SSO). WiFeS is an integral-field spectrograph permanently mounted at the Nasmyth A focus. It provides a 2500 × 3800 field of view with 0.500 sampling along
each of the twenty-five 3800× 100slitlets. The visible wavelength interval is divided by a dichroic at around 600 nm, feeding two essentially similar spectrographs. The spectra have a two-pixel resolution of 2 Å and wide wavelength coverage, from 340 to 960 nm. We observed 415 targets with WiFeS during eight obser-vational runs: 20–25 July 2011, 4–7 June 2012, 23–25 July 2012, 1–3 August 2012, 23–30 July 2013, 15–18 and 24 August 2013. We also observed 61 targets with the Goodman spectrograph mounted on the 4.1 m Southern Astrophysical Research (SOAR) telescope located at Cerro Pachón, Chile on 6–8 July 2013. The 600 l mm−1grating was used to achieve a 1.3 Å two-pixel resolu-tion with a 435–702 nm wavelength coverage using the GG-385 blocking filter. All of the data were reduced using the spectral reduction package FIGARO. The telluric lines were removed using the IRAF task, TELLURIC, and standard stars observed during our runs. All spectra were flux calibrated using standard stars observed during the night. We also observed seven targets
in automatic mode with the FRODOSpec instrument mounted on the 2 m Liverpool telescope at the Observatorio del Roque de los Muchachos. Using the low-resolution gratings, FRODOspec can obtain the spectra of northern targets between 390 and 940 nm with a two-pixel resolution of 4 Å. Six Magellanic targets were observed with the AAOmega double-beam multi-fibre spectro-graph (Sharp et al. 2006) mounted on the 3.9 m Anglo Australian Telescope (AAT) at SSO as part of an observational campaign by Kamath et al.(2014,2015).
3.2. Light curves
The photometric data accumulated by monitoring surveys are also of great importance for our search as RCB star light curves show very characteristic photometric brightness changes. In par-ticular, RCB stars are well known to undergo unpredictable fast and deep declines in brightness due to newly formed dust clouds that obscure the photosphere (up to nine magnitudes in V band) in only two or three weeks. The photosphere usually reappears slowly after a few months when the dust grains disperse due to radiation pressure (e.g. Clayton et al. 2013). However, in some cases, continual dust formation can keep the star in a deep decline for many years. If such fast and deep declines are observed for an RCB star candidate that also presents a carbon-rich spectrum, we use this information to strengthen our decision on its RCB nature. Furthermore, light curves allow us to remove some targets from the candidate list for spectroscopic follow-up, as they show periodic photometric variations typical of Mira and RV Tauri stars. This knowledge allows us to make more efficient use of telescope time.
Here is the list of monitoring surveys whose data were used for the present analysis: OGLE (Udalski 2003), CRTS (Drake et al. 2009), ASAS (Pojmanski 1997), and the Bochum survey (Hackstein et al. 2015). The OGLE light curves of some new RCB stars presented in this article will be published in a dedi-cated article by Przmek et al. (in prep.).
Table 3. Priority classification of the WISE Targets of Interest followed-up spectroscopically.
Priority Id ToI Ids Number of ToI for Galactic, Galactic Magellanic follow-up Magellanic (with conclusive spectra)
(with clear non-RCB variability) New RCB stars/ candidates 1–1000, 329 46 1 5001–6000 (135) (10) (6) (19) 31/13 4/0 1001–2000, 456 7 2 6001–7000 (36) (1) (12) (5) 6/0 1/0 2001–3000, 987 18 3 7001–8000 (248) (8) (143) (1) 1/0 0/0 3001–4000, 247 51 4 8001–9000 (0) (0) (7) (12) 0/0 0/0 4001–5000, 175 40 5 9001–10 000 (41) (9) (18) (11) 0/1 0/0 No Id − − (−) (−) (−) (−) 2/1 0/0 2194 162 Total (460) (28) (186) (48) 40/15 5/0
Notes. See Sect.2.4for a summary of the prioritisation process.
3.3. Atmospheric models
Finally, we used a grid of hydrogen-deficient and carbon-rich MARCS (Model Atmospheres in Radiative and Convective Scheme) atmospheric models for various Teff (from 4000 to
7500 K), surface gravities (log g = 0.5 or 1.0), and nitrogen abundances ([N] from 7.0 to 9.4) (Gustafsson et al. 1975,2008; Bell et al. 1976; Plez 2008). We then created synthetic spec-tra using the Turbospectrum program (Alvarez & Plez 1998; Plez 2012) and the Vienna Atomic Line Database (VALD) (Ryabchikova et al. 2015) to get information on atomic and molecular transition parameters.
4. Spectroscopic analysis
First, we searched for our 2356 ToI in the databases of the mon-itoring surveys listed above. We found that light curves were available for 510 of them (394 Galactic and 116 Magellanic ToIs), and that 234 show typical photometric oscillations of large periodic variable stars such as Miras (226) and RV Tauri stars (8). We therefore did not observe these ToI spectroscopically to save telescope time, except for 35 ToI where the spectroscopic follow-up was done before the light curves became available.
We have obtained spectra of 488 targets so far. A detailed summary of the number of spectra obtained for each priority group, as well as the number of objects presenting light curve with large periodic variability unseen in any known RCB stars,
Table 4. Characteristics of the spectra obtained.
Telescope Spectrograph Wavelength Two-pixel range (nm) resolution (Å)
SSO/2.3 m WiFes 340–960 2
SOAR/4.1 m Goodman 435–702 1.3
Liverpool/2 m FRODOSpec 390–940 4
AAT/3.9 m AAOmega 370–880 3
is given in Table3. We immediately recognised and discarded 263 stars that present non-RCB spectra. Among those, 189 pre-sented spectra of oxygen-rich M stars (Miras), with typical wide absorption features due to the TiO and VO molecules. The large majority of these stars belong to priority group #3. In the Mag-ellanic Clouds, the number of these targets is low because of the special selection criteria based on the K versus J-K H-R dia-gram, implemented early on to remove most Magellanic Mira-type objects (see cut #5 in Sect.2.2.1). Another 74 were found to have spectra of hot, hydrogen-rich stars. All of these rejected stars are listed in our dedicated search website3.
To classify new RCB stars among the remaining spectra col-lected, we sorted the spectra into four groups, as RCB stars present a variety of optical spectra. Classical RCB stars are known to possess a wide range of Teff, from about 4000 to
8500 K, as they evolve through the H-R diagram. Indeed, below ∼6800 K, one can clearly observe absorption bands due to the C2 and CN molecules (see Figs.5–7). These bands strengthen
with lower Teff. Above the temperature threshold, none of these
molecules exist and the spectra consist of atomic absorption lines (Fe I, C I, N I and O I, Ca II, in particular – see Figs.10and11 for some examples). So, we classified our observed ToI into two distinct groups, cold and warm RCB stars (Sects.4.1and4.2), based on the presence or absence of the molecular bands in their spectra. We also added two further ToI groups to search for RCB stars presenting spectra with emission lines. The first group has characteristic emission lines seen when an RCB star undergoes a decline (Sect.4.3). The second group represents rare Hot RCB stars (Teff >15 000 K) that present spectra with many
strong emission lines (Sect.4.4).
We have defined and applied specific selection criteria for each of these four groups. These criteria are described in detail in the subsections below. A fifth and last group should also be mentioned, which is only seen when an RCB star is observed during a very deep minimum of a decline. In that particular sce-nario, only the cold and featureless spectrum of the circumstellar dust shell will be observed. We will discuss that particular case within the decline group (Sect.4.3).
Finally, it is worth underscoring here that the vast majority of classical giant carbon stars were excluded during the IR selec-tion process. Only extreme carbon-rich AGB stars are expected to be found within our ToI classified in priority groups #2 and #4. These groups were formed to contain ToI that are highly obscured due to thick circumstellar dust (J − K > 3.5 mag) and therefore potentially more difficult to observe and identify.
All newly discovered RCB stars and all new candidates are listed in TableB.1.
4.1. First group: Cold RCB stars
We focus here on a group of 72 ToI that show strong band-head features due to C2 and CN, observable in the blue and red of
the optical. Cold RCB stars have a Teff ranging between ∼4000
KDM5651 ToI−5042 ToI−249 ToI−76 ToI−105 ToI−121 ToI−124 ToI−177 ToI−182 ToI−203 ToI−220 ToI−231 ToI−1222 ToI−1227 ToI−2645 ToI−130 ToI−148 ToI−161 ToI−184 ToI−186 ToI−204 ToI−240 ToI−250 ToI−1220 ToI−1241 ToI−1265 ToI−1269 ToI−5004 ToI−290 ToI−5039 ToI−90
↓↓ ↓
↓
↓
↓
↓
↓
↓
↓
↓
↓
↓
↓
↓
↓
↓
↓
Ca II CN C26000
6500
7000
7500
8000
8500
Wavelength (Å)
−40
−30
−20
−10
0
10
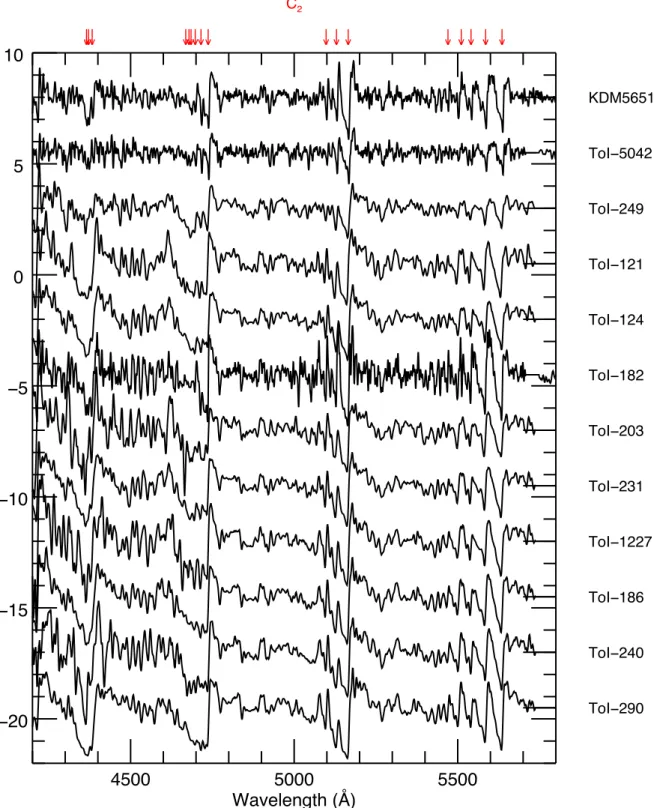
Fig. 5.Spectra, red region from 5800 to 8800 Å, of KDM 5651 and the 30 newly discovered Galactic Cold RCB stars. The underlying blackbody curves were removed. We plot them in order of the Ca II IR triplet strength, from stronger to weaker lines (top to bottom), that is, in decreasing order of Teff. The spectra were smoothed (5 points were used) for a better presentation and comparison. The names of the corresponding stars are given on the right side. The ordinate is arbitrary.
and about 6800 K, and are the predominant group of RCB stars detected so far (they represent about 2/3 of the entire known RCB star sample). An excellent description of these features and other typical Cold RCB star absorption lines can be found in Bessell & Wood (1983) and Morgan et al. (2003). They both underline that the main common characteristic observed in the spectra of Cold RCB stars, in addition to their hydrogen defi-ciency, is their very weak CN bands compared with classical
carbon stars, and that as a result the C2bands between 6000 and
6200 Å are not degraded and thus are clearly visible. 4.1.1.Morgan et al.(2003) RCB stars selection
In a catalogue of ∼8500 Magellanic carbon stars that were observed using the 2dF multi-object low-dispersion spectro-graph,Morgan et al.(2003) have identified six stars presenting
KDM5651 ToI−5042 ToI−249 ToI−121 ToI−124 ToI−182 ToI−203 ToI−231 ToI−1227 ToI−186 ToI−240 ToI−290
↓
↓
↓
↓
↓
↓
↓
↓
↓
↓
↓
↓
↓
↓
↓
↓
↓
↓
C24500
5000
5500
Wavelength (Å)
−20
−15
−10
−5
0
5
10
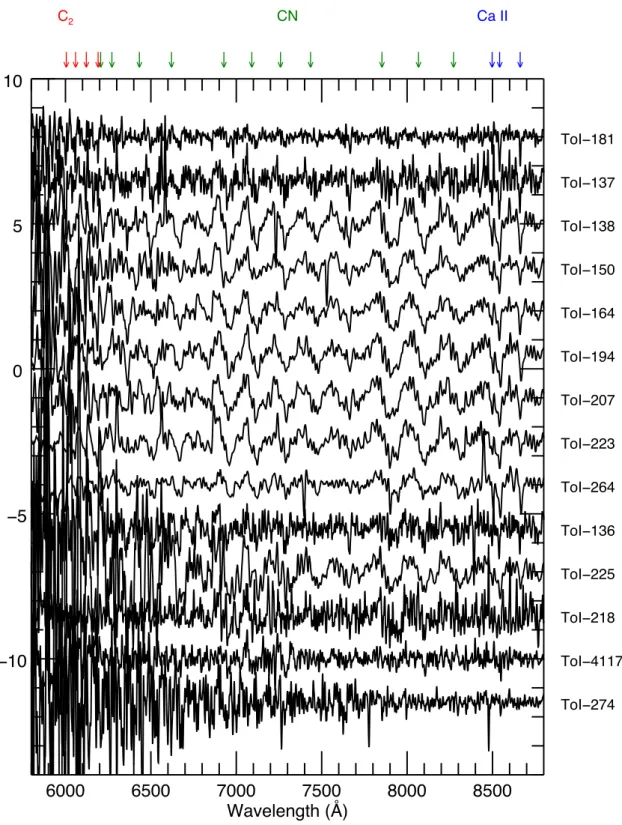
Fig. 6.Spectra, blue region from 4200 to 5800 Å, of KDM 5651 and a selection of 11 newly discovered Galactic Cold RCB stars that present the best signal-to-noise ratio. The underlying blackbody curves were removed. The large C2 band-heads features (2,0), (1,0), (0,0) and (0,1) are
clearly visible. We plotted them in order of the Ca II IR triplet strength, from stronger to weaker lines (top to bottom), that is, in decreasing order of Teff. The spectra were smoothed (5 points were used) for a better presentation and comparison. The names of the corresponding stars are given on the right side.
very weak CN features in their respective spectra. From further studies of these spectra as well as the near IR photometry, they suggested that five of them are strong Magellanic RCB candi-dates and the sixth, KDM 6546, presenting slightly stronger CN bands, should probably be a Galactic halo CH star located in front of the Large Magellanic Cloud. At the time, due to the lack of light curves and the narrow wavelength coverage of the
spectra, the nature of these six stars remained unconfirmed. An update on their classification status is given in Table5.
All five stars listed as strong Magellanic RCB star candi-dates byMorgan et al.(2003) are now confirmed RCB stars. It underscores that the spectroscopic analysis criteria described in Morgan et al. (2003, Sect. 4 and references therein) can be considered a very reliable method for identifying new RCB
ToI−181 ToI−137 ToI−138 ToI−150 ToI−164 ToI−194 ToI−207 ToI−223 ToI−264 ToI−136 ToI−225 ToI−218 ToI−4117 ToI−274
↓↓ ↓
↓
↓
↓
↓
↓
↓
↓
↓
↓
↓
↓
↓
↓
↓
↓
Ca II CN C26000
6500
7000
7500
8000
8500
Wavelength (Å)
−10
−5
0
5
10
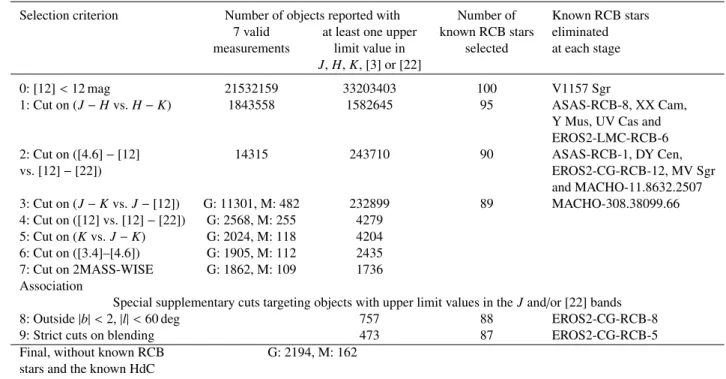
Fig. 7.Spectra, red region from 5800 to 8800 Å, of the 14 new strong Cold RCB candidates found in this study. The underlying blackbodies curve were removed. The spectra were smoothed (5 points were used) for a better presentation and comparison. The names of the corresponding stars are given on the right side. They are strongly suspected to have been observed during dust obscuration events. We plotted them in order of their Ca II IR triplet strength, from stronger to weaker lines (top to bottom).
stars. Here are the main criteria: firstly, very weak CN bands detected allowing four strong C2 bands to be clearly
distin-guished between 6000–6200 Å, secondly, no hydrogen Balmer lines detected, and thirdly, no13C features observed.
Furthermore, the spectral analysis was supported by the study of each CN-weak star’s near-IR luminosity and colour in comparison with other more classical carbon stars and already known RCB stars.Morgan et al.(2003) showed that the known
RCB stars stand out compared to the classical carbon stars locus, but also more interestingly that the five candidates follow the same near-IR characteristics as RCB stars.
All but one, KDM 5651, have passed our photometric selection criteria. KDM 5651 would have been selected if, as mentioned in Sect.2.2.1, cut #2, its [22] WISE ALL-Sky mea-surement had not been strongly biased. Interestingly also, the Galactic CH star, KDM 6546, was rejected as it did not
Fig. 8.Hydrogen-deficient synthetic spectra between 5800 and 6400 Å for four different nitrogen abundances (7.0 6 [N] 69.4 dex) and four different Teffs (4000 to 7000 K). The spectra are normalised to unity. The intensity scales extend between 0 and 1 for all spectra except the ones
with a Teffof 7000 K whose intensity scales are between 0.9 and 1. Cyan represents the CN band-head features, black represents the C2bands, and
blue is the sum of both. The abundances used for the models are those of a classical RCB star, i.e. [H]= 7.5, [He] = 11.5, [C] = 9.0 and [O] = 8.8, and the C/N ratio increased (∼0.4, ∼3.0, 10, and 100) by decreasing the nitrogen abundances.
pass the first two selection criteria using near- and mid-IR colours.
4.1.2. Our selection of Cold RCB stars
Dust reddening effects made the spectroscopic analysis of this cooler group of stars more difficult. In many cases, most of the signal detected was concentrated on the red side of the spectra, and some important features located in the blue (λ < 5500 Å) was missing. In particular, these include the CH molecular band at ∼4300 Å (only 11 out of the 73 cold ToI have some signal that
far into the blue), but also, the (1,0)13C12C absorption line at
4744 Å and the nearby (1,0)12C12C at 4737 Å. Fortunately, the 13C abundance can also be estimated from the red side of the
spectrum with the (1,3) and (0,2)13C12C bands, respectively at
6100 and 6168 Å, which are near a series of12C12C bands, and
also the13CN band-head at ∼6260 Å with the nearby (4,0)12CN band-head at 6210 Å if nitrogen abundance is high enough for the CN bands to be detectable. Most RCB star atmospheres are known to have a high C/N abundance ratio and a low13C/12C
isotopic ratio, but this is not always the case (Rao & Lambert 2008;Hema et al. 2012).
Table 5. Status on RCB stars candidates listed byMorgan et al.(2003).
Names Location Classification Comments
RAW 21, EROS2-SMC-RCB-1 SMC RCB confirmed A decline was observed in its EROS-2 light curve and no CH band was observed at 4300 Å (Tisserand et al. 2004).
KDM 2373, EROS2-LMC-RCB-2 LMC RCB confirmed A slow decline phase was observed by the MACHO survey as already reported byMorgan et al.(2003). This decline and the fol-lowing recovery were observed in its EROS2 light curve and no CH band was observed (Tisserand et al. 2009).
KDM 5651 LMC RCB confirmed A series of small declines were observed by the three microlens-ing surveys, MACHO, EROS-2 and OGLE. A decline of ∼0.3 mag at JD∼2450200 was detected by MACHO, then subsequently two similar declines of ∼0.3 mag were also monitored by EROS-2 at JD∼2451800 and ∼2452100. The recovery stage of that last decline was observed by OGLE-III (see Soszy´nski et al. 2009, OGLE-LMC-RCB-20). About ∼11.8 years later, a stronger decline of ∼1.7 mag was observed by the OGLE-IV RCOM survey(a). We
obtained a spectrum during our observational campaign and no CH band was observed, confirming a previous analysis made by
Hartwick & Cowley(1988) of their candidate HC 119 spectrum. We observed absorption features due to C2and CN molecules
typi-cal of Cold RCB stars.
KDM 2492 LMC RCB confirmed This is the already identified Magellanic RCB star, HV 5637 (Alcock et al. 2001). No decline was observed for more than 20 years between the MACHO, EROS-2 and OGLE-III microlens-ing surveys, but a ∼2.4 mag decline was monitored by the OGLE-IV RCOM monitoring system.
KDM 7101, EROS2-LMC-RCB-5 LMC RCB confirmed Two large and rapid declines were observed by the EROS-2 survey (Tisserand et al. 2009). No CH band was observed.
KDM 6546 Galactic Confirmed CH star We obtained a spectrum during our observational campaign and detected a strong CH band-head at ∼4300 Å (see Fig.9). It was already reported as a CH star byHartwick & Cowley(1988), HC 193, but as discussed byMorgan et al.(2003), there was a possible issue due to a positional mismatch of more than 3000
.
Notes.(a)See OGLE-IV RCOM (OGLE Monitoring system of R Coronae Borealis type variable stars) website:http://ogle.astrouw.edu.
pl/ogle4/rcom/kdm-5651a.html
It has always been possible to detect the presence or absence of Balmer lines to test for hydrogen deficiency. RCB stars generally show weak or absent Balmer lines, but at least one RCB star, V854 Cen, shows significant hydrogen lines (Lawson & Cottrell 1989;Kilkenny & Marang 1989). It is also now possible to detect the Ca II IR triplet located in the red (λ ∼ 8498, 8543 and 8662 Å). Indeed, the intensity of these lines is, as shown byRicher(1971), a good indicator of carbon star temperature: the cooler the temperature, the weaker the lines. We have therefore empirically classified each of the 73 candi-date RCB stars based on the Ca II IR triplet strength: none, weak, small, medium, and strong.
The CN bands observed in RCB stars are weaker than the ones observed in classical carbon stars. As discussed in the previ-ous section, this allows the possibility of detecting four C2
band-heads between 6000 and 6200 Å that are normally swamped by strong CN bands nearby. We studied synthetic spectra for a range of Teffand C/N abundance ratios, and found that these C2bands
indeed become detectable when the C/N ratio is higher than 3 and the Teff ranges between 5000 and 6000 K (see Fig.8). The
second C2 band-head, around 6000–6060 Å, fades first with a
higher nitrogen abundance due to a strong CN band-head appear-ing nearby. At higher temperatures, ∼6000 K, the four C2
band-heads can be seen even for lower C/N ratios as the CN bands
vanish. On the other hand, at a low temperature like ∼4000 K, the C/N ratio needs to be higher than 100 to begin to observe these band-heads. For a large majority of Cold RCB stars, the observation of these C2 features, rarely seen in classical carbon
stars, are therefore common and can be used as a simple identifi-cation criterion. This criterion is not infallible, so for a very few RCB stars, like V4017 Sgr, there are no C2band-heads that are
easily detectable in this wavelength range. We also note that after looking closely at the spectra of known RCB stars, we found that selecting stars based only on the extreme weakness of the CN bands, as didMorgan et al.(2003), was too strict a criterion to detect all of the RCB stars.
Using already known RCB stars and synthetic spectra match-ing their Teff, we established a series of criteria to reveal new
RCB stars. We describe these criteria below.
Among the 73 cold candidates, we recognised that 13 of them show Hα emission indicating that they are not
hydrogen-deficient. They are most certainly carbon-rich AGB stars which show a cooler Teff than RCB stars (Teff < 3500 K). This is
confirmed by the strength of the Ca II IR triplet which is non-existent. These stars also present a very high IR excess and are located in the extreme top-right of the J −H versus H −K colour– colour diagram presented in Tisserand (2012, Fig. 6), where AGB carbon-rich stars are expected to be found. We rejected
![Fig. 1. Four panels representing the same colour–colour [4.6]−[12] versus [12]−[22] diagram for different WISE source subsamples](https://thumb-eu.123doks.com/thumbv2/123doknet/14799493.605487/4.892.70.821.120.808/panels-representing-colour-colour-versus-diagram-different-subsamples.webp)
![Fig. 2. J − K versus J − [12] colour–colour diagrams with all objects selected after cut #2 and brighter than [12] < 9 mag, and with all known and candidate RCB stars represented](https://thumb-eu.123doks.com/thumbv2/123doknet/14799493.605487/6.892.66.826.126.465/versus-colour-diagrams-objects-selected-brighter-candidate-represented.webp)
![Fig. 3. Colour–magnitude diagrams [12] versus [12]−[22] and K versus J − K for respectively the remaining Galactic and Magellanic objects sample selected after cut #3](https://thumb-eu.123doks.com/thumbv2/123doknet/14799493.605487/7.892.76.821.125.502/colour-magnitude-diagrams-respectively-remaining-galactic-magellanic-selected.webp)
![Fig. 4. Colour–colour [3.4]−[4.6] versus [12]−[22] diagrams. Top-left: distribution of all selected WISE targets of interest that have a valid measurement in all four WISE bands](https://thumb-eu.123doks.com/thumbv2/123doknet/14799493.605487/9.892.81.816.128.631/colour-colour-versus-diagrams-distribution-selected-targets-measurement.webp)