HAL Id: hal-00304156
https://hal.archives-ouvertes.fr/hal-00304156
Submitted on 13 May 2008HAL is a multi-disciplinary open access
archive for the deposit and dissemination of sci-entific research documents, whether they are pub-lished or not. The documents may come from teaching and research institutions in France or abroad, or from public or private research centers.
L’archive ouverte pluridisciplinaire HAL, est destinée au dépôt et à la diffusion de documents scientifiques de niveau recherche, publiés ou non, émanant des établissements d’enseignement et de recherche français ou étrangers, des laboratoires publics ou privés.
Asian dust outflow in the PBL and free atmosphere
retrieved by NASA CALIPSO and an assimilated dust
transport model
Y. Hara, K. Yumimoto, I. Uno, A. Shimizu, N. Sugimoto, Z. Liu, D. M.
Winker
To cite this version:
Y. Hara, K. Yumimoto, I. Uno, A. Shimizu, N. Sugimoto, et al.. Asian dust outflow in the PBL and free atmosphere retrieved by NASA CALIPSO and an assimilated dust transport model. Atmospheric Chemistry and Physics Discussions, European Geosciences Union, 2008, 8 (3), pp.8715-8742. �hal-00304156�
ACPD
8, 8715–8742, 2008 Three-dimensional transport structure of Asian dust Y. Hara et al. Title Page Abstract Introduction Conclusions References Tables Figures ◭ ◮ ◭ ◮ Back CloseFull Screen / Esc
Printer-friendly Version Interactive Discussion Atmos. Chem. Phys. Discuss., 8, 8715–8742, 2008
www.atmos-chem-phys-discuss.net/8/8715/2008/ © Author(s) 2008. This work is distributed under the Creative Commons Attribution 3.0 License.
Atmospheric Chemistry and Physics Discussions
Asian dust outflow in the PBL and free
atmosphere retrieved by NASA CALIPSO
and an assimilated dust transport model
Y. Hara1, K. Yumimoto2, I. Uno3, A. Shimizu1, N. Sugimoto1, Z. Liu4, and D. M. Winker51
National Institute for Environmental Study, Tsukuba, Ibaraki, Japan
2
Dept. of Earth System Science and Tech., Kyushu University, Fukuoka, Japan
3
Research Institute for Applied Mechanics, Kyushu University, Fukuoka, Japan
4
National Institute of Aerospace, Hampton, VA 23666, USA
5
NASA Langley Research Center, Hampton, VA23681, USA
Received: 6 March 2008 – Accepted: 1 April 2008 – Published: 13 May 2008 Correspondence to: Y. Hara (hara.yukari@nies.go.jp)
ACPD
8, 8715–8742, 2008 Three-dimensional transport structure of Asian dust Y. Hara et al. Title Page Abstract Introduction Conclusions References Tables Figures ◭ ◮ ◭ ◮ Back CloseFull Screen / Esc
Printer-friendly Version Interactive Discussion Abstract
Three-dimensional structures of Asian dust transport in the planetary boundary layer (PBL) and free atmosphere occurring successively during the end of May 2007 were clarified using results of space-borne backscatter lidar, Cloud-Aerosol Lidar with Or-thogonal Polarization (CALIOP), and results simulated using a data-assimilated
ver-5
sion of a dust transport model (RC4) based on a ground-based NIES lidar network. Assimilated results mitigated overestimation of dust concentration by reducing 17.4% of dust emissions and improved the root mean square difference (RMSD) of dust AOT between the model and NIES lidar by 31.2–66.9%. The dust layer depths, vertical and horizontal structure simulated by RC4 agreed with CALIOP from the dust source region
10
to a long-range downwind region for which 3-D distribution of dust clouds had not been clarified previously. Based on CALIOP and RC4, two significant transport mechanisms of Asian dust in the PBL and free atmosphere were clarified: a low level dust outbreak within the dry slot region of a well developed low-pressure system, and formation of an elevated dust layer within the warm sector of a low-pressure system. Finally, the aging
15
of pure dust particles was investigated using the particle depolarization ratio (PDR) at 532 nm and the color ratio (CR) at 1064 nm and 532 nm for the low-altitude dust transport case. Aerosols with high PDR were observed uniformly over the dust source region. As the dust cloud was transported to the eastern downwind regions, aerosols with low PDR and high CR were found in the layer of less than 1 km height, suggesting
20
changes from the external to internal mixing state of spherical aerosols and dust in the surface layer.
1 Introduction
Asian dust has important influences not only on air quality in the planetary boundary layer (PBL) but also on the regional/global radiative balance. Asian dust emitted from
25
ACPD
8, 8715–8742, 2008 Three-dimensional transport structure of Asian dust Y. Hara et al. Title Page Abstract Introduction Conclusions References Tables Figures ◭ ◮ ◭ ◮ Back CloseFull Screen / Esc
Printer-friendly Version Interactive Discussion but sometimes it is elevated up to the free atmosphere (FA), occasionally reaching
thou-sands of kilometers to North America (Takemura et al., 2002; Uno et al., 2001). Numer-ical modeling is an effective method to clarify the detailed 3-D structure of wide-range dust transport. However, dust modeling engenders several uncertainties, especially in dust emission processes. Therefore, detailed 3-D dust observation is important for
5
improving dust model performance (e.g., dust concentration level over source region, horizontal scale, and vertical thickness of the dust layer).
Ground-based lidar networks are powerful measurement systems that provide im-portant vertical structures of aerosol and cloud layers as well as aerosol optical proper-ties. They can provide the vertical profile of spherical (pollution), non-spherical (dust)
10
aerosol particles, and particle size information from two-wavelength lidar signals (e.g., Sugimoto et al., 2006), which is very important for understanding of dust phenomena.
Space-based top-down active measurement is another powerful system for dust dis-tribution. Actually, a NASA space-borne backscatter lidar, Cloud-Aerosol Lidar with Or-thogonal Polarization (CALIOP) onboard CALIPSO, has provided high-resolution
verti-15
cal profiles of clouds and aerosols since June 2006 (Winker et al., 2007). It can detect dust particles quantitatively from the source to downwind regions, but it presents some difficulties in providing aerosol information under optically thick aerosol and cloudy con-ditions. For more detailed understanding of dust emission and transport, integration between the dust transport model and CALIOP observations is necessary (e.g., Uno
20
et al., 2008).
Large-scale dust storms over eastern Asia occurred continually during 21–31 May 2007. In this paper, we will present detailed integrated analysis of 3-D dust structure based on the NIES Lidar network, CALIOP observations, and results obtained using a four-dimensional variational (4DVAR) data assimilation version of a dust transport
25
model (Yumimoto et al., 2007a, b). We will also show the dust transport within the PBL and the dust lift-up within the warm sector of low pressure system, and underscore the importance of warm sector lift up for long-range transport of Asian dust.
ACPD
8, 8715–8742, 2008 Three-dimensional transport structure of Asian dust Y. Hara et al. Title Page Abstract Introduction Conclusions References Tables Figures ◭ ◮ ◭ ◮ Back CloseFull Screen / Esc
Printer-friendly Version Interactive Discussion 2 Dust emission/transport model and observation data
We used the RAMS/CFORS-4DVAR dust transport model (RC4; Yumimoto et al., 2007a,b). For this study, we applied RC4 by assimilating the dust extinction coeffi-cient derived from the NIES Lidar network. The RC4 domain is centered at 37.5◦N,
115◦E on a rotated polar stereographic system (see Fig. 1). The horizontal grids
com-5
prise 180×100 grids with resolution of 40 km. The vertical grids comprise 40 grid points extending from the surface to 23 km with 40 stretching grid layers (140 m at the surface to 650 m at the top) in terrain-following coordinates. Meteorological boundary condi-tions to RAMS are taken from NCEP/NCAR reanalysis data with 2.5◦
×2.5◦ resolution of 6-h intervals. The simulation was performed from 21–31 May 2007 with zero initial
10
dust concentration.
Table 1 shows the locations of NIES lidar sites. We selected nine lidar sites (Beijing, Seoul, Hedo, Nagasaki, Matsue, Toyama, Niigata, Tsukuba, and Sendai; see Fig. 1) from the NIES lidar network (Sugimoto et al., 2006), which measures vertical profiles of dust with high spatial and temporal resolution. The extinction coefficient was derived
15
based on the backward Fernald’s method (Fernald, 1984) by setting a boundary con-dition at 6 km and S1=50 sr (Liu et al., 2002). The contribution of mineral dust to the
total extinction coefficient is determined using the particle depolarization ratio (Shimizu et al., 2004). Total dust emission during the simulation period is also presented in Table 1; 17% of dust emission reduction was achieved using the RC4 model to give
20
optimal agreement with the NIES lidar measurement. Details of the data assimilation of the RC4 dust model were already described in Yumimoto et al. (2007a, b)
The CALIOP measurement is used for comparison in this paper. Level 1B (version 1.20) CALIOP data (horizontal resolution of 333 m) provide profiles of the total attenu-ated backscatter coefficient at 532/1064 nm and the volume depolarization ratio (δ) at
25
532 nm. The CALIOP Level 2 (horizontal resolution of 5 km) processing extracts fea-tures (cloud, aerosol, surface, etc.) included in a lidar profile. Version 1.20 of Level 2 products are layer-averaged attenuated optical properties along with cloud-aerosol
ACPD
8, 8715–8742, 2008 Three-dimensional transport structure of Asian dust Y. Hara et al. Title Page Abstract Introduction Conclusions References Tables Figures ◭ ◮ ◭ ◮ Back CloseFull Screen / Esc
Printer-friendly Version Interactive Discussion discrimination (CAD) results (Liu et al., 2004). The CAD is an indicator that enables
dis-crimination between cloud (positive value) and aerosol (negative value) data. The dust extinction coefficients were derived using Fernald’s inversion (Fernald, 1984) by setting the lidar ratio S1=30 sr, as described by Shimizu et al. (2004). Inversion started from z=14 km down to the ground surface. In this study, Level 1B data are averaged by 20
5
profiles and interpolated to Level 2’s horizontal resolution (5 km). Detailed descriptions can be found on the CALIPSO mission webpage (http://www-calipso.larc.nasa.gov/) and references therein.
A smaller value of S1=30 is used in the CALIOP extinction retrieval to obtain the
overall semi-quantitative aerosol profile. As a result, the extinction coefficient retrieved
10
from the CALIOP measurement might be smaller than that from the NIES lidar network measurements by a factor of ca. 0.6 (=30/50) for optically thinner cases. Fixed S1
might engender excessive decay within the cloud layer (S1is around 20) and then give
over-estimation of aerosol under that cloud. However, this is not critical because we are mainly targeting semi-quantitative analysis of dust transport (i.e., a comparison of
15
dust vertical structure and horizontal scale) using the CALIOP measurement.
3 Results and discussion
3.1 Daily variation of meteorological conditions, dust AOT and CALIPSO observation paths
Continuous dust storms occurring in the Gobi Desert and Mongolia swept across vast
20
areas of eastern Asia during 21–31 May 2007. The large dust event was also observed in Japan as latest spring record within the Japan Meteorological Agency observation history.
Figure 2 shows the day-by-day dust transport combined with meso-scale low-pressure systems and cloud image between 21 May and 28 May 2007. It includes
25
con-ACPD
8, 8715–8742, 2008 Three-dimensional transport structure of Asian dust Y. Hara et al. Title Page Abstract Introduction Conclusions References Tables Figures ◭ ◮ ◭ ◮ Back CloseFull Screen / Esc
Printer-friendly Version Interactive Discussion tour) at 09:00 UTC, simulated surface wind vector (yellow), and the CALIPSO
observa-tion path (light blue line). The path-time informaobserva-tion of CALIPSO measurement is also written at the bottom of the figure; L in the figure shows the location of the low-pressure system. Symbols of L1–1–10, L2–1–5, upper troposphere dust layer UTD-1–4 (>6 km) in the figure denote locations of the vertical profile analysis. The selected CALIPSO
5
path and location do not always coincide with the center of the simulated dust area because CALIPSO observations are limited to catching the center of the dust storm; moreover, the cold front with cloud layer quite frequently accompanies the strong dust storm area, even if CALIPSO has passed over the center of the dust storm area.
Table 2 shows the dust layer depth, layer averaged statistics (potential temperature,
10
RH %, attenuated backscatter coefficient and dust extinction coefficient) taken from CALIOP and the RC4 dust model for the region of L1, L2, and UTD.
The first low-pressure system L1 was located in northern Mongolia on 21 May. In
fact, L1deeply developed as it moved eastward; it followed very strong surface winds which triggered dust mobilization in the Gobi Desert. On 23 May, a band of clouds
15
over the eastern Mongolia region is apparent in the MODIS cloud image (Fig. 2c). The maximum surface wind speed was higher than 12.5 m·s−1 over the Gobi Desert on
06:00 UTC, as simulated by RC4. A dense dust cloud is located within the dry slot area, and moved to the northeast China on 24 May; then arrived in Korea on 25 May. Actually, L1continues developing as it moves beyond the Sea of Japan, with a central
20
sea level pressure down to 986 hPa. From late 25 to 26 May, the dust cloud behind the cold front had come to reach a wide coverage of the Japanese archipelago. At the northern part of Mongolia, the subsequently developed low-pressure system L2 appears on 25–26 May. Strong winds on the western side of the low-pressure system continued to mobilize dust; then dust clouds flowed out continuously to southeast Korea
25
and southern Japan.
These two subsequent low-pressure systems (identified as L1 and L2in Fig. 2)
trig-gered the continuous outbreak of dust clouds over eastern Asia. The region between L1and L2 has two phase regions: a cold sector and warm sector. The NIES
ground-ACPD
8, 8715–8742, 2008 Three-dimensional transport structure of Asian dust Y. Hara et al. Title Page Abstract Introduction Conclusions References Tables Figures ◭ ◮ ◭ ◮ Back CloseFull Screen / Esc
Printer-friendly Version Interactive Discussion based lidar network detected a heavy dust layer mainly within the planetary boundary
layer (PBL), but it is also found in elevated dust layer of the 3–5 km altitudes at down-wind northern Japanese sites, as depicted in Fig. 3.
We applied the RC4 dust model assimilated by NIES lidar observation for these events to clarify meteorological mechanisms for generating a vertical structure of dust
5
transport. In the following sub-section, the RC4 dust model is used for detailed analysis of the 3-D dust transport structure from dust source regions to long-range downwind regions both with the NIES lidar network and with NASA/CALIOP measurements. 3.2 Time-height analysis with NIES Lidar network
Figure 3 shows (a) a time-series of dust AOT (z<6 km), (b) a time-height cross-section
10
of observed dust extinction coefficient by NIES lidar, and (c) a time-height cross section of the potential temperature and dust extinction coefficient by RC4 model for four NIES lidar sites. In Fig. 3a, the blue line represents the result without assimilation; the red line shows that with assimilation. The dust AOT from CALIOP was also calculated as shown by red symbols in Fig. 3a when CALIPSO passed within 200 km of the NIES
15
lidar site. The solid circle denotes CALIOP data taken under an almost cloud-free condition, whereas the open-cross circle denotes that under cloudy conditions, which might cause large error in inversion results.
The observed vertical structures of the dust layer were simulated quite well by RC4. The first mid-latitude low-pressure system L1 mobilizes heavy dust storms from 21 to
20
23 May in the Gobi Desert. The time delay (transport) of the first dust peak from Beijing and Seoul to Japanese sites is apparently from 23 May to 26 May. At Beijing, a dense deep dust layer from the surface to 3–4 km is apparent on 24 May; this dust layer was so thick that the lidar signal was unable to penetrate into the free atmosphere. The dust cloud accompanied by the cold front approached Seoul on 25 May, then Nagasaki and
25
Toyama on 25–26 May. The RC4 model reproduced both correct timing of the arrival and dust layer height correctly.
meteorolog-ACPD
8, 8715–8742, 2008 Three-dimensional transport structure of Asian dust Y. Hara et al. Title Page Abstract Introduction Conclusions References Tables Figures ◭ ◮ ◭ ◮ Back CloseFull Screen / Esc
Printer-friendly Version Interactive Discussion ical condition. The vertical gradient of potential temperature takes an isothermal profile
from the surface to 5 km altitude on 26–27 May; then the dust layer depth deepened both in observation and RC4 results. The MODIS cloud images (Fig. 2f) show that the warm sector region of L2 locates in the vicinity of Beijing on 26 May; the transported
dust was within this sector. In the warm sector of low-pressure system, the ascending
5
air motion plays an important role in upward transport of dust from PBL to the free atmosphere. At Seoul, elevated dust layer is apparent on 27–28 May, reaching 4 km altitude; an elevated dust layer was also detected at Toyama on 28–29 May in the ver-tical range of 3 km to 5 km elevation. While in Nagasaki, dust continues to appear only within the PBL, which indicates that the structure of the second dust cloud is split into
10
two parts, i.e., the northern part of the Japan islands are mainly affected by the warm sector dust liftup and formation of the elevated dust layer, although the southern part of the Japan islands are controlled by the cold front line. The dust layer remains mainly within the PBL. We will explain the observed and simulated warm sector dust liftup in Sect. 3.4.
15
The RC4 dust model assimilated with the NIES lidar data shows improved agree-ment with lidar data. The magnitude and daily variation of both lidar and RC4 AOT show good agreement at most sites. Table 1 shows the root-mean square differences (RMSDs) for results achieved with and without data assimilation. The RMSD of dust AOT between model and NIES lidar was improved by 31.2–66.9% after introduction
20
of data assimilation. In particular, at Beijing and Seoul, assimilated results mitigate overestimation of the dust extinction coefficient during 26–27 May. However, in Na-gasaki and Toyama, the first dust cloud remains underestimated because the lidar at Beijing was unable to retrieve the whole dust layer above 1.5 km because of the dust layer, which was too thick for optical observations; these missing observation data are
25
important for inverse correction of this underestimation.
Apparently, the variation of CALIOP AOT in Toyama was explained well by ground-based lidar and RC4. However, we also found that the CALIOP AOT under clear-sky conditions is smaller than both NIES lidar and RC4. This underestimate might result
ACPD
8, 8715–8742, 2008 Three-dimensional transport structure of Asian dust Y. Hara et al. Title Page Abstract Introduction Conclusions References Tables Figures ◭ ◮ ◭ ◮ Back CloseFull Screen / Esc
Printer-friendly Version Interactive Discussion from difference of S1 values between NIES lidar and the CALIOP inversion process.
Available observation timing between CALIOP and NIES lidar remains limited. For that reason, we must accumulate more observations to produce sufficient quantitative verification.
3.3 Cross-section analysis along the cold front movement with CALIOP and RC4
5
model
This section presents tracking analyses of the vertical cross-section of dust following the movement of the L1cold front.
Figure 4 shows the vertical cross-section analysis of the particle depolarization ratio (PDR) at 532 nm, dust extinction coefficient along CALIPSO paths, and averaged
ver-10
tical profiles of the dust extinction coefficient for L1–2, L1–4, L1–6 and L1–8 across the first dust storm. The CALIOP data were screened with conditions of 0.02<PDR<1, attenuated backscatter coefficient >8×10⁻⁴ (km−1) to avoid observation noise and
CAD<90 to screen out dense clouds.
An aerosol layer with high PDR, thought to comprise mainly dust, is shown in Fig. 4a.
15
Examination over the source region (L1–2) clarified that the model reproduced the dust
mixing height correctly during the dust outbreak. According to Fig. 4b and c, both modeled and observed cross sections have very similar structures both vertically and horizontally. Cloud bands created by the cold front exist along the region for which the modeled relative humidity is considerably high, and dust aerosols are visible in the
20
PBL behind the cloud band. As the low-pressure system L1 develops, the potential temperature drops gradually; it reaches a minimum value of 296.9 K on L1–6 at 25
May, 17:00 UTC. Based on this cold front tracking analysis, we found that the first dust cloud behind a cold front maintains the PBL height of around 2–3 km from the continent to the Pacific Ocean within the latitude range of 30–44◦N; it then covers the
25
wide region of eastern Asia with high-level dust concentrations. Another interesting point is the change of PDR from the dust source region to the downwind region, i.e., PDR decreases gradually in direct relation to transport distances, especially in a part
ACPD
8, 8715–8742, 2008 Three-dimensional transport structure of Asian dust Y. Hara et al. Title Page Abstract Introduction Conclusions References Tables Figures ◭ ◮ ◭ ◮ Back CloseFull Screen / Esc
Printer-friendly Version Interactive Discussion of surface layer. Detailed analyses will be described in Sect. 3.6.
3.4 Analysis of warm sector dust liftup
In this section, we specifically address the vertical structure of dust between L1 and
L2, and present cross-section analyses of warm sector liftup and cold sector transport within PBL.
5
Figure 5 is the same as Fig. 4, but for the vertical structure L2–1, L2–2, L2–4, and L2–
5 across the second low L2. Please note that figures for L2–2 and L2–4 are unclear
because these are taken during the CALIPSO daytime path with a small signal-to-noise ratio. Therefore, to outline the dust layer, we added a red broken line from the RC4 extinction coefficient value of 0.07 (km−1). From a snapshot of the L
2–4 path on
10
04:00 UTC 27 May, a marked dust structure is visible, with an elevated dust layer at northern latitudes (38–48◦N) between 2 km and 6 km altitude and a low-altitude dust
layer in southern latitudes (30–38◦N).
Figure 5c is important for presenting clear evidence of the warm sector dust liftup from PBL to the free atmosphere near the source region. A MODIS image (Fig. 2g)
15
shows the L2–4 path just across the warm sector of low-pressure system L2. This fact
suggests that the driving force producing the elevated dust layer is a dynamic warm sector updraft associated with low-pressure system activity. Trajectory analysis of the elevated dust layer using the Hybrid Particle Transport Model (HYPACT) (Walko et al., 2001) based on RAMS output shows that the updraft dominates from the surface to
20
upper troposphere in the vicinity of Beijing on 26 May; then the dust cloud is elevated to about 4 km height with a typical ascending speed of 2 km/12 h. This trajectory analysis will be described in Sect. 3.5.
The vertical structures retrieved by CALIOP shown in Fig. 5 are consistent with those by NIES lidar measurements in Sect. 3.2. As portrayed in Figs. 2 and 5, the dust layer
25
is located under a thick cloud. However, RC4 results reveal that the boundary dust layer of thickness of 2 km passed over the East China Sea for the latitude range of 30–36◦N, as shown in Fig. 5c and d.
ACPD
8, 8715–8742, 2008 Three-dimensional transport structure of Asian dust Y. Hara et al. Title Page Abstract Introduction Conclusions References Tables Figures ◭ ◮ ◭ ◮ Back CloseFull Screen / Esc
Printer-friendly Version Interactive Discussion 3.5 3-D Structure of dust cloud transport by low-pressure system
We conduct Lagrangian forward trajectory analysis using HYPACT to investigate dif-ferent transport structures of dust accompanying L1 and L2. Table 3 shows HYPACT trajectory information.
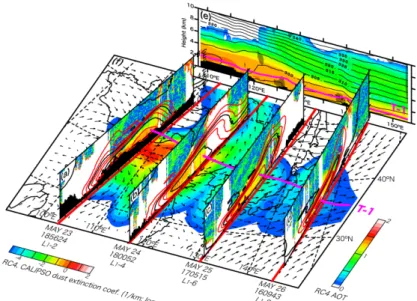
The 3-D transport structure of the first dust cloud, which occurred on 23 May from
5
the Gobi Desert, is presented in Fig. 6 with T-1 forward trajectory analysis. Figure 6a–d show dust extinction coefficients along CALIPSO paths for L1–2, L1–4, L1–6, and L1–
8. The vertical cross section of the dust extinction coefficient and potential temperature from RC4 along the T-1 trajectory are shown in Fig. 6e. Figure 6f shows the dust AOT and surface wind speed interpolated temporally and spatially along the CALIPSO path
10
time.
The T-1 trajectory corresponds with CALIOP observation in the time and trajectory location. The trajectory T-1 maintains altitude of 1 km, and travels nearly 1500 km·d−1.
The 3-D transport structure in which dust is trapped within the potential temperature between 290 and 300 K is readily apparent; the dust travels within PBL for a long
15
distance. Figure 6f shows that the dust AOT outbreak follows the westerly wind: a clear change in wind direction is visible at the center of the low-pressure system. Figure 6 presents the very typical 3-D structure of dust transport accompanied by the cold front and low-pressure system.
Figure 7 is the same as Fig. 6, except for the second dust cloud associated with
low-20
pressure system L2. Therein, T-2 shows the trajectory analysis of a dust cloud taken
in the cold sector; T-3 shows analysis of the elevated dust cloud. Figure 7e is for the trajectory T-3. The masked area in Fig. 7e indicates an updraft region simulated by the RC4 dust model.
The T-2 trajectory time of passage coincides with the CALIOP cross-section
mea-25
surement, although the T-3 trajectory does not completely match up with the CALIOP cross section because of slower transportation of T-3 trajectory. Therefore, the ele-vated dust layer is not clearly visible in Fig. 7c and d. Nevertheless, this figure clearly
ACPD
8, 8715–8742, 2008 Three-dimensional transport structure of Asian dust Y. Hara et al. Title Page Abstract Introduction Conclusions References Tables Figures ◭ ◮ ◭ ◮ Back CloseFull Screen / Esc
Printer-friendly Version Interactive Discussion shows two significant transport structures, associated with cold and warm air advection
around the low-pressure system L2. The T-2 trajectory was departing from a northern point, and traveled southward at a horizontal speed of 1500 km·d−1, maintaining 2 km
altitude, whereas the T-3 trajectory was departing within a warm sector, and ascended from ground to 4 km at about 116◦E. Subsequently, the T-3 trajectory traveled eastward
5
slowly with speed of 900 km·d−1; it reached Toyama on 00:00 UTC 29 May. As depicted
in Fig. 7e, the dynamical updraft in the warm sector of the low-pressure system is an important meteorological mechanism producing an elevated dust layer that plays an important role in long-range transport. The formation of the elevated dust layer tends to occur under a meteorological situation of sequential outbreaks of two low-pressure
10
systems; a very typical example is apparent in the so-called ACE-Asia “Perfect Dust Storm” (Uno et al., 2004). This mechanism is important for supplying nutrition through long-range transport to the distant open ocean.
Transport within the cold sector is also an important process because human so-ciety is considerably affected by dust-polluted PBL and dust cloud passage through
15
the industrial areas of eastern Asia. Therefore, complicated processes of internal or external mixing occur between dust and anthropogenic aerosols, in which the mixing status plays an important role in human health and radiative balance. In the next sec-tion, we examine the changing of optical properties of dust cloud during outflow using wavelength ratio and aerosol depolarization ratio retrieved by CALIOP.
20
An L1event is characterized as a severe dust storm with the low average potential temperature of 301.7 K, whereas an L2dust event is understood to be a more moderate
dust event than L1 with the average potential temperature of 305.5 K at each altitude
of the dust layer. The maximum dust extinction coefficient derived from CALIOP is 0.349 km−1 on the L
1–2 path. The dust layer depth (see Table 2) behind the cold front
25
of L1 is 1320–3120 m (1847–4149 m) from CALIOP (from RC4). For the L2 event,
the dust depth is 2040–4200 m (2721–4666 m) for observation (RC4). Actually, RC4 tends to overestimate the dust layer depth because of coarser vertical resolution than CALIOP measurement. However, we can obtain a good correlation coefficient of 0.743
ACPD
8, 8715–8742, 2008 Three-dimensional transport structure of Asian dust Y. Hara et al. Title Page Abstract Introduction Conclusions References Tables Figures ◭ ◮ ◭ ◮ Back CloseFull Screen / Esc
Printer-friendly Version Interactive Discussion between the simulated and observed layer depth. The upper troposphere dust (UTD as
presented in Table 2) layer also can be found on 22–24 May; the dust layer heights are 5520–11 880 km (5350–11 201 km) based on CALIOP (RC4), and peaks of the dust layer are higher than 6 km. The origin of this UTD can be considered as regions other than the Gobi Desert because of the considerably high altitude of the dust layer (e.g.,
5
Taklimakan Deser region; Liu et al., 2008).
3.6 Correlation of color ratio and particle depolarization ratio
The CALIOP device provides aerosol information for two wavelengths of 532 and 1064 nm. The wavelength ratio of aerosol backscattering coefficients (defined as the color ratio; CR) indicates the aerosol size information. The relationship between CR
10
and the particle depolarization ratio (PRD) plays an important role in characterization of aerosols (Sugimoto et al., 2002). Therefore, the scatter diagram derived from CALIOP is useful to clarify aging of pure dust particles during long-range dust transport. The region of analysis was selected based on trajectory analysis T-1 to track the same dust mass. We applied the screening method described in Sect. 3.3 to exclude the cloud
15
layer.
Figure 8 shows a scatter diagram of CR and PDR from L1–2, 4, 6, and 8 data for
three altitude levels. CALIOP data were averaged within 39.3 km horizontally and 1 km vertically. The solid triangles show arbitrary values for (A) the pure sulfate, (B) pure dust, (C) sea salt accumulation mode and (D) sea salt coarse mode, respectively. The
20
solid line shows the theoretical curve for an external mixture of A and B.
A clear difference of aerosol characteristic is apparent among paths, particularly in Fig. 8a: in the dust source region L1–2, aerosol particles uniformly have high PDR
greater than 0.3, and CR of 0.7–0.86. The L1–2 data are considered to show the information of pure dust particles which have just been emitted from the Gobi Desert
25
region. As the dust cloud is transported down to the east, PDR decreases gradually; however, the CR does not change much. The L1–4 data points across northeast China fall on a theoretical curve of the external mixture of sulfate and dust, and L1–6 data
ACPD
8, 8715–8742, 2008 Three-dimensional transport structure of Asian dust Y. Hara et al. Title Page Abstract Introduction Conclusions References Tables Figures ◭ ◮ ◭ ◮ Back CloseFull Screen / Esc
Printer-friendly Version Interactive Discussion points across Japan fall under the theoretical curve. Finally, regarding L1–8 data over
the Pacific Ocean, some dots are distributed in high CR and low PDR. In addition to the internal mixing of dust and sulfate, there is a possibility that dust particles were mixed with sea salt since data was obtained for PBL over ocean.
Several processes change and age dust and air pollution particles. Size-dependent
5
gravitational settling and dry/wet deposition of dust particles and internal or external mixing of dust and air pollutant particles are main processes of decreasing PDR. In eastern Asia, emission of anthropogenic pollutants has increased with recent rapid Asian economic growth. Therefore, it is usually difficult to separate effects of pollutants from those of dust deposition processes for decreasing PDR. Application of a regional
10
chemical transport model, CMAQ, shows that high concentrations of anthropogenic pollutants such as O3and sulfate aerosols were also transported within the dry slot
be-hind the cold front line of L1. The CMAQ results support the strong possibility of mixing
of dust and sulfate during the low-altitude dust transport. Additionally, RC4 predicted high concentration field of sea salt in boundary layer over L1–8, therefore aerosols in
15
the layer were suggested to be mixture of dust, sulfate and sea salt. Figure 8a can be understood as a typical aging process of pure dust with air pollutants and sea salt. In the upper altitude cases (b) and (c), such a clear aging step is not apparent, which suggests that the mixing of air pollutants occurred mainly at low altitude. As presented in Fig. 8a, both high and low PDR values distributed below 1 km in latitudes of 32◦–
20
38◦N, which suggests that, in low-altitude dust transport cases, changing (or aging)
from external to internal mixing phases of dust and pollutants occurs frequently. This scatter diagram using data obtained by tracking the same dust cloud enables analyses of the aging of pure dust particles.
4 Conclusions
25
Detailed analyses by integrating the NASA space-borne lidar CALIOP, RC4 dust trans-port model, and the ground-based NIES lidar network clarified 3-D structures of Asian
ACPD
8, 8715–8742, 2008 Three-dimensional transport structure of Asian dust Y. Hara et al. Title Page Abstract Introduction Conclusions References Tables Figures ◭ ◮ ◭ ◮ Back CloseFull Screen / Esc
Printer-friendly Version Interactive Discussion dust transport triggered by two subsequent low-pressure systems L1 and L2 during
21–28 May 2007. The NIES lidar observation data were used for dust model assimi-lation. Assimilated results mitigated overestimation of dust concentration by reducing 17.4% of dust emissions and improved the RMSD of dust AOT between the model and NIES lidar data by 31.2–66.9%. Assimilated dust profiles by RC4 were verified using
5
the CALIOP dust cross-section from the dust source region to the long-range down-wind region down to the Pacific Ocean. From comparison, we found that the vertical and horizontal structure of dust cloud coincided well between RC4 results and CALIOP measurements.
We clarified two important transport mechanisms of Asian dust in the PBL and the
10
free atmosphere; the first is a low-altitude dust outbreak within the dry slot region of the well-developed low-pressure system; the other is the formation of an elevated dust layer within the warm sector of the low-pressure system. The warm sector liftup dust layer was presented clearly by CALIOP and RC4. Results showed that the dust cloud located in the cold (warm) sector is transported within the boundary layer (up to the
15
free atmosphere) through the low-pressure system that has a descending (ascending) motion.
The aging of pure dust particles was investigated using the particle depolarization ra-tio (PDR) at 532 nm and the color rara-tio (CR) at 1064 nm and 532 nm for the low-altitude dust transport case by tracking nearly the same dust air mass. A clear difference of
20
aerosol characteristic among paths was found the layer below 1 km altitude: aerosols with uniformly high PDR were observed over the dust source region, whereas the mix-ing states between air pollution aerosol and dust were found in the downwind region over Japan and the Pacific Ocean. This difference suggests a change from the external to internal mixing state of spherical aerosols and dust in the surface layer.
25
Results presented in this paper showed that the integrated analysis of 3-D dust ob-servation and numerical dust transport model plays an important role in elucidating and characterizing dust phenomena. For this study, we used different S1values for CALIOP
ACPD
8, 8715–8742, 2008 Three-dimensional transport structure of Asian dust Y. Hara et al. Title Page Abstract Introduction Conclusions References Tables Figures ◭ ◮ ◭ ◮ Back CloseFull Screen / Esc
Printer-friendly Version Interactive Discussion using the official CALIOP extinction coefficient based on the variable S1 setting from
NASA, which is scheduled for release in 2008.
Acknowledgements. This work was partly supported by the Global Environment Research
Fund of the Ministry of the Environment, Japan (C-061), and a Grant-in-Aid for Scientific Research under grant 17360259 from the Ministry of Education, Culture, Sports, Science
5
and Technology, Japan. Lidar observations at Beijing were conducted with the cooperation of Z. Wang of the Institute of Atmospheric Physics, China and NIES. The CALIPSO data were obtained from the NASA Langley Research Center Atmospheric Sciences Data Center. The MODIS cloud image used in Fig. 2 was obtained from the NRL/Monterey Aerosol Page (http://www.nrlmry.navy.mil/aerosol).
10
References
Fernald, F. G.: Analysis of atmospheric LIDAR observations: Some comments, Appl. Opt., 23, 652–653, 1984.
Liu, Z., Sugimoto, N., and Murayama, T.: Extinction-to-backscatter ratio of Asian dust observed with high-spectral-resolution LIDAR and Raman LIDAR, Appl. Opt., 41, 2760–2767, 2002.
15
Liu, Z., Vaughan, M. A., Winker, D. M., Hostetler, C. A., Poole, L. R., Hlavka, D., Hart, W., and McGill, M.: Use of probability distribution functions for discriminating be-tween cloud and aerosol in lidar backscatter data, J. Geophys. Res., 109, D15202, doi:10.1029/2004JD004732, 2004.
Liu, Z., Liu, D., Huang, J., Vaugham, M., Uno, I., Sugimoto, N., Kittaka, C., Trepte, C., Wang,
20
Z., Hostetler, C., and Winker, D.: Airbone dust distribution over the Tibetan Plateau and surrounding areas derived from the first year of CALIPSO lidar observations, Atmos. Chem. Phys. Discuss., 8, 5957–5977, 2008,
http://www.atmos-chem-phys-discuss.net/8/5957/2008/.
Shimizu, A., Sugimoto, N., Matsui, I., Arao, K., Uno, I., Murayama, T., Kagawa, N., Aoki, K.,
25
Uchiyama, A., and Yamazaki, A.: Continuous observations of Asian dust and other aerosols by polarization lidars in China and Japan during ACE-Asia, J. Geophys. Res., 109, D19S17, doi:10.1029/2002JD003253, 2004.
ACPD
8, 8715–8742, 2008 Three-dimensional transport structure of Asian dust Y. Hara et al. Title Page Abstract Introduction Conclusions References Tables Figures ◭ ◮ ◭ ◮ Back CloseFull Screen / Esc
Printer-friendly Version Interactive Discussion
plumes in the Northwest Pacific with a two-wavelength polarization lidar on board the re-search vessel Mirai, Geophys. Res. Lett., 29(19), 1901, doi:10.1029/2002GL015112, 2002. Sugimoto, N., Shimizu, A., Matsui, I., Dong, X., Zhou, J., Bai, X., Zhou, J., Lee, C.-H., Yoon,
S-C., Okamoto, H., and Uno, I.: Network observations of Asian dust and air pollution aerosols using two-wavelength polarization Lidars, 23rd International Laser Radar Conference, July
5
2006 Nara, Japan (23ILRC, ISBN 4-9902916-0-3), 851–854, 2006.
Takemura, T., Uno, I., Nakajima, T., Higurashi, A., and Sano, I.: Modeling study of long-range transport of Asian dust and anthropogenic aerosols from East Asia, Geophys. Res. Lett., 29(24), 2158, doi:10.1029/2002GL016251, 2002.
Uno, I., Amano, H., Emori, S., Kinoshita, K., Matsui, I., and Sugimoto, N.: Trans-Pacific yellow
10
sand transport observed in April 1998: A numerical simulation, J. Geophys. Res., 106(D16), 18 331–18 344, 2001.
Uno, I., Satake, S., Carmichael, G. R., et al.: Numerical study of Asian dust transport during the springtime of 2001 simulated with the Chemical Weather Forecasting System (CFORS) model, J. Geophys. Res., 109, D19S24, doi: 10.1029/2003JD004222, 2004.
15
Uno, I., Wang, Z., Chiba, M., Chun, Y.-S., Gong, S., Hara, Y., Jung, E., Lee, S.-S., Liu, M., Mikami, M., Music, S., Nickovic, S., Satake, S., Shao, Y., Song, Z., Sugimoto, N., Tanaka, T., and Westphal, D.: Dust model intercomparison (DMIP) study over Asia – Overview, J. Geophys. Res., 111, D12213, doi:10.1029/2005JD006575, 2006.
Uno, I., Yumimoto, K., Shimizu, A., Hara, Y., Sugimoto, N., Wang, Z., Liu, Z., and Winker, D.
20
M.: 3-D Structure of Asian Dust Transport revealed by CALIPSO Lidar and a 4DVAR Dust Model, Geophys. Res. Lett., 35, L06803, doi:10.1029/2007GL032329, 2008.
Yumimoto, K., Uno, I., Sugimoto, N., Shimizu, A., and Satake, S.: Adjoint inversion mod-elling of dust emission and transport over East Asia, Geophys. Res. Lett., 34, L08806, doi:10.1029/2006GL028551, 2007a.
25
Yumimoto, K., Uno, I., Sugimoto, N., Shimizu, A., Liu, Z., and Winker, D. M.: Numerical Mod-eling of Asian Dust Emission and Transport by Adjoint Inversion using Lidar Observation Network, Atmos. Chem. Phys. Discuss., 7, 15 955–15 987, 2007b.
Walko, R. L., Tremback, C. J., and Bell, M. J.: HYPACT: Hybrid Particle And Concentration Transport Model User’s Guide, ASTER Division, Mission Research Corp, 2001.
30
Winker, D. M., Hunt, W. H., and McGill, M. J.: Initial performance assessment of CALIOP, Geophys. Res. Lett., 34, L19803, doi:10.1029/2007GL030135, 2007.
ACPD
8, 8715–8742, 2008 Three-dimensional transport structure of Asian dust Y. Hara et al. Title Page Abstract Introduction Conclusions References Tables Figures ◭ ◮ ◭ ◮ Back CloseFull Screen / Esc
Printer-friendly Version Interactive Discussion
Table 1. Locations of NIES lidar Sites, RMSD, and Dust emission statistics.
Station Longitude Latitude CTM/RMSD RC4/RMSD Reduced ratioa
◦E ◦N AOT AOT % Beijing 116.46 39.92 0.487 0.223 −54.6 Seoul 126.90 37.50 0.329 0.109 −66.9 Hedo/Okinawa 128.25 26.87 0.070 0.076 +8.6 Nagasaki 129.86 32.78 0.166 0.171 +3.0 Matsue 133.01 35.21 0.252 0.173 −31.3 Toyama 137.10 36.70 0.217 0.134 −38.2 Niigata 138.94 37.84 0.189 0.130 −31.2 Tsukuba 140.12 36.05 0.189 0.111 −41.3 Sendai 140.84 38.25 0.205 0.134 −34.6 CTM/ RC4/ Differenceb Emission (Tg) Emission (Tg) Emission (Tg) Dust Emission – – 74.9 61.9 −17.4
a
Improved ratio by data assimilation for AOT
b
ACPD
8, 8715–8742, 2008 Three-dimensional transport structure of Asian dust Y. Hara et al. Title Page Abstract Introduction Conclusions References Tables Figures ◭ ◮ ◭ ◮ Back CloseFull Screen / Esc
Printer-friendly Version Interactive Discussion
Table 2. Characteristics of dust layers associated with low-pressure systems L1and L2, and the downwind upper troposphere dust (UTD) layer.
Label Date Path time Lat. Range Surface Elev. Zd(Layer depth)* Θ RH Atn. Bsc. km−1sr−1 Dust Ext. Coef. *
May hhmmss (◦N) (m) (m) (K) (%) km−1 UTC L1−1 21 190843 40–42 1021 3120 308.7 57.3 0.00240 0.057 4149 0.108 L 1−2 23 185624 36–39 1331 1320 300.7 29.8 0.00815 0.349 2208 0.255 L1−3 24 053616 35–37 915 2040 308.0 14.8 0.00422 0.150 2458 0.163 L 1−4 24 180052 36–37 0 2640 300.4 26.0 0.00387 0.181 2193 0.377 L1−5 25 044044 33–35 0 2040 301.0 20.1 0.00403 0.137 1847 0.295 L 1−6 25 170515 34–36 0 2400 296.9 48.6 0.00330 0.086 1994 0.165 L1−7 25 184410 33–37 0 2400 298.7 49.9 0.00451 0.130 1994 0.162 L 1−8 26 160943 34–35 0 2040 299.2 38.5 0.00213 0.082 1847 0.109 L1−9 27 165301 31–33 0 2520 303.4 35.0 0.00279 0.079 3961 0.091 L1−10 28 155724 30–32 0 1320 300.7 47.9 0.01012 0.160 3292 0.072 L2−1 25 184410 40–41.5 1141 3240 309.5 21.5 0.00156 0.020 3533 0.081 L2−2n 26 052402 42–44 965 3000 306.4 50.3 0.00343 0.110 3769 0.129 L2−2s 26 052402 30–31.5 0 2040 310.1 23.5 0.00206 0.022 2721 0.171 L2−3 26 174833 38.5–40 0 3960 303.3 33.1 0.00158 0.013 4519 0.085 L2−4 27 042825 37.5–39 0 4200 304.9 31.5 0.00189 0.019 4519 0.107 L2−5 28 173620 34.5–35 0 3360 302.2 56.8 0.00200 0.052 4666 0.046 UTD1 22 181306 39–40 0 8280–10800 334.5 17.0 0.00126 0.021 8601–9901 0.014 UTD2 23 171734 36–37 0 7080–9120 327.5 49.2 0.00116 0.015 6001–8601 0.018 UTD3 23 031407 37.5–38 0 6720–11880 324.0 19.1 0.00080 0.004 6001–11201 0.003 UTD4 24 162157 34–35 0 5520–7800 325.6 27.3 0.00093 0.004 5350–8601 0.015
ACPD
8, 8715–8742, 2008 Three-dimensional transport structure of Asian dust Y. Hara et al. Title Page Abstract Introduction Conclusions References Tables Figures ◭ ◮ ◭ ◮ Back CloseFull Screen / Esc
Printer-friendly Version Interactive Discussion
Table 3. Starting locations of forward trajectories.
Label Date UTC Starting point of Altitude Surface May forward trajectory from sea level (m) Elevation (m) T-1 23 19:00 42.0◦N, 108.3◦E 2022 1273
T-2 25 19:00 42.0◦N, 111.4◦E 4638 1430
ACPD
8, 8715–8742, 2008 Three-dimensional transport structure of Asian dust Y. Hara et al. Title Page Abstract Introduction Conclusions References Tables Figures ◭ ◮ ◭ ◮ Back CloseFull Screen / Esc
Printer-friendly Version Interactive Discussion 90°Ε 105°Ε 120°Ε 135°Ε 1 176 (g/m2) 30°Ν 45°Ν topo = 1500, 2500, 3500, 4500 (m)
1
2
3
4
5 6
7
8
9
Figure 1
Fig. 1. Model domain and distribution of emission intensity (gray tone level). Dots represent
the locations of NIES lidar network. Contour lines are the topographical elevations. The NIES lidar sites are: 1, Beijing; 2, Seoul; 3, Hedo; 4, Nagasaki; 5, Matsue; 6, Toyama; 7, Niigata; 8, Tsukuba; and 9, Sendai.
ACPD
8, 8715–8742, 2008 Three-dimensional transport structure of Asian dust Y. Hara et al. Title Page Abstract Introduction Conclusions References Tables Figures ◭ ◮ ◭ ◮ Back CloseFull Screen / Esc
Printer-friendly Version Interactive Discussion
Fig. 2. MODIS cloud images, CALIPSO orbit paths (light blue line) and RC4 dust AOT (thick
red contour). Vectors show the wind field at 140 m a.g.l. Six-digit numbers at the bottom of each figure are the CALIPSO path times (HHMMSS).
ACPD
8, 8715–8742, 2008 Three-dimensional transport structure of Asian dust Y. Hara et al. Title Page Abstract Introduction Conclusions References Tables Figures ◭ ◮ ◭ ◮ Back CloseFull Screen / Esc
Printer-friendly Version Interactive Discussion
Figure 3
Fig. 3. (a) Comparisons of NIES lidar (gray circles) and RC4 dust AOT (lines). AOT is
cal-culated to a height of less than 6 km for the Beijing, Seoul, Nagasaki, and Toyama locations. The blue line shows the result without assimilation; the red line shows that with assimilation. Symbols (solid and open-cross circle) are AOT derived from CALIOP, as described in the text. The time-height cross section of (b) dust extinction coefficient observed by lidar (km−1) and (c)
ACPD
8, 8715–8742, 2008 Three-dimensional transport structure of Asian dust Y. Hara et al. Title Page Abstract Introduction Conclusions References Tables Figures ◭ ◮ ◭ ◮ Back CloseFull Screen / Esc
Printer-friendly Version Interactive Discussion
Fig. 4. (Left) Vertical cross-section of the CALIOP particle depolarization ratio, (Middle) CALIOP dust extinction coefficient (color), RC4 dust extinction coefficient (thick red contour), RAMS relative humidity (black dashed contour) and region of CAD>90 (by light pink area) for paths L1–2, 4, 6, and 8. (Right) Averaged vertical profile of dust extinction coefficient for
ACPD
8, 8715–8742, 2008 Three-dimensional transport structure of Asian dust Y. Hara et al. Title Page Abstract Introduction Conclusions References Tables Figures ◭ ◮ ◭ ◮ Back CloseFull Screen / Esc
Printer-friendly Version Interactive Discussion
ACPD
8, 8715–8742, 2008 Three-dimensional transport structure of Asian dust Y. Hara et al. Title Page Abstract Introduction Conclusions References Tables Figures ◭ ◮ ◭ ◮ Back CloseFull Screen / Esc
Printer-friendly Version Interactive Discussion
Figure 6
Fig. 6. 3-D analysis of CALIOP and RC4 cross-section. (a)–(d) Vertical cross-sections of
CALIPSO path (L1–2, 4, 6, and 8) by CALIOP dust extinction (color) and RC4 dust extinction coefficient (thick red line). Red lines (T-1) show forward trajectories starting from north of L1–2 (start 23 May, 19:00 UTC at 2022 m MSL). (e) The longitudinal cross-section along the T-1 from the RC4 dust extinction coefficient (color) and potential temperature (contour).
ACPD
8, 8715–8742, 2008 Three-dimensional transport structure of Asian dust Y. Hara et al. Title Page Abstract Introduction Conclusions References Tables Figures ◭ ◮ ◭ ◮ Back CloseFull Screen / Esc
Printer-friendly Version Interactive Discussion
Fig. 7. 3-D analysis of CALIOP and RC4 cross-section. (a)–(d) Vertical cross-sections of
CALIPSO path (L2–1, 3, L1–9, and L1–10) by CALIOP dust extinction (color) and RC4 dust extinction coefficient (thick red line). The orange line (T-2) and red line (T-3) respectively de-pict forward trajectories from the L2–1 path starting at 25 May, 19:00 UTC at 4638 m and 1460 m MSL. (e) Longitudinal cross-section along the T-3 from RC4 dust extinction coefficient (color) and the potential temperature (contour).
ACPD
8, 8715–8742, 2008 Three-dimensional transport structure of Asian dust Y. Hara et al. Title Page Abstract Introduction Conclusions References Tables Figures ◭ ◮ ◭ ◮ Back CloseFull Screen / Esc
Printer-friendly Version Interactive Discussion 0.5 0.4 0.3 0.2 0.1 0.0 2.0 1.5 1.0 0.5 0.0 (a) surface-1 km Pa rti cl e D epol ari za tion Ra tio β(1064nm)/β(532nm) LL11-2-2 LL11-8-8 LL11-6-6 LL11-4-4 A A B B C C DD 0.5 0.4 0.3 0.2 0.1 0.0 2.0 1.5 1.0 0.5 0.0 (b) 1-2 km Pa rti cl e D epol ari za tion Ra tio β(1064nm)/β(532nm) LL11-2-2 LL11-6-6 LL11-4-4 LL11-8-8 A A B B C C DD 0.5 0.4 0.3 0.2 0.1 0.0 2.0 1.5 1.0 0.5 0.0 (c) 2-3 km Pa rti cl e D epol ari za tion Ra tio β(1064nm)/β(532nm) LL11-2-2 LL11-6-6 LL11-4-4 LL11-8-8 A A B B C C DD Figure 8
Fig. 8. Scatter diagram of the particle depolarization ratio (PRD) and the color ratio (CR)
derived from L1–2, 4, 6, and 8 CALIOP data for three altitude levels. The solid line shows the theoretical curve for an external mixture of sulfate (A) and dust (B).