HAL Id: hal-00304966
https://hal.archives-ouvertes.fr/hal-00304966
Submitted on 1 Jan 2004HAL is a multi-disciplinary open access archive for the deposit and dissemination of sci-entific research documents, whether they are pub-lished or not. The documents may come from teaching and research institutions in France or abroad, or from public or private research centers.
L’archive ouverte pluridisciplinaire HAL, est destinée au dépôt et à la diffusion de documents scientifiques de niveau recherche, publiés ou non, émanant des établissements d’enseignement et de recherche français ou étrangers, des laboratoires publics ou privés.
managing agricultural pollution at source
C. J. M. Hewett, P. F. Quinn, P. G. Whitehead, A. L. Heathwaite, N. J. Flynn
To cite this version:
C. J. M. Hewett, P. F. Quinn, P. G. Whitehead, A. L. Heathwaite, N. J. Flynn. Towards a nutrient export risk matrix approach to managing agricultural pollution at source. Hydrology and Earth System Sciences Discussions, European Geosciences Union, 2004, 8 (4), pp.834-845. �hal-00304966�
Towards a nutrient export risk matrix approach to managing
agricultural pollution at source
C.J.M. Hewett
1, P.F. Quinn
1, P.G. Whitehead
2, A.L. Heathwaite
3and N.J. Flynn
21 School of Civil Engineering and Geosciences, University of Newcastle, Newcastle upon Tyne, NE1 7RU, UK
2Aquatic Environments Research Centre, Department of Geography, University of Reading, Whiteknights, Reading, RG6 6AB, UK 3Department of Geography, University of Sheffield, Sheffield, S10 2TN, UK
Email for corresponding author: [email protected]
Abstract
A generic Nutrient Export Risk Matrix (NERM) approach is presented. This provides advice to farmers and policy makers on good practice for reducing nutrient loss and is intended to persuade them to implement such measures. Combined with a range of nutrient transport modelling tools and field experiments, NERMs can play an important role in reducing nutrient export from agricultural land. The Phosphorus Export Risk Matrix (PERM) is presented as an example NERM. The PERM integrates hydrological understanding of runoff with a number of agronomic and policy factors into a clear problem-solving framework. This allows farmers and policy makers to visualise strategies for reducing phosphorus loss through proactive land management. The risk of pollution is assessed by a series of informed questions relating to farming intensity and practice. This information is combined with the concept of runoff management to point towards simple, practical remedial strategies which do not compromise farmers ability to obtain sound economic returns from their crop and livestock.
Keywords: nutrients, phosphorus, export, risk, decision support, matrix
Introduction
The degradation of water quality in rivers due to nutrients transported in surface and subsurface flowpaths from farmland is an international environmental issue (SSSA, 2000). The agricultural contribution to nutrient pollution varies as a complex function of land use and management, topography, hydrology, soil type and climate. However, recent work has improved understanding of how nutrients are retained within the landscape and released to waterways via surface and subsurface flow paths (Heathwaite et al., in press).
One contribution that can be made to improving water quality is to identify landscape features such as land drains and tramlines generated by tractors and land management factors such as fertiliser application, crop and tillage regimes, which influence nutrient mobilisation and to introduce remedial measures to reduce nutrient loss due to these factors. Buffer zones, wetlands, water-logging zones and ponds can all play a significant part in reducing nutrient
pollution, as can the targeting of Critical Source Areas (CSAs). Such areas are defined as any zone in the landscape which is in direct hydrological connection with the receiving waters (Gburek et al., 2000; Heathwaite et al., 2000; Heathwaite et al., in press). CSAs can range in spatial scale from a small area trampled by livestock to an entire field which is drained.
A Nutrient Export Risk Matrix (NERM) is a decision support tool to allow farmers and land-use planners to assess the risk of nutrient loss from their land and to explore options to reduce nutrient loss whilst maintaining farmer income (Heathwaite et al., 2003; Quinn, 2004). Despite the complexities of the farming activities and runoff variability, it is possible to communicate both how runoff mobilises available nutrients and how it moves them on and through fields via ditches to larger receiving waters. The tool is targeted at the farm scale, which, by definition, is a small number of fields and their local ditch and river network. At this scale, pollution risk can often be assessed simply by
asking informed questions on farming intensity and practice. This information, combined with the concept of runoff management, can point to straightforward remedial measures such as those discussed above and thus can aid the formation of agri-environmental policy. Thus, the objectives of the NERM are to provide a tool which, in a clear, concise manner, communicates the risk of nutrient pollution generated by different farming practices and to provide advice on simple measures that can be implemented at the farm or field scale to reduce that risk. Also the features proposed here, while directed at reducing nutrient loss, may have wider benefits in reducing other pollutants.
The NERM is intended for use with a combination of field experiments and modelling tools such as TopManage, TOPCAT and INCA. While the NERM is a qualitative tool for decision support, these process-based models allow the effect of current practice and changes in practice to be quantified. TopManage is a flow terrain analysis model driven by a topographic digital elevation model (DEM) that allows the dominant flow paths to be represented, evaluated and modified for runoff management (Hewett and Quinn, 2003). The terrain analysis method used is based on the multiple-flow accumulation algorithm of Quinn et al. (1991) to give natural surface or subsurface flow patterns. Traditionally this type of topographic information has been used to study the operation of variable source areas (Quinn and Beven, 1993) and complements the simple variable source area study described by Heathwaite et al. (2000). The flow connectivity model simulates connectivity between land and stream by combining existing surface and subsurface flow assumptions with high resolution digital terrain analysis. This can be used to distinguish between surface, subsurface lateral, drain flow and ditch flow accumulation. The key terrain attribute calculated in TopManage is the upslope accumulated area A, calculated in m2 which is a measure of the volume of water
accumulating in a particular location. As flow accumulates/ concentrates, the value of A increases. Thus, areas receiving large amounts of overland flow can be visualised clearly. If a design storm is used to give the likely flow depth, for example 10 mm of overland flow, then A can be converted to a volume, allowing the capacity of a design feature such as a storage pond to be estimated. In ditch networks the design storm runoff multiplied by A estimates the total flow in the ditch. TOPCAT is a lumped conceptual hydrological catchment scale flow and nutrient model that provides time series modelling of flow and of nitrate, phosphates and phosphorus. TOPCAT is a simplification of the model TOPMODEL (Quinn and Beven, 1993) and as such, uses identical soil moisture stores and subsurface flow equations. TOPCAT does not use a topographic distribution function
and thus does not allow the representation of topographically controlled variable source areas. The model also contains a baseflow/dry weather flow component and two overland flow components that are caused by intense agricultural management practices (www.ncl.ac.uk/wrgi/TOPCAT). INCA is a process-based catchment scale hydrological and nutrient model that simulates the storage and transport of nitrogen and phosphorus in the soil, groundwater and in-stream components of a river system (Whitehead et al., 1998; Wade et al., 2002a, b; Wade, 2004).
The Phosphorus Export Risk Matrix
As an example NERM, the Phosphorus Export Risk Matrix (PERM) is presented. The PERM integrates and prioritises the key factors controlling phosphorus pollution (Quinn and Hewett, 2003). The PERM has been developed in collaboration with stakeholders, including farmers and policy makers, as part of the SEAL project, a multi-disciplinary research project involving field experiments and predictive modelling at a variety of scales to meet the pressures on land and water resources linked to sewage sludge recycling to land (www.sheffield.ac.uk/seal). The PERM described here is designed for arable farming and targets the farm scale as the key scale where the greatest impact on phosphorus loss can be achieved. It is assumed that farms and catchments can be treated in the same way, i.e. hillslopes feeding channel networks. At this time, livestock systems have not been studied, but it is envisaged that a livestock-oriented PERM will be developed in the near future.Figure 1 shows the three-dimensional PERM which takes account of fertiliser application and soil management, flow connectivity and soil type. Assuming that the soil type within a specific field does not vary then only a two-dimensional matrix is needed and this can be visualised as the front face of the cube shown in Fig. 1. This assumption is a pragmatic response to dealing with soil spatial heterogeneity, allowing the approach to be developed in this instance. The aim is to allow farmers to assess their current land use practice and compare it to alternative land management options. The PERM reflects both the phosphorus available to the transport processes and the mechanisms by which the flow propagates through and off the farm. Hence, the PERM identifies a range of potential mitigation strategies to control, intercept, buffer and remediate polluting runoff. Despite the complexity of the phosphorus problem, the level of risk of phosphorus losses can be depicted in a simple form as a risk marker on the matrix, the lowest risk corresponding to the bottom left hand corner of the matrix. High risk of phosphorus loss results in movement up the vertical axis
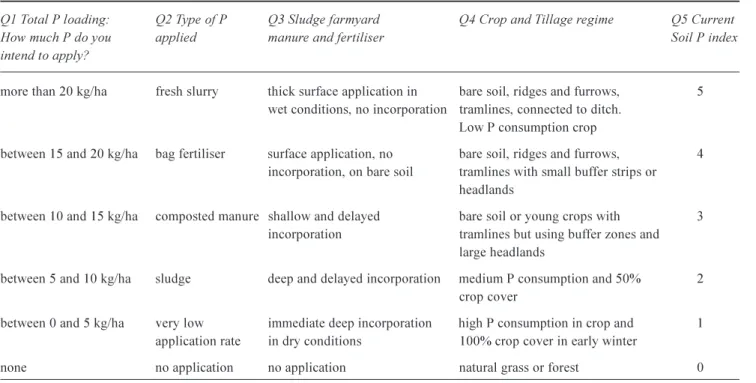
and to the right along the horizontal axis as shown in Fig. 2. The vertical axis of the matrix and its five corresponding questions relate to the relative risk of mobilising the phosphorus available in the soil; fertiliser application and soil management. These involve the P loading, the type of P and type of fertiliser applied, the crop and tillage regime and the soil P index. The first row of Table 1 provides the questions, and the subsequent rows the available options. The higher the answer (2nd row = highest value, 7th row = lowest value) the further the risk marker moves up the
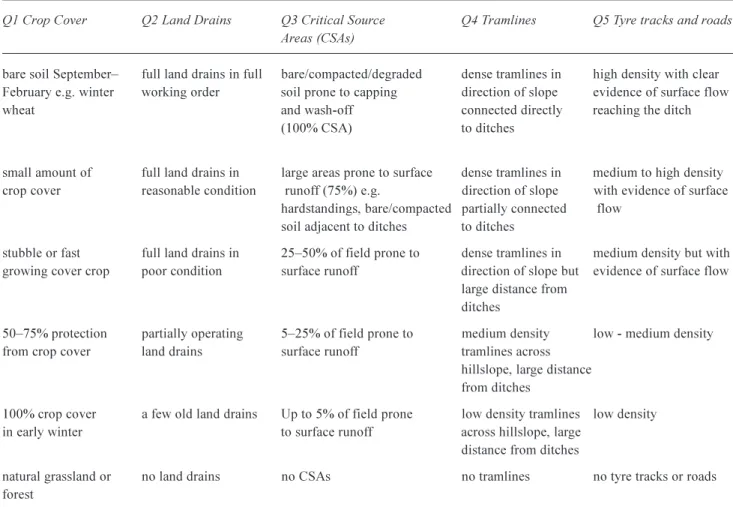
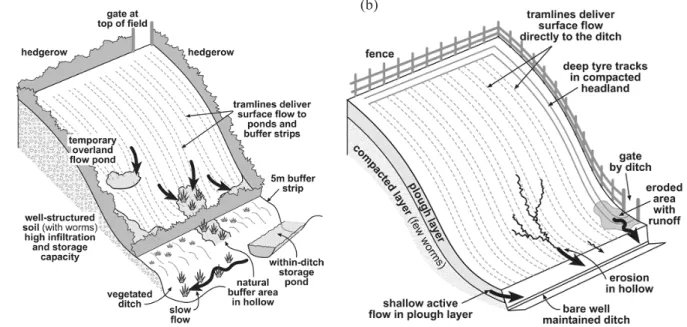
vertical axis on the PERM. The horizontal axis and its ten corresponding questions relate to natural and man-made features that control the runoff and buffering processes in the field. The first five questions, given in full in Table 2, are related to factors which increase risk of P loss; crop cover, land drains, critical source areas, tramlines, tyre tracks and roads. The higher the answer (row) the further the risk marker moves to the right. Questions 6 to 10, given in Table 3, relate to remediation measures which can result in reducing P loss; hedgerows, buffer zones, wetlands and ponds and thus move the risk marker to the left on the matrix. To help the user of the PERM (the farmer or land use planner) to visualise different levels of risk, two example fields are presented:
P E R M hosphorus xport isk atrix Fertiliser application and soil management Flow Connectivity Soil Type
Fig. 1. The Phosphorus Export Risk Matrix (PERM) in 3D
Table 1. P loading and soil management
Q1 Total P loading: Q2 Type of P Q3 Sludge farmyard Q4 Crop and Tillage regime Q5 Current
How much P do you applied manure and fertiliser Soil P index
intend to apply?
more than 20 kg/ha fresh slurry thick surface application in bare soil, ridges and furrows, 5 wet conditions, no incorporation tramlines, connected to ditch.
Low P consumption crop
between 15 and 20 kg/ha bag fertiliser surface application, no bare soil, ridges and furrows, 4 incorporation, on bare soil tramlines with small buffer strips or
headlands
between 10 and 15 kg/ha composted manure shallow and delayed bare soil or young crops with 3
incorporation tramlines but using buffer zones and
large headlands
between 5 and 10 kg/ha sludge deep and delayed incorporation medium P consumption and 50% 2 crop cover
between 0 and 5 kg/ha very low immediate deep incorporation high P consumption in crop and 1 application rate in dry conditions 100% crop cover in early winter
none no application no application natural grass or forest 0
no farming low-medium risk risk markers:
high risk
Table 3. Flow connectivity questions for decreasing risk
Q6 Hedgerows Q7 Buffer Zones Q8 Wetlands Q9 Ponds Q10 Remediation options
no hedgerows no buffer zones no wetlands or no ponds no remediation
water-logging zones
low density of very small riparian zone small wetlands and some temporary ponds attempts to bind P
hedgerows water-logging zones seen during storms into the soil or in ditches
medium density of some buffer zones e.g. medium wetlands and some existing ponds, attempts to bind P into the soil hedgerows 1-2m riparian strips water-logging zones some temporary ponds or in vegetated ditches with
seen during storms good sedimentation medium - high density some buffer zones e.g. large wetlands and small designed and small specifically designed
2-10m riparian strips water-logging zones constructed ponds to ponds/wetlands/filters trap/filter sediment designed to strip P
high density, no large buffer zones e.g. a small designed medium designed and medium specifically designed evidence of ponding >10m riparian strips constructed wetland constructed ponds to ponds/wetlands/filters
processing all the trap/filter sediment designed to strip P runoff from field
high density of large buffer zones a large designed large designed and large specifically designed hedgerows acting as especially in zones constructed wetland constructed ponds to ponds/wetlands/filters barriers to flow of flow concentration processing all the trap/filter sediment designed to strip P
e.g. ponding e.g. hollows runoff from field
Table 2. Flow connectivity questions for increasing risk
Q1 Crop Cover Q2 Land Drains Q3 Critical Source Q4 Tramlines Q5 Tyre tracks and roads Areas (CSAs)
bare soil September full land drains in full bare/compacted/degraded dense tramlines in high density with clear February e.g. winter working order soil prone to capping direction of slope evidence of surface flow
wheat and wash-off connected directly reaching the ditch
(100% CSA) to ditches
small amount of full land drains in large areas prone to surface dense tramlines in medium to high density
crop cover reasonable condition runoff (75%) e.g. direction of slope with evidence of surface
hardstandings, bare/compacted partially connected flow soil adjacent to ditches to ditches
stubble or fast full land drains in 2550% of field prone to dense tramlines in medium density but with growing cover crop poor condition surface runoff direction of slope but evidence of surface flow
large distance from ditches
5075% protection partially operating 525% of field prone to medium density low - medium density
from crop cover land drains surface runoff tramlines across
hillslope, large distance from ditches
100% crop cover a few old land drains Up to 5% of field prone low density tramlines low density
in early winter to surface runoff across hillslope, large
distance from ditches
natural grassland or no land drains no CSAs no tramlines no tyre tracks or roads
1. The field shown in Fig. 3(a) is characterised as having low flow-connectivity and low risk due to fertiliser application. This corresponds to a low-medium risk area of the matrix, adhering to best farming practice (Environment Agency, 2001). It is worth noting that only 510% of the field is lost to production and that 9095% is under typical intense farming.
2. The field shown in Fig. 3(b) is characterised as having high flow-connectivity and high risk due to fertiliser application, corresponding to a high risk area of the matrix.
The PERM is used in the following way:
1. The farmer or land use planner answers both sets of questions according to the current land use for a particular field or set of fields. This provides a plot of the current risk level.
2. The user can then change the answers to some (or all) of the questions enabling the user to assess how changes in practice may increase or decrease the risk of P loss from the field.
The philosophy behind the PERM in particular and the NERM in general is to give a qualitative rather than a quantitative result. What is important is whether a change in land use increases or decreases the risk, not the absolute level of risk. The principal message is that, if you are farming, there are ways of reducing nutrient loss, or no matter where you are on the matrix, you can always improve. However, for the sake of example, a nominal
scoring system is assigned to the questions in this case going from 3 (top row) down to zero (bottom row) with an equal weighting. The nearest integer to the total score due to answering all five questions results in a shift by that number of squares on the matrix. It is, of course possible to assign different weights to different questions.
In many cases of intense arable farming, an honest answer to the questions will tend to give rise to high risk of P loss unless significant changes to P application, flow connectivity or soil management are implemented. This should focus the emphasis of change onto runoff management where more mitigation options are available. In cases where there is low risk of P loss, such as land with low slopes and low rainfall, this should be picked up by the PERM. Ideally the PERM would allow intense profitable farming to occur over most of the land while carefully designed ponds, buffers and wetlands counteract and trap P and sediment. Ultimately a well-designed remediation strategy would recycle P back to the land or remove it from the system.
There may be concerns that specific P management options may increase nitrate loss. For example, there is evidence to suggest that artificial drainage in catchments decreases P loss by reducing surface runoff, but N leaching may be enhanced (Turtola and Paajanen, 1995). The PERM presented here does not deal with management options that might conflict explicitly as it takes no account of nitrate. However, astute choices of land management options should provide a good combination of options for reducing both P and N loss from farmland. Ultimately the NERM will include a PERM and a Nitrate export Risk Matrix (NO3RM), tools
that are currently in preparation.
Fig. 3. Diagrams for visualisation of different levels of risk (a) low-medium risk (b) high risk
Results and Discussion
The NERM is intended to integrate factors that control nutrient pollution risk through a simple decision support matrix (DSM) which in this case is the 2D PERM represented by the front face of the cube shown in Fig. 1. Two case study fields which are SEAL experimental sites are presented: The first, Field A, is known, by field observation, to be dominated by overland flow and the second, Field B, is characterised by high connectivity due to land drains. The two fields consequently require significantly different runoff management plans, discussed below. Even at sites where there is a low likelihood of overland flow, some risk may be associated with extreme events. Therefore, the approach may still be useful in the management of incidental losses (Brazier et al., 2001; Haygarth et al., 2004).
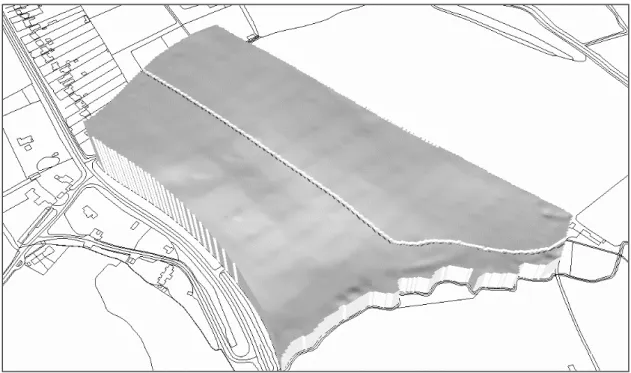
Field A grows winter wheat and has received bag fertiliser and, more recently, bio-solids and the P index of the field varies between 3 and 5. It has bare soil with high clay content and a steep slope often showing evidence of rills and sediment fans. Tramlines run directly down the steepest slope delivering water across a small floodplain into the river. Figure 4(a) shows a three-dimensional map of Field A and Fig. 4(b) shows the PERM results obtained for the current practice for this field. Answering the questions related to fertiliser application and soil management give the initial plot position on the left hand side of Fig. 4(b). Continuing with the questions related to features controlling
runoff and buffering processes results in the final plot position for the overall current risk shown in Fig. 4(b) . Changing the answers to some (or all) of the questions enables farmers or policy makers to assess how changes in practice may increase or decrease the risk of P loss from the field. Figure 5(a) shows upslope flow accumulation for Field A obtained using TopManage.
Three possible runoff management plans for Field A based on expert opinion are suggested:
1. Source mitigation to reduce the magnitude of delivery of diffuse pollutants in the flow paths could be achieved by more effective use of the floodplain CSA by halting sewage sludge application to this zone or taking it out of cultivation completely and leaving it as a buffer zone with an appropriate land use (e.g. woodland, energy
- current risk due to fertiliser application & soil management - overall current risk
Fig. 4. (a) 3D map of Field A
crops). Analysis of the DEM shows that the floodplain occupies 18% of the total field area. However, persuasion alone is unlikely to bring about such a land use change unless it is funded within agri-environmental schemes.
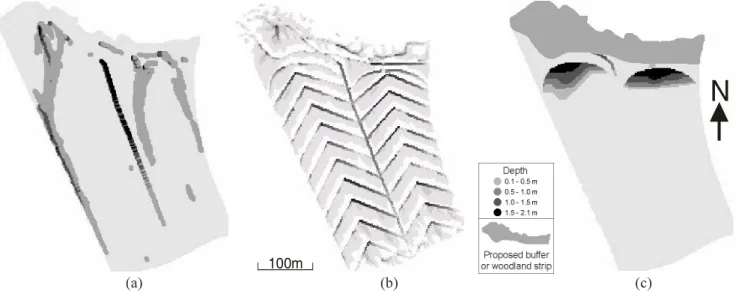
2. Flow path mitigation could be attempted using a managed ploughing regime. One such scenario is simulated in TopManage by adding tramlines to the digital elevation map in a chevron formation which directs overland flow down the slope, using a 10 m spacing, to two storage ponds. The ponds need only occupy 510% of the field area and would remain empty for most of the year to allow short-term storage following storm events. Figure 5(c) shows the results of a simulation involving the addition of a 2 m bund to capture flow. ARCVIEW was used to compute the capacity
of the ponds which were designed to store 1520 mm of overland flow at the edge of the floodplain. When full, the surface area of the ponds would occupy approximately 10% of the field. Before estimating the amount of overland flow that can stored we need to know the upslope area of the field. Using digital terrain analysis this is calculated as 75 000m2. Thus 20 mm of
overland flow during an event would require 1500m3
of flow to be stored. Overland flow of 20 mm during an event would allow 1500 m3 of flow to be stored. The
average depth of the ponds is calculated as 0.75 m and the area 7300 m2 (i.e. approximately 10% of the total
field), providing a maximum storage capacity of 5475 m3. In principle, the flow storage features can easily
retain 20 mm of flow and it is possible to revisit the pond design capacity. The most important conclusion here is that the area of land needed to create a temporary
pond with the capacity to store a large storm event is relatively small. Consequently, features such as small storage areas may be used to trap nutrient-rich sediments in specified locations so that sediment can be recycled back onto the field. Figure 5(b) shows the location of the proposed tramlines and ponds and the resulting upslope flow accumulation and Fig. 5(c) shows the pond storage depth. As an illustration of the effect of runoff management on the NERM the change in plot position on the PERM for this mitigation proposal is shown in Fig. 6.
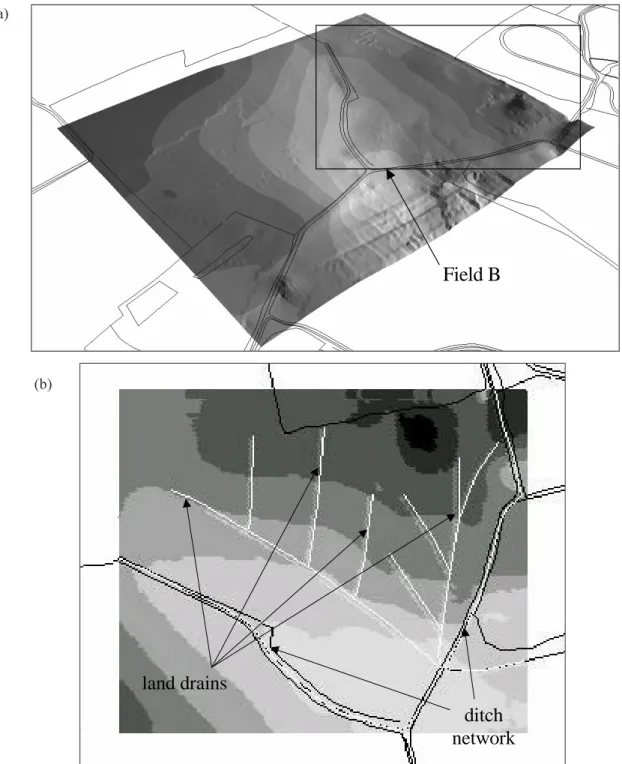
Figure 7(a) shows a three dimensional map of Field B. This field has a network of land drains which connect the flow from all areas of the field, effectively turning the whole field into a critical source area (CSA). Figure 7(b) is a digital terrain map of the field with the land drains shown and Fig. 8(a) shows the PERM for the current practice. Note that the risk marker is on the far right of the PERM, indicating the very high flow connectivity and associated high risk of phosphorus loss. Since the presence of land drains is the cause of the flow connectivity, there is little direct 100m
N
Fig. 5. Upslope flow accumulation maps for Field A (a) without cultivation (b) with flow-sensitive contour tramlines (c) with ponds
generated using a 2m high barrier positioned at the back of the floodplain.
Fig. 6. Change in plot position on the PERM for managed ploughing
regime shown in Figure 5(b)
Field B
land drains
ditch
network
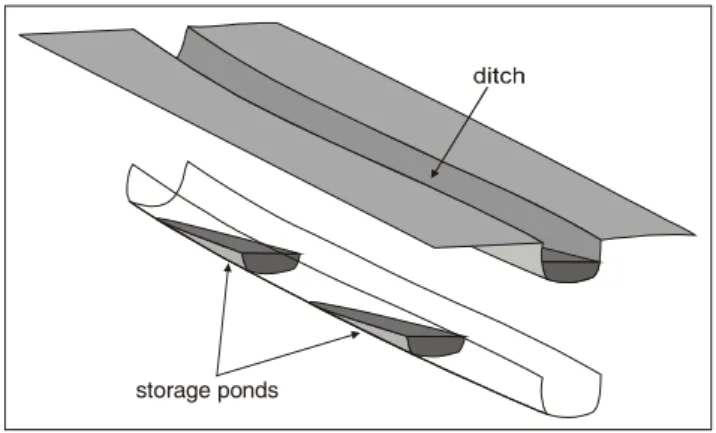
remediation that can be effected on the field itself; thus, the runoff management plan for this field is to intercept flow in the ditch into which the land drains feed. The introduction of a series of shallow cascading ponds is recommended to induce sedimentation and to avoid interfering with the land drains themselves, Fig. 8(b).
Fig. 7. Field B (a) 3D map (b) Digital terrain map with land drains marked
Process Modelling and the NERM
The INCA process based model is essentially an expert system that encapsulates a wealth of knowledge on hydrology, chemistry and ecology in both the terrestrial and the aquatic environment. Hence, it provides an ideal tool for testing hypotheses about the mechanisms controlling nutrient transport at a range of scales. Most importantly, it can provide generic information on fluxes and can be used (a)to inform the Nutrient Export Risk Matrix (NERM). The field research carried out so far suggests that, where agricultural land is subjected to nutrient loadings for agricultural benefit, this may not immediately become a nutrient problem unless the nutrient is in a form to be transported and connectivity exists to a receptor. Therefore, processes related to the within-soil processing of phosphorus are just as important as the risk of that available P being transported to the river channels. A series of INCA-P simulations will be mapped onto a Phosphorus Export Risk Matrix (PERM). It is useful to transfer the INCA results onto a PERM for comparison of numerous simulations. Equally, quantitative values can be added to the matrix making the NERM scientifically more interpretable. This mapping of simulation results also helps generate a more meaningful position for the contour lines related to the level of risk associated with P loss. Until now linear contours lying at 45o to the matrix edge have been used, with regions
of particular risk levels indicated by shaded grey areas (Fig. 2). Finally, the location of the simulations on the PERM can be interpreted more broadly into a general farming classification as outlined at the start of this paper.
INCA-P simulations and mapping
onto the NERM
The INCA-P model has been run to create some generic results that will be used to inform the development of the NERM. This has been done to evaluate the effects of changing bio-solid application rates, initial soil P conditions and hydrological connectivity levels in the catchment. A set of runs has been made, varying these three driving variables and in each case calculating the P export rates for the arable land use component.
Figure 9 shows how P transport rates of 0 to 2.5 kg ha1yr1
vary with bio-solid application rates of 0 to 70 kg ha1yr1
assuming high, medium and low hydrological connectivity. The simulation of varying hydrological connectivity was achieved by decreasing the base flow index between low and high connectivity simulations. Decreasing the base flow index routed more water through the soil and drains, which both have a shorter residence time than the groundwater store. The diagram shows that P export increases in all cases as application rates increase. However, the extent of P loss is highly dependent on connectivity so the highest loss rates are estimated by the model under the high connectivity condition, reflecting the rapid movement of water through the soil and over the surface.
The same simulations can now be used to colonise the NERM/PERM. Figure 10 shows first the shape of the P loss contours that are needed to reflect the simulated P loss. The simulations are plotted as low, medium and high connectivity onto the PERM. The range of P loss caused by the differing
storage ponds
Fig. 8(a). Field B: PERM for current land use
Fig. 8(b). Field B: Remediation in the ditch
0 30 70 Low connectivity Medium connectivity High connectivity 0 0.5 1 1.5 2 2.5 To ta l P lo s s k g h a -1 y -1 Biosolids P input kg ha-1 y-1
P loss from 100% cereal catchment (low initial soil P)
Low connectivity Medium connectivity High connectivity
Figure 9. Predicted P loss assuming changes in bio-solid application
application rates is then plotted. The major conclusion is the double impact that accrues from higher loading and high transport risk. In management terms, this may suggest that tackling the connectivity issue may have a large impact on P reduction. Also, a basic site investigation that can separate high and low connectivity land uses and areas could highlight hot spots for more immediate action.
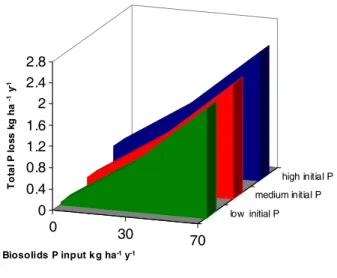
Figure 11 shows the results for P export under conditions of low connectivity but with a range of initial soil P conditions reflecting the history of P applications in a catchment. With low connectivity (i.e. a groundwater-dominated system) a damped response with respect to bio-solids application is observed but with a rapidly increasing loss rate as soil P concentration is increased. This suggests that agricultural areas that have a long history of P application and high initial P levels will lose considerable rates of P even in low connectivity areas. By contrast, Fig. 12 shows the P export for a system that has high connectivity. In this case the loss rate is independent of the soil conditions as bio-solid P loss will increase rapidly as bio-solid applications increase.
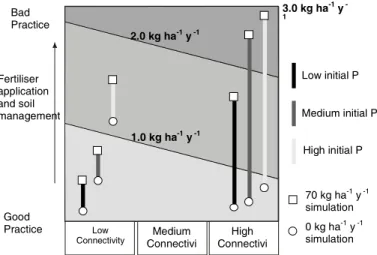
It is possible to map both Fig. 11 and Fig. 12 onto the same PERM, Fig. 13. Again the shape of the contours has changed, allowing for higher total P losses and higher losses associated with no bio-solid application. It would take a large number of simulations before a final pattern for the contours is created, however a general pattern similar to the PERM shown below is likely. The upper limit of P loss may also have to be decided. For example, if a figure of 2 kg ha1yr1 of P loss were to be taken as the maximum allowable
then all other simulations could be classed off the scale. The pattern for low connectivity fields with initial P condition, has little overall effect on P loss even though the
rates of bio-solid application become very high. The medium initial P is higher but again the range of the losses is narrow due to the flow connectivity, though the values are approaching 1 kg ha1yr1. For the case of high initial P, the
Fig. 10. Plotting the results from Fig. 9 onto the 2D PERM reflecting
the range of P loss dependent on bio-solid loading and flow connectivity. 0 30 70 low initial P medium initial P high initial P 0 0.4 0.8 1.2 1.6 To ta l P lo s s kg ha -1 y -1 Biosolid P input kg ha-1 y-1
P loss from 100% cereal catchment (low connectivity)
low initial P medium initial P high initial P
Fig.11. P export under conditions of low connectivity but with a
range of initial soil P conditions reflecting the history of P applications in a catchment 0 30 70 low initial P medium initial P high initial P 0 0.4 0.8 1.2 1.6 2 2.4 2.8 T o ta l P lo ss kg h a -1 y -1 Biosolids P input k g ha-1 y-1
P loss from 100% cereal catchment (high connectivity)
low initial P medium initial P high initial P
Fig. 12. P export for a system that has high connectivity. The loss
rate is independent of the soil conditions as bio-solid P loss will increase rapidly as bio-solid applications increase
Bad Practice Good Practice Low Connectivity Medium Connectivity High Connectivity 70 kg ha-1 y-1 simulation 2.0 kg ha-1 y-1 1.0 kg ha-1 y-1 Low initial P Medium initial P High initial P 3.0 kg ha-1 y-1 Fertiliser application and soil management 0 kg ha-1 y-1 simulation
range is again small but the position of the P export lies between 1 and 2 kg ha1yr1 which reflects the importance
of P loading history. In this case, the high P loss resultant when no bio-solids are applied is due to the initial P concentrations. For the high connectivity scenario the results are very different. Relatively high P losses are seen for even 0 kg ha1yr1 bio-solid loading. The impact of the high
connectivity and the bio-solid loading rate dominate the response. The range of P loss is very high for initial P loading circumstances, which may suggest that the P history is less dominant and that mobilisation of fresh applications is paramount. The P loss from each scenario does reflect the initial P conditions but all the simulation results show that any overloading of bio-solids will generate high P loss. This suggests that both the total amount of P content in the bio-solid must be known and the fraction of the P loss available to be transported needs to be controlled (probably in the form of bio-solids and its immediate incorporation into the soil).
Conclusions
The Nutrient Export Risk Matrix (NERM) is a decision support matrix that highlights in a very simple way the mechanisms by which flow propagates through and off a farm or field and the amount of nutrient likely to be carried by that flow. It is designed to target flows that pose a pollution risk at source, to experiment with managing that flow and to suggest simple, practical recommendations for reducing nutrient loss. Use of the NERM can draw attention to opportunities to disconnect polluting flows from receiving waters before the water leaves the farm. It can also provide a range of viable mitigation strategies to control, intercept, buffer and remediate polluting runoff. Such runoff
management and proactive intervention can be very cheap and thus has little impact on the profitability of the farm itself. However, this is tempered by the fact that improvements will be limited by farmers requirement for sound economic returns from their crop and livestock and that, even with improved crop and soil management, the problem of high rainfall falling on farmers bare soils with high nutrient levels will always remain.
The NERM can operate on a quantitative level as well as on a qualitative level by coupling the NERM approach with process-based models of nutrient dynamics such as INCA, though the uncertainties associated with absolute P loss values remain high. However, the clear dominance of the patterns of P loss associated with P loading, soil management, land uses that induce high flow connectivity and the antecedent runoff risk of certain soils and geological conditions can all be classified relative to each other within a risk matrix. The field work in the SEAL project and more rudimentary site investigation allows differing fields to be mapped at different locations in the NERM, and will provide the data with which to test the linked NERM and INCA approach.
A broad interpretation of land use conditions that are likely to cause unsustainable P losses can be targeted within DEFRA land use management schemes and the potential to manage runoff (Heathwaite et al., 2004) can be addressed. The wide range of possible land-use change options supported in the NERM afford a spectrum of land-use change scenarios that could prove acceptable to farmers themselves. Policy makers too can use both the NERM and INCA to prioritise their message to those who must enforce land-use change and create a knowledgeable community and environment that allows the best farming practices to take hold. A pilot version of the PERM can be freely downloaded from the TOPCAT website (www.ncl.ac.uk/ wrgi/TOPCAT/NERMPWelcome.html).
References
Brazier, R.E., Rowan, J., Anthony, S. and Quinn, P.F., 2001. MIRSED towards an MIR approach to modelling hillslope soil erosion at the national scale. Catena, 42, 5979.
Environment Agency, 2001. Best Farming Practice: Profiting from
a good environment. Environment Agency,UK.
Gburek, W.J., Sharpley, A.N., Heathwaite, A.L. and Folmar, G., 2000. Phosphorus management at the watershed scale. J.
Environ. Qual., 29, 130144.
Haygarth, P.M. , Turner, B.L., Fraser, A., Jarvis, S.C., Harrod, T., Nash, D., Halliwell, D., Page, T. and Beven, K., 2004. Temporal variability in phosphorus transfers: classifying concentration-discharge event dynamics. Hydrol. Earth Syst. Sci., 8, 8897. Heathwaite, A.L., Burke, S. and Quinn, P.F., 2003. The nutrient
export risk matrix (the NERM) for strategic application of bio-solids to agricultural land. IAHS Publlication no. 285, 19.
Fig. 13. The PERM showing both the low connectivity and high
connectivity simulations for low, medium
Good Practice Bad Practice Fertiliser application and soil management Low
Connectivity ConnectiviMedium ConnectiviHigh
70 kg ha-1 y -1 simulation 0 kg ha-1 y -1 simulation 2.0 kg ha-1 y -1 1.0 kg ha-1 y -1 Low initial P Medium initial P High initial P 3.0 kg ha y 1
Heathwaite, L., Quinn, P. and Hewett, C., 2004. Modelling and managing critical source areas of diffuse pollution from agricultural land by simulating hillslope flow connectivity. J.
Hydrol., (In press)
Heathwaite, A.L., Sharpley, A.N and Gburek, W.J., 2000. A conceptual approach for integrating phosphorus and nitrogen management at catchment scales. J. Environ. Qual., 29, 158 166.
Hewett, C. and Quinn, P., 2003. TopManage: A High Resolution GIS Digital Terrain Analysis Tool to Study the Management of Flow on Farms. 7th International Specialised Conference on Diffuse Pollution and Basin Management, Dublin, Ireland.
Sims, T., Glasner K. and Hall, T., 2000. Agricultural Nutrient Management and Environmental Quality, Position of the Soil Science Society of America. Soil Science Society of America, Department of Plant and Soil Sciences, University of Delaware, Newark, DE 19717-1303, ASA/SSSA/CSSA, 2pp.
Quinn, P., 2004. Scale appropriate modelling: representing cause-and-effect relationships in nitrate pollution at the catchment scale for the purpose of catchment scale planning. J. Hydrol., 291, 197217.
Quinn P.F. and Beven, K.J., 1993. Spatial and temporal prediction of soil moisture dynamics, runoff, variable source areas and evaporation for Plynlimon Mid Wales. Hydrol. Process., 7, 425 448.
Quinn, P. and Hewett, C., 2003. An Earth Systems Engineering Approach to the Direct Management of Runoff Flow Paths and Nutrient Remediation at Source. 7th International Specialised Conference on Diffuse Pollution and Basin Management,
Dublin, Ireland.
Quinn, P.F., Beven, K.J., Chevallier, P. and Planchon, O., 1991. The Prediction of Flow Paths using Digital Terrain Analysis.
Hydrol. Process, 5, 5980.
Turtola, E. and Paajanen, A., 1995. Influence of improved subsurface drainage on phosphorus losses and nitrogen leaching from a heavy clay soil. Agr. Water Manage., 28, 295310. Wade, A.J., Durand, P., Beaujouan, V., Wessel, W.W., Raat, K.J.,
Whitehead, P.G., Butterfield, D., Rankinen, K. and Lepisto, A., 2002a. A nitrogen model for European catchments: INCA, new model structure and equations. Hydrol. Earth Syst. Sci., 6, 559 582. (See also Errata. Hydrol. Earth Syst. Sci., 8, 859.) Wade, A.J., Whitehead, P.G. and Butterfield, D., 2002b. The
Integrated Catchments model of Phosphorus dynamics (INCA-P), a new approach for multiple source assessment in heterogeneous river systems: model structure and equations.
Hydrol Earth Syst. Sci., 6, 583606.
Whitehead, P.G., Wilson, E.J. and Butterfield, D., 1998. A semi-distributed Nitrogen Model for Multiple Model for Multiple Structure Assessments in Catchments (INCA): Part I Model Structure and Process Equations. Sci.Total Envir., 210/211, 547 558.