HAL Id: hal-00298824
https://hal.archives-ouvertes.fr/hal-00298824
Submitted on 4 Apr 2007HAL is a multi-disciplinary open access
archive for the deposit and dissemination of sci-entific research documents, whether they are pub-lished or not. The documents may come from teaching and research institutions in France or abroad, or from public or private research centers.
L’archive ouverte pluridisciplinaire HAL, est destinée au dépôt et à la diffusion de documents scientifiques de niveau recherche, publiés ou non, émanant des établissements d’enseignement et de recherche français ou étrangers, des laboratoires publics ou privés.
Fluvial organic carbon flux from an eroding peatland
catchment, southern Pennines, UK
R. R. Pawson, J. J. Rothwell, S. Daniels, D. R. Lord, M. G. E. Evans, T. E.
H. Allott
To cite this version:
R. R. Pawson, J. J. Rothwell, S. Daniels, D. R. Lord, M. G. E. Evans, et al.. Fluvial organic carbon flux from an eroding peatland catchment, southern Pennines, UK. Hydrology and Earth System Sciences Discussions, European Geosciences Union, 2007, 4 (2), pp.719-745. �hal-00298824�
HESSD
4, 719–745, 2007
Fluvial organic carbon flux from an
eroding peatland R. R. Pawson et al. Title Page Abstract Introduction Conclusions References Tables Figures ◭ ◮ ◭ ◮ Back Close
Full Screen / Esc
Printer-friendly Version Interactive Discussion
EGU
Hydrol. Earth Syst. Sci. Discuss., 4, 719–745, 2007 www.hydrol-earth-syst-sci-discuss.net/4/719/2007/ © Author(s) 2007. This work is licensed
under a Creative Commons License.
Hydrology and Earth System Sciences Discussions
Papers published in Hydrology and Earth System Sciences Discussions are under open-access review for the journal Hydrology and Earth System Sciences
Fluvial organic carbon flux from an
eroding peatland catchment, southern
Pennines, UK
R. R. Pawson1, J. J. Rothwell2, S. Daniels1, D. R. Lord1, M. G. E. Evans1, and T. E. H. Allott1
1
Upland Environment Research Unit, Geography, School of Environment and Development, Mansfield Cooper Building, University of Manchester, Oxford Road, Manchester, M13 9PL, UK
2
Department of Environmental and Geographical Sciences, Manchester Metropolitan University, John Dalton Extension Building, Chester Street, Manchester, M1 5GD, UK Received: 15 January 2007 – Accepted: 21 January 2007 – Published: 4 April 2007 Correspondence to: R. R. Pawson ([email protected])
HESSD
4, 719–745, 2007
Fluvial organic carbon flux from an
eroding peatland R. R. Pawson et al. Title Page Abstract Introduction Conclusions References Tables Figures ◭ ◮ ◭ ◮ Back Close
Full Screen / Esc
Printer-friendly Version Interactive Discussion
EGU
Abstract
This study investigates for the first time the relative importance of dissolved organic carbon (DOC) and particulate organic carbon (POC) in the fluvial carbon flux from an actively eroding peatland catchment in the southern Pennines, UK. Event scale variability in DOC and POC was examined and the annual flux of fluvial organic carbon
5
was estimated for the catchment. At the event scale, both DOC and POC were found to increase with discharge, with event based POC export accounting for 95% of flux in only 8% of the time. On an annual cycle, 40.8 t organic carbon (OC) is exported from the catchment, which represents an areal value of 107 gC m−2a−1. POC was the most significant form of organic carbon export, accounting for ∼82% of the estimated flux.
10
This suggests that more research is required on both the fate of POC and the rates of POC export in eroding peatland catchments.
1 Introduction
There is a wide range of literature investigating the fluvial export of organic carbon from peatland environments (e.g. Dawson et al., 2002; Worrall et al., 2003 and Hope
15
et al., 1997a). Much of this research has been focussed upon estimating total fluvial losses of organic carbon in the form of DOC (dissolved organic carbon) and POC (particulate organic carbon), especially in light of current and potential climatic changes and the likely impacts of such changes on the soil carbon store. Understanding POC and DOC losses and their impact on upland carbon budgets is essential in light of
20
potential future climate changes and targets for carbon sequestration set by the Kyoto Protocol. In the UK the largest component of soil carbon storage is present in upland peat soils (Worrall et al., 2003; Wallage et al., 2006). Integrated studies of riverine export have shown an important link between terrestrial and oceanic carbon storage (Hope et al., 1997b and Kempe, 1979). In most studies that have evaluated the total
25
HESSD
4, 719–745, 2007
Fluvial organic carbon flux from an
eroding peatland R. R. Pawson et al. Title Page Abstract Introduction Conclusions References Tables Figures ◭ ◮ ◭ ◮ Back Close
Full Screen / Esc
Printer-friendly Version Interactive Discussion
EGU
significant form of carbon export. For example, Hope et al. (1997a) assessed two contrasting rivers in NE Scotland. Of these, DOC export accounted for greater than 75% of the total fluvial loss. Similarly, Tipping et al. (1997) investigated a range of catchments of the River Humber, and found DOC to account for between 51 and 80% of export. In contrasting catchments in Mid-Wales and NE Scotland, Dawson et al. (2002)
5
found DOC contributed 69 and 88% of fluvial export respectively. In a much broader assessment of fluxes, Hope et al. (1997b) concluded that for British rivers as a whole during 1993, 0.68 MtC of the fluvial carbon load was in dissolved form, representing 77% of fluvial loss.
A clear understanding of the dynamics of DOC and particularly POC flux in
erod-10
ing systems is essential for efforts to model current upland carbon cycles, to predict changes in peatland carbon sinks in the future, and to manage soil carbon in peatland environments. One significant gap in current knowledge is that almost all of the previ-ous work on POC/DOC proportions has been carried out in relatively intact peatlands. This is despite the fact that much of the UK upland peatland resources are significantly
15
eroded (Tallis et al., 1997). As yet, sediment flux has not been studied explicitly for the comparison of POC and DOC flux in heavily eroded peatland systems. The most im-pacted catchment for which data exists is at Moor House in the north Pennines (Worrall et al., 2003), a system which is extensively eroded but shows evidence of widespread re-vegetation (Evans and Warburton, 2005). Worrall et al. (2003) calculated an overall
20
carbon budget for this system and found POC to be the largest flux, accounting for ∼68% of fluvial carbon flux. Re-vegetation of eroded north Pennine peatlands has led to much reduced erosion rates compared to the severely degraded peatlands of the southern Pennines (Evans et al., 2006), described as the most eroded in Britain (Roth-well et al., 2005). These “badland” landscapes (Tallis, 1997) represent the extreme end
25
of a spectrum which runs to the relatively uneroded, DOC dominated systems studied by Hope et al. (1997a). The onset of peatland gully erosion in the southern Pennines correlates closely with climatic fluctuations in the Early Medieval Warm Period (Tallis, 1995, 1997). Predicted future climate changes, including warmer and drier summers,
HESSD
4, 719–745, 2007
Fluvial organic carbon flux from an
eroding peatland R. R. Pawson et al. Title Page Abstract Introduction Conclusions References Tables Figures ◭ ◮ ◭ ◮ Back Close
Full Screen / Esc
Printer-friendly Version Interactive Discussion
EGU
have the potential to exacerbate existing peat erosion and initiate further instability in these environments. Therefore, research into sediment and in particular POC fluxes are essential in these fragile upland systems.
This study aims to quantify and compare the relative roles of DOC and POC in the fluvial export of carbon from an actively eroding, peat dominated catchment in the
5
southern Pennines, based on intensive monitoring data and modelling annual cycles. Sediment removal in peatlands has been investigated in the past (e.g. Labadz et al., 1991), and the importance of stormflow in sediment yields highlighted in upland peat-land catchments (Evans et al., 2005). Due to the low density of peat sediments (Labadz et al., 1991), it is likely that carbon contents will vary with discharge as a function of
10
stream power. This is due to the channel entraining varied portions of minerogenic sediments under different discharge conditions. Such variability of sediment in terms of quantity and quality should be considered when modelling annual carbon fluxes. With this in mind, the first part of this paper investigates the nature of carbon export through an intensive field campaign during and between storm events. Using
empiri-15
cal observations from this high temporal resolution data, annual flux estimates of both POC and DOC are modelled to outline the significance of each form of carbon export in heavily eroding peatland systems.
2 Methodology
2.1 Study site
20
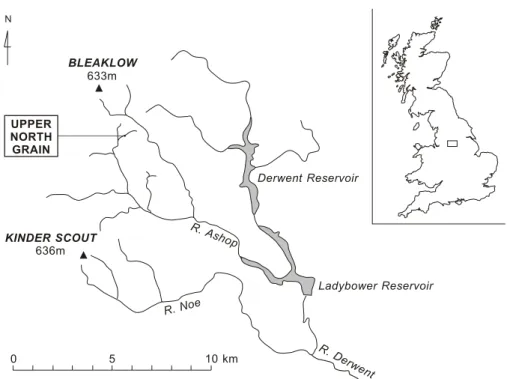
The field site used in this study is Upper North Grain (UNG), a small headwater catch-ment of the River Ashop (see Figs. 1 and 2). This is part of the National Trust High Peak Estate is situated in the Peak District, southern Pennines, UK. Located at alti-tudes between 490 and 541 m OD and receiving approximately 1200 mm rainfall each year, the catchment is dominated by blanket bog. The catchment is relatively small,
25
HESSD
4, 719–745, 2007
Fluvial organic carbon flux from an
eroding peatland R. R. Pawson et al. Title Page Abstract Introduction Conclusions References Tables Figures ◭ ◮ ◭ ◮ Back Close
Full Screen / Esc
Printer-friendly Version Interactive Discussion
EGU
(Rothwell et al., 2005). The catchment is heavily eroded with Bower Type I peat gullies (Bower, 1961), which in the upper reaches occur solely in a peat stratigraphy that often reach several metres in depth. The lower reaches of the gullies cut into the underlying bedrock, which is dominated by sandstones of the Millstone Grit Series (Wolverson-Cope, 1976). The sampling site for this study is located in these lower reaches of the
5
catchment where the river channel flows on bedrock surfaces rather than within the deep peat stratigraphy.
2.2 Field sampling: short-term temporal variability
To assess short-term temporal variability of organic carbon fluxes, a period of intense field monitoring was undertaken. Over a two week period, stream water samples were
10
extracted from Upper North Grain on an hourly basis using a Sigma 900 automatic water sampler. This monitoring took place in late March/early April 2005 during a period of storm events. Following each 24 h period, stream water samples were returned to the laboratory and processed using the methods outlined below. Laboratory work was undertaken within 72 h of extraction. The data set therefore consisted of over 300 direct
15
measurements of DOC, pH, conductivity and suspended sediments. During this period, stage was recorded using an Intelysis pressure transducer and Sentry II data logger. A stage-discharge relationship (see Daniels, 2006) was used to determine discharge over the study period.
2.3 Field sampling: annual flux calculation
20
Water samples were extracted using a range of methods throughout 2004–2005. Sam-pling periods were distributed throughout the year and occurred at a wide variety of dis-charges. Samples included routine spot samples on a weekly basis, low flow sampling and storm discharge samples, each of which is summarised in Table 1. All samples were returned to the laboratory, stored in a dark cold room at 4◦C, processed and
25
HESSD
4, 719–745, 2007
Fluvial organic carbon flux from an
eroding peatland R. R. Pawson et al. Title Page Abstract Introduction Conclusions References Tables Figures ◭ ◮ ◭ ◮ Back Close
Full Screen / Esc
Printer-friendly Version Interactive Discussion
EGU
Along with water samples, monitoring of stream chemistry (pH) and discharge was undertaken, providing a quasi-continuous field dataset. Monitoring encompassed the entire year (2004), facilitated again by Intelysis probes and data loggers.
A range of sediment samples from the catchment were characterised in terms of carbon content. This was undertaken to allow identification of in-catchment sources of
5
sediment carbon, which could be then be used to estimate organic carbon flux from the peatland carbon store. This source characterisation entailed analysis of a range of potential source sediments taken from a wide area in the catchment. Potential source sediments were generalised as sandstones and mudstones of the Millstone Grit Series, the periglacial head deposits of reworked sandstones and mudstones and the peat
10
itself. Five exposures of the main sediment types were selected with broad spatial coverage in the catchment, while peat samples were extracted from eroding gulley walls and through peat coring. The method for peat core collection is summarised by Rothwell et al. (2005). All catchment sediment samples were analysed using the methods described below.
15
2.4 Laboratory methods
Stream water samples were vacuum filtered through pre-weighed Whatman GF/C glass microfibre filter paper circles to separate the suspended sediment fraction over 1.2 µm. Water volume of the filtrate was also measured. The sediment retained on the filter paper was dried for 24 h at 105◦C to eliminate hygroscopic water and ensure
20
accurate sediment weight. The filter papers were then re-weighed to determine sus-pended sediment concentration (SSC) as a function of water volume. The separated water and sediments were then analysed as described below.
2.4.1 Sediment analysis
Sediment samples of over 50 mg were milled using a silicon carbide grinder in a 240 V
25
HESSD
4, 719–745, 2007
Fluvial organic carbon flux from an
eroding peatland R. R. Pawson et al. Title Page Abstract Introduction Conclusions References Tables Figures ◭ ◮ ◭ ◮ Back Close
Full Screen / Esc
Printer-friendly Version Interactive Discussion
EGU
repeated analysis of samples to determine the reproducibility of analytical techniques. Filter papers with less than 50 mg of sediment were left intact as the expected carbon content of this amount of sediment is within the range of measurement of laboratory instruments (R. Pawson, unpublished data). All samples were analysed for total car-bon and total inorganic carcar-bon using an SSM 5000A of the Shimadzu TOC-V Series
5
Analyser. POC content was determined by total carbon minus total inorganic carbon. This allowed the calculation of POC concentration and % POC of SSC.
2.4.2 Water analysis
After stream water samples had been filtered through the 1.2 µm filter paper, each water sample was then filtered again using 0.45 µm Whatman cellulose nitrate
mem-10
brane. Sub-samples of the filtrate were analysed for TOC (Total Organic Carbon) using the Shimadzu TOC-V Series Analyser. The 0.45 µm filtration size was used as this pore size is the common definition for DOC including colloidal carbon (Koelmans and Prevo, 2003) and has been routinely used in numerous studies for DOC determination (e.g. Scott et al., 1998; Chow et al., 2005 and Fujii et al., 1998). Stream water samples
15
were also analysed for pH and conductivity.
3 Results: temporal variability of organic carbon flux
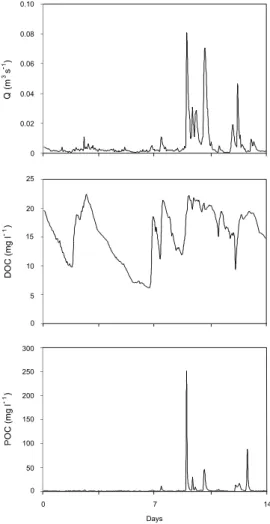
Figure 3 shows the results from the two week intensive study period. The discharge record shows relatively consistent, low values during the first nine days except for two main events where discharge rapidly increases over 0.01 m3s−1 and then returns to
20
low flow. This nine day spell is then followed by more variable discharges with greater ranges of flow. As in the first nine days of monitoring, flows in the later part of mon-itoring are flashy and after a rapid peak in discharge, baseflow conditions are soon resumed.
DOC concentrations in the sample period vary by ∼20 mg l−1. Higher peaks in
HESSD
4, 719–745, 2007
Fluvial organic carbon flux from an
eroding peatland R. R. Pawson et al. Title Page Abstract Introduction Conclusions References Tables Figures ◭ ◮ ◭ ◮ Back Close
Full Screen / Esc
Printer-friendly Version Interactive Discussion
EGU
centration of up to ∼25 mg l−1 coincide with discharge peaks. Following these peaks, DOC concentrations gradually decline to ∼5 mg l−1. This trend of rapid peaks and slow decreases of concentration is most pronounced in the first nine day period of relatively lower discharges. In the later period of more variable and increased discharge, DOC concentrations remain relatively higher, with lowest concentrations of ∼10 mg l−1.
5
POC concentrations over the monitoring period are much more variable, with the greater values concentrated in the period after nine days. The preceding period shows very little change in POC concentration, with low values of 1–2 mg l−1. In the later period, concentration peaks of up to ∼250 mg l−1are recorded. These POC peaks are more short-lived than those of discharge. For example, the samples one hour before
10
and one hour after the maximum peak of 250 mg l−1 have values of 4 and 50 mg l−1 respectively, while concentrations of 4 mg l−1are returned within 5 h of this peak.
DOC flux over the monitoring period was 128 kg; POC flux was 145 kg. Both fluxes were calculated using Eq. (1):
TotalLoad = KXn
i =1(Ci Qm) (1)
15
where; K is a conversion factor to take into account the period of study, Ci is the concentration for each sample point, Qm is the volumetric discharge for the time unit of each sample concentration and n is the number of samples. This equation is similar to that used by Walling and Webb (1981) except that volumetric discharge is used rather than mean discharge.
20
These figures give a total carbon flux for the two week monitoring period of 276 kg. Of this value, POC represents ∼54% of carbon flux. Cumulative flux data show that for DOC, 95% of total flux (or 121 kg) was exported over ∼62% of time. For POC the 95% flux value of 141 kg was exported in ∼8% of time during the study period – or in just over 1 day.
HESSD
4, 719–745, 2007
Fluvial organic carbon flux from an
eroding peatland R. R. Pawson et al. Title Page Abstract Introduction Conclusions References Tables Figures ◭ ◮ ◭ ◮ Back Close
Full Screen / Esc
Printer-friendly Version Interactive Discussion
EGU
4 Modelling annual carbon flux
4.1 DOC
Model inputs
DOC concentrations for the annual study were modelled using a pH-DOC relationship for stream water samples collected during the study period. The rationale for this model
5
is that pH in these upland catchments is significantly controlled by the inputs of humic and fulvic acids from the peat profile (Daniels, 2006). These humic acids are the main contributor to DOC concentrations in peat systems (Tipping, 2003; Chow et al., 2005), resulting in high DOC and low pH levels in peatland hydrology (Worrall et al., 2003). Using the pH-DOC relation for stream water samples and pH logged at 15 min intervals
10
for the study period, a quasi-continuous record of DOC concentrations was produced. Flux calculations were achieved using an equation similar to Method 3 from Walling and Webb (1985), where the amount of carbon exported for each time unit (e.g. 15 min interval) is calculated taking the measured concentration and mean discharge over each sample period with the assumption that this was consistent until the next sample.
15
The carbon exported for each sample period was then summed to give the total carbon flux for the entire study period.
For annual flux, it is necessary to correct the final figure of DOC export for the input of C to the catchment via rainfall. Analysis of rainfall has not been undertaken for this study, so values reported by Worrall et al. (2003) are used to estimate the peat sourced
20
DOC flux. Model outputs
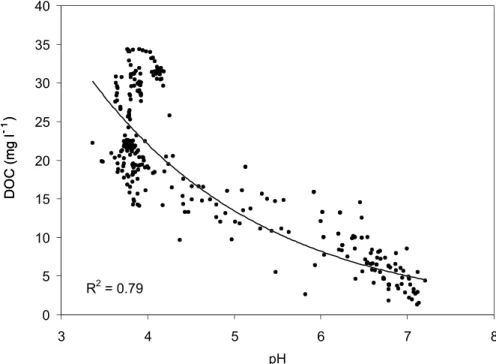
There is a strong relationship between stream water DOC concentrations and pH (r2=0.79, n=249, see Fig. 4). As DOC concentrations increase, pH values decrease.
HESSD
4, 719–745, 2007
Fluvial organic carbon flux from an
eroding peatland R. R. Pawson et al. Title Page Abstract Introduction Conclusions References Tables Figures ◭ ◮ ◭ ◮ Back Close
Full Screen / Esc
Printer-friendly Version Interactive Discussion
EGU
DOC can therefore be calculated given the equation below:
DOC = 102.61e(pH+0.3994) (2)
Using the empirical relationship between DOC and pH, modelled DOC flux from UNG is 21.7 gC m−2a−1, equivalent to 9.10 t C a−1. The standard error of the regression line was used to calculate the error for the annual dissolved DOC flux after
his-5
togram analysis of the data. DOC flux by modelling yields an annual DOC flux of 22.9±6.70 gC m−2a−1. This estimate of DOC flux is a total flux (i.e. peat sourced and atmospherically sourced DOC). Using data presented by Worrall et al. (2003), peat sourced DOC flux at UNG is 19.9± 5.77 gC m−2a−1 or an absolute flux of 7.55 t C us-ing Eq. (1).
10
4.2 POC Model inputs
POC flux was modelled for the annual period using a sediment rating curve approach and the analysis of POC concentrations in the suite of sediment samples collected from the catchment. Two rating curves relating to flows above and below 0.10 m3s−1
15
and ≥0.10 m3s−1were derived from 254 storm water samples representing 13 storm events between March 2003 and December 2004. Previous work in peatland streams has demonstrated that there is usually positive hysteresis in the suspended sediment-discharge rating relation (c.f. Evans et al., 2006). Therefore, a 45 min lag was used in the construction of the rating curves, i.e. SSC was related to Qt+45. Back transformation
20
errors for the sediment yield was corrected using the smearing estimator, since this technique is the most appropriate correction for sediment rating curves in peatland streams (Armstrong et al., 2006) The total sediment yield for UNG is 257.19 g cm2a1 (or 97.73 t).
To calculate POC proportions, a range of catchment sediment samples were
anal-25
HESSD
4, 719–745, 2007
Fluvial organic carbon flux from an
eroding peatland R. R. Pawson et al. Title Page Abstract Introduction Conclusions References Tables Figures ◭ ◮ ◭ ◮ Back Close
Full Screen / Esc
Printer-friendly Version Interactive Discussion
EGU
a range of baseflow conditions, storm samples and rising stage samples. The need for a broad range of suspended sediment samples is due to the control of discharge on sediment quality, forced by the effect of discharge on sediment dynamics. In total 47 suspended sediment samples from a range of flow conditions were analysed for POC. Potential sediment source samples were also analysed (n=28) for carbon contents to
5
allow correction of the suspended sediment POC data for peat sourced carbon. Using this data for POC and SSC at a range of discharges, a calibration was developed for the quality of sediment for a given discharge, with lower % POC at higher discharges. This calibration could allow for the variability of POC content with hydrological condi-tions and was applied to the modelled annual suspended sediment flux data for the
10
entire annual period, thus providing a modelled POC flux.
For the two week intensive study, SSC concentrations were obtained for every hourly sample. This data could then be calibrated to POC using the SSC/POC relationship obtained for the annual flux. These concentrations were then converted to total export of POC using Eq. (1), yielding POC export for the two week intensive monitoring period.
15
Model outputs
The mean POC proportion for sediment loads was calculated as 47.2±4.10% (n=47, 95% confidence). This is similar to POC proportions reported by Worrall et al. (2003) after Francis (1987), where the majority of upland suspended sediments are organic-rich, and that carbon makes up ∼50% of this load. This ∼50% load is confirmed by
20
measurement of OC contents of a range of peat samples at UNG, in which carbon contents where 50.1±1.70% (95% confidence). Characterisation of other sediment sources measured very low total carbon (TC) concentrations similar to the conclusions made by Spears and Amin (1981). Total carbon contents of 2.30±1.50% for shale, 0.17±0.07% for sandstone and 1.09 ± 0.73% for head deposits were recorded in this
25
study. Of the source sediments, organic carbon measurement was below the range of measurement of the analytical methods employed, suggesting that there was no need to correct carbon contents of suspended sediment samples for non-peat sourced
HESSD
4, 719–745, 2007
Fluvial organic carbon flux from an
eroding peatland R. R. Pawson et al. Title Page Abstract Introduction Conclusions References Tables Figures ◭ ◮ ◭ ◮ Back Close
Full Screen / Esc
Printer-friendly Version Interactive Discussion
EGU
organic carbon.
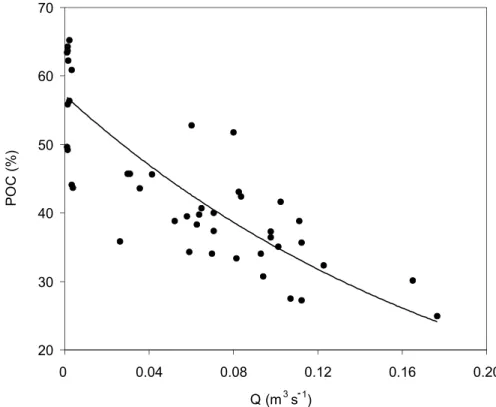
The short-term temporal variability data revealed that POC content varied signif-icantly with discharge in terms of % POC of SSC and absolute carbon flux. Dis-charge and % POC in suspended sediments correlated in a non-linear continuous trend (r2=0.68, n=47) (see Fig. 5). The curve of this trend was used to derive a modelled
5
annual POC flux for UNG using the sediment-rating curve data. This model produced a total POC flux of 33.24 t C, equivalent to 87.5 gC m−2a−1.
Based on the modelled DOC and POC flux data the total annual flux for peat sourced carbon from UNG is 107 gC m−2a−1. This amounts to an actual flux of 40.8 t C, of which POC accounts for ∼82%.
10
5 Discussion
5.1 Fluxes of organic carbon
The flux of both DOC and POC can be considered on both the short and annual scale. Estimation of carbon flux over the two week intensive monitoring period resulted in a total loss of ∼276 kg. Of this, POC accounted for ∼148 kg, equivalent to ∼54%. This
15
highlights the relative importance of POC in fluvial export, especially when considering the very low POC loads in the first nine days of the monitoring campaign.
The annual data provides a more striking insight of the relative roles of fluvial carbon export in eroding peatland catchments. The peat sourced carbon flux is 40.8 t C a−1. This value has been derived using an empirical relationship between DOC and pH
20
and the discharge-sediment quality measurements. Therefore, for the total carbon ex-port value, POC accounts for ∼82% of fluvial exex-port in the catchment. This clearly highlights the significance of POC in upland eroding peatland systems such as UNG, especially when this value is compared to those previously reported in the litera-ture. Normalising the flux to unit area allows comparison with previous work. In
25
HESSD
4, 719–745, 2007
Fluvial organic carbon flux from an
eroding peatland R. R. Pawson et al. Title Page Abstract Introduction Conclusions References Tables Figures ◭ ◮ ◭ ◮ Back Close
Full Screen / Esc
Printer-friendly Version Interactive Discussion
EGU
et al., 2003). Other relatively high estimates of annual POC fluxes reported by the authors include; 34 gC m−2a−1(Francis, 1987), 38.82 gC m−2a−1(Labadz et al., 1991) and 31.3 gC m−2a−1(Hutchinson, 1995). In comparison, the estimate of POC flux from UNG is 87.5 gC m−2a−1. The implication is that in severely eroding catchments rates of POC export may be much higher than has previously been recognised.
5
The DOC-pH relationship used to model DOC flux (Fig. 4) exhibits an r2 value of 0.79. The scatter in the data can be explained by the variability of DOC concentrations with lower pH values during storm events. This scatter relates to the effects of strong mineral acid release from the peat during storm flow and the impact that this has on pH levels (Nov ´ak et al., 2005; Daniels, 2006). However, the regression model performs
10
well in estimating DOC concentrations, with an error of 29%. Total DOC flux from the UNG catchment is higher than values previously cited in the literature. A corrected total flux of DOC is 19.9±5.77 gC m−2a−1. Reported values from other headwater peatlands include; 15 gC m−2a−1 (Scott et al., 1998), 115.0 kg ha−1a−1 (11.5 gC m−2a−1, Hope et al., 1997a) and 9.4 gC m−2a−1(Worrall et al., 2003). The likely explanation for these
15
high values is the eroded nature of the catchment. Extensive gully networks are likely to cause a depressed water table over a wider area of the catchment by increasing drainage (Tallis, 1973; Wallage et al., 2006). This expands the aerobic zone and thus raises DOC production (Worrall and Burt, 2005) and consequently leads to a higher an-nual flux of DOC per unit area. This suggests that the importance of enhanced carbon
20
flux from eroding catchments in upland carbon cycles may extend beyond particulate export as DOC fluxes may also be significantly higher under such conditions.
Although the significance of POC in the carbon flux from eroding peat catchments is clear, the question of how this source interacts with atmospheric carbon cycles is less well understood. Evans et al. (2006) estimate oxidation from peat surfaces as residual
25
wastage and predict that 30–40% of bare peat loss can be attributed to oxidation. Similarly Jacinteh et al. (2002) show that 29–46% of soil organic carbon eroded from fields in Ohio is mineralised within 100 days. Current research has shown that in controlled experimental conditions up to 25% of mass can be lost from peat samples on
HESSD
4, 719–745, 2007
Fluvial organic carbon flux from an
eroding peatland R. R. Pawson et al. Title Page Abstract Introduction Conclusions References Tables Figures ◭ ◮ ◭ ◮ Back Close
Full Screen / Esc
Printer-friendly Version Interactive Discussion
EGU
an annual cycle and that this figure can reach 40% on a monthly scale (Pawson et al., 2006). If these figures are accurate and we consider the levels of POC flux presented in this paper, it appears that there is indeed a significant degree of atmospherically active carbon flux from eroding catchments. Work assessing such fates of POC is ongoing. 5.2 Temporal variability of carbon flux: implications for sampling
5
The results from the intensive two week period clearly demonstrate the episodic nature of POC export. For the majority of the period, POC concentrations are considerably lower than during the main period of export (Fig. 3). Such rapid, episodic, discharge related flux of POC is expected. Previous work investigating sediment dynamics in peatland systems (e.g. Labadz et al., 1991; Holden and Burt, 2002) has revealed
posi-10
tive hysteresis in discharge-sediment relations, attributed to sediment supply from peat surfaces (Evans et al., 2005). It therefore follows that POC concentrations, strongly affected by erosional inputs in these degrading systems, will exhibit similar characteris-tics. POC as a proportion of total sediment flux also varied with discharge (Fig. 5). This variability shows a trend of decreasing % POC as discharges and SSC increases.
Sim-15
ilar sediment quality-discharge relationships have been attributed to increased mineral entrainment (Bradley and Lewin, 1982; Dawson and Macklin, 1998; Rothwell et al., 2007). At lower discharges low density peat sediments make up a higher proportion of sediment loads and thus higher POC concentrations are recorded. Even though % POC is higher in these lower discharge periods, actual POC concentrations are still
sig-20
nificantly lower than during higher discharge events, (e.g. ∼250 mg l−l peak, compared to 1–2 mg l−l at low flow). The idea of variable organic component is supported by loss on ignition measurements of suspended sediments at a range of discharges (R. Paw-son, unpulished data). These results suggest that POC flux analysis requires carefully constructed sampling regimes at a variety of discharge conditions. As sediment supply
25
is usually the controlling factor for sediment flux (Evans et al., 2005), then it is also essential that POC flux work investigates a wide spectra of antecedent, prevailing con-ditions. For example, high discharge conditions may not necessarily result in greater
HESSD
4, 719–745, 2007
Fluvial organic carbon flux from an
eroding peatland R. R. Pawson et al. Title Page Abstract Introduction Conclusions References Tables Figures ◭ ◮ ◭ ◮ Back Close
Full Screen / Esc
Printer-friendly Version Interactive Discussion
EGU
POC flux if antecedent conditions are not suitable for sediment preparation. The need for careful field sampling is reinforced in the present study. Firstly, POC concentrations decrease rapidly following peaks, returning to a “pre-peak” value within a few hours. The majority of POC flux (95%) therefore occurs in a small amount of time. As such, infrequent periodic sampling will miss peaks of POC export. Conversely, if sampling
5
occurs during a peak then POC export could be significantly over estimated as peak concentrations are extrapolated beyond their true timescale. Furthermore, the POC-discharge relationship shows considerable hysteresis. The largest peak of POC over the period (Fig. 3) follows the first significant discharge peak (Q=0.09) after nine days of low flow. Following this, discharge is much more variable. A similar peak (Q=0.07)
10
occurs 27 h after the first peak. However, this second event results in a much lower peak POC concentration. The reduction most likely represents a sediment exhaus-tion effect due to the limited pre-storm period for sediment preparaexhaus-tion by weathering. In general the storm POC concentrations are significantly higher than those reported elsewhere (e.g. Dawson et al., 2002). Observation of sediment supply related
hys-15
teresis in the POC-discharge relation suggests that suitable antecedent conditions are likely to be required to create high peaks in POC export, and that monitoring regimes need to consider these ideas carefully.
DOC concentrations also showed variability over the study period, but with a much lower range of values. Whereas POC ranged from 0–250 mg l−l, DOC has a range of
20
6.20–22.4 mg l−l. These concentrations appear lower then reported values mentioned above, but it is likely that this characteristic is seasonal, as it has been shown that DOC concentrations are at their lowest in winter and spring months in peatland envi-ronments (Scott et al., 1998). DOC and discharge also appear to peak concurrently, but the level of discharge increase appears to have less effect on the concentration
25
than with POC. For example, three days a small peak in discharge (Q=0.01) causes a rapid rise in DOC from ∼10–22 mg l−l, while a similar peak of DOC also occurs at the largest discharge peak (Q=0.09). As such, it appears that the level of discharge increases do not control the increase in DOC concentration (i.e. similar peaks in DOC
HESSD
4, 719–745, 2007
Fluvial organic carbon flux from an
eroding peatland R. R. Pawson et al. Title Page Abstract Introduction Conclusions References Tables Figures ◭ ◮ ◭ ◮ Back Close
Full Screen / Esc
Printer-friendly Version Interactive Discussion
EGU
are forced by very different storm events). This is evidenced by the poor relationship between DOC and discharge. The Q-DOC relationship exhibits a low r2 value (0.15), caused by the scatter of the DOC concentrations with variable discharges. This is due to similar peaks of DOC occurring concurrently with a range of discharge peaks, as noted. In comparison, POC correlates much more strongly (r2=0.45) with these higher
5
discharges in spite of the likely presence of hysteresis loops.
Following DOC peaks, concentrations decline slowly unless discharge remains high and variable. In these conditions, DOC varies less and remains at higher concentra-tions. Similar observations of falling DOC concentrations following discharge peaks have also been noted by Worrall et al. (2002) who describe DOC flux as a function of a
10
three end-member system, with inter-event water dominated by low DOC while storm flow is dominated by a mixture of DOC rich and poor waters, sourced from old water within the peat profile and rainwater respectively. The author’s refer to the rapid rises in DOC as event water (rainfall, runoff and through flow) exporting an existing supply of DOC rich water. The authors hypothesise that the time between events and the
an-15
tecedent conditions will control this supply of dissolved carbon. In contrast to our study, Worrall et al. (2002) sample a period in autumn which is referred to as the re-wetting period of the peatland after the summer. As such, they propose that this flushing of DOC during storm events may be restricted to that time of year as the water table rises through the acrotelm where the DOC is sourced. However, it appears that this study
20
supports the idea of a flushing of an existing carbon supply also during a spring period and that level of increased discharge is not a direct control of the DOC concentration of this flush water.
Due to the rapid increase in DOC concentration, the temporal variability of DOC does appear to vary with discharge on an event scale basis. The slow decline of DOC
25
after such an event and the much smaller overall range of concentrations does mean, however, that the sampling implications of temporal variability in DOC flux are less significant than those identified for POC data. This is highlighted by the results of the flux analysis. As highlighted above, 95% of POC export occurs in just 8% or 27 h of the
HESSD
4, 719–745, 2007
Fluvial organic carbon flux from an
eroding peatland R. R. Pawson et al. Title Page Abstract Introduction Conclusions References Tables Figures ◭ ◮ ◭ ◮ Back Close
Full Screen / Esc
Printer-friendly Version Interactive Discussion
EGU
study period. In comparison, 95% of DOC export occurs over much longer periods of ∼62% – or over 208 h (>8 days).
6 Conclusions
– In contrast to most previous work on carbon export from peatland catchments,
this study has revealed that POC is the dominant component of fluvial organic
5
carbon flux from the Upper North Grain catchment. UNG lies at one end of a spectrum from eroding peatlands through eroded and re-vegetated systems to the intact peatlands where most previous work on the balance of POC and DOC in runoff has been conducted. The results of this study emphasise the importance of adequately considering the POC flux as a component of the carbon budget in
10
systems where erosion is significant.
– The temporal variability of POC flux demonstrated here means that it is not only
important to consider POC flux as a significant part of the carbon budget but that in catchments where it is important higher resolution sampling than the standard weekly measurement are required to adequately characterise the flux.
15
– Potential increases in DOC flux associated with climate warming are well
docu-mented but the historic association of erosion with periods of climate change also suggests a risk of increasing POC flux.
– Given the significance of POC flux from eroding systems further research is
ur-gently required to consider the fate of particulate carbon in the fluvial system and
20
the proportion which might be expected to become climatically active.
Acknowledgements. We thank the University of Manchester, School of Environment and
De-velopment for the provision of a Graduate Teaching Fellowship (to R. R. Pawson) and Moors for the Future Partnership for the provision of a Small Project Grant for fieldwork and analytical expenses. The authors would also like to thank the National Trust for allowing fieldwork to be
25
HESSD
4, 719–745, 2007
Fluvial organic carbon flux from an
eroding peatland R. R. Pawson et al. Title Page Abstract Introduction Conclusions References Tables Figures ◭ ◮ ◭ ◮ Back Close
Full Screen / Esc
Printer-friendly Version Interactive Discussion
EGU
References
Armstrong, A., Cox, N. J., Warburton, J., Evans, M., and Holliday, V. J.: The effect of rating curve model fit on suspended sediment load estimates and the assessment of model fit, Geophys. Res. Abstracts, 8, European Geosciences Union, 2006.
Armstrong, A.: Monitoring and modelling suspended sediment flux in British upland
catch-5
ments, Unpublished PhD. Thesis, University of Leeds, 2005.
Bower, M. M.: The distribution of erosion in blanket peat bogs in the Pennines, Transactions and Papers (Institute of British Geographers), 29 17–30, 1961.
Bradley, S. B and Lewin, J.:L Transport of Heavy Metals on Suspended Sediments Under High Flow Conditions in a Mineralized Region of Wales, Environmental Pollution, 4, 257–267,
10
1982.
Bragg, O. M. and Tallis, J. H.: The sensitivity of peat-covered upland landscapes, Catena, 42 345–360, 2001.
Chow, A. T., Guo F., Gao S, Breuer R., and Dahlgren R. A.: Filter pore size selection for characterizing dissolved organic carbon and trihalomethane precursors from soils, Water
15
Res., 39, 1255–1264, 2005.
Daniels, S.: Controls on Streamwater Acidity in South Pennine Headwater Catchments, Un-published PhD. Theses , University of Manchester, 2006.
Dawson, J. J. C., Billet, M. F., Neil, C., and Hill, S.: A Comparison of particulate, dissolved and gaseous carbon in two contrasting upland streams in the UK, J. Hydrol., 257 226–246,
20
2002.
Dawson, E. J. and Macklin, M. G.: Speciation of Heavy Metals in Floodplain and Flood Sedi-ments: a Reconnaissance Survey of the Aire Valley, West Yorkshire, Great Britain, Environ. Geochem. Health, 20, 67–76, 1988.
Duan, N.: Smearing estimate – a nonparametric retransformation method: J. Am. Stat. Assoc.,
25
78, 605–610, 1983.
Evans, C. D., Jenkins, A., and Wright, R. F.: Surface water acidification in the South Pennines I. Current status and spatial variability, Environ. Pollut., 109, 11–20, 1999.
Evans, M. and Warburton, J.: Sediment budget for an eroding peat moorland catchment in northern England, Earth Surface Processes and Landforms, 30, 557–577, 2005.
30
Evans, M., Warburton, J., and Yang, J.: Eroding blanket peat catchments: Global and local implications of upland organic sediment budgets, Geomorphology, 79, 45–57, 2006.
HESSD
4, 719–745, 2007
Fluvial organic carbon flux from an
eroding peatland R. R. Pawson et al. Title Page Abstract Introduction Conclusions References Tables Figures ◭ ◮ ◭ ◮ Back Close
Full Screen / Esc
Printer-friendly Version Interactive Discussion
EGU Freeman C., Evans, C. D. Monteith, D. T., Reynolds, B., and Fenner, N.: Export of organic
carbon from peat soils. Nature, 412, 785, 2001.
Fujii, R., Ranalli, A. J., Aiken, G. R., and Bergamaschi, B. A.: Dissolved Organic Carbon Concentrations and Compositions, and Trihalomethane Formation Potentials in Waters from Agricultural Peat Soils, Sacramento-San Joaquin Delta, California: Implications for
Drinking-5
Water Quality, U.S. Geological Survey Water-Resources Investigations Report 98 – 4147, 1998
Holden, J. and Burt, T. P.: Infiltration, runoff and sediment production in blanket peat catch-ments: implications of field rainfall simulation experiments, J. Hydrol., 16, 2537–2557, 2002. Hope, D., Billet, M. F., and Cresser, M. S.: Exports of organic carbon from two river systems in
10
NE Scotland, J. Hydrol., 193 61–82, 1997a.
Hope, D., Billett, M. F., Milne, R., and Brown, T. A. W.: Exports of organic carbon in British rivers, Hydrol. Processes, 11, 325–344, 1997b.
Hutchinson S. M.: Use of magnetic and radiometric measurements to investigate erosion and sedimentation in a British upland catchment, Earth Surface Processes and Landforms, 20,
15
293–314, 1995.
Kempe, S.: Carbon in the fresh water cycle, In, The global carbon cycle, edited by: Degens, E. T., Kempe, S., and Ketner P., SCOPE 13, John Wiley and Sons, 317–342, 1979
Koelmans, A. A. and Prevo, L.: Production of dissolved organic carbon in aquatic sediment suspensions, Water Res., 37, 2217, 2003.
20
Labadz, J. C., Burt, T. P., and Potter, A. W. R.: Sediment yield and delivery in the blanket peat moorlands of the Southern Pennines, Earth Surf Process Landforms, 16, 255–271, 1991. Lindsay, R. A., Charman, D. J., Everingham, F., O’Reilly, R. M., Palmer, M. A., Rowell, T. A., and
Stroud, D. A.: The Flow Country: The peatlands of Caithness and Sutherland. Peterborough, Nature Conservancy Council, 1988.
25
Littlewood, I. G.: Estimating constituent loads in rivers: a review, Institute of Hydrology, Walling-ford, UK, 81, 1992.
Nov ´ak, M., Adamov ´a, M., Kelman Wieder, R., and Bottrell, S. H.: Sulfur mobility in peat, Appl. Geochem., 20 673–681, 2005.
Pawson, R. R, Evans, M. G., and Allott, T. E.: The role of Particulate Organic Carbon (POC) in
30
the carbon cycle of degrading upland peat systems, Geophysical Research Abstracts, Vol. 8, European Geosciences Union, 2006.
south-HESSD
4, 719–745, 2007
Fluvial organic carbon flux from an
eroding peatland R. R. Pawson et al. Title Page Abstract Introduction Conclusions References Tables Figures ◭ ◮ ◭ ◮ Back Close
Full Screen / Esc
Printer-friendly Version Interactive Discussion
EGU ern Pennines, UK, Unpublished PhD Thesis, University of Manchester, 2006.
Rothwell, J. J., Robinson, S. G., Evans, M. G., Yang, J., and Allott T. E. H.: Heavy metal release by peat erosion in the Peak District, Southern Pennines, UK, Hydrol. Processes, 19, 2973–2989, 2005.
Rothwell, J. J., Evans, M. G., and Allott, T. E. H.: Lead contamination of fluvial sediments in an
5
eroding blanket peat catchment, Appl. Geochem., 22, 466–459, 2007.
Scott, M. J.: Temporal Patterns in the chemistry, flux and molecular characteristics of dissolved organic carbon in drainage water from upland peat systems, Unpublished PhD. Theses, University of Manchester, 1998.
Spears D. A. and Amin, M.A.: A mineralogical and geochemical study of turbidite sandstones
10
and interbedded shales, Mam Tor, Derbyshire, UK, Clay Minerals, 16, 333–345, 1981. Tallis, J. H.: Blanket mire in the upland landscape. In Restoration of temperate wetlands, edited
by: Wheeler, B. D., Shaw, S. C., Fojt, W. J., and Robertson, R. A., John Wiley, Chichester, 495–508, 1995.
Tallis, J. H., Meade, R., and Hulme, P. D. (Eds): Blanket Mire Degradation: Causes,
Conse-15
quences and Challenges, Proceedings. of the Mires Research Group Meeting at the Univer-sity of Manchester 9–11 April 1997.
Tallis, J. H.: The southern Pennine experience: an overview of blanket mire degradation, in: Blanket Mire Degradation: Causes, Consequences and Challenges, edited by: Tallis, J. H., Meade, R., and Hulme, P. D., Proceedings of the Mires Research Group Meeting at the
20
University of Manchester 9–11 April 1997.
Tipping, E., Marker, A. F. H., Butterwick, C., Collett, G. D., Cranwell, P. A., Ingram, J. K. G., Leach, D. V., Lishman, J. P., Pinder, A. C., Rigg, E., and Simon, B. M.: Organic carbon in the Humber rivers, Sci. Total Environ., 194/195, 345–355, 1997.
Tipping, E., Smith, E. J. Lawlor, A. J., Hughes, S., and Stevens, P. A.: Predicting the release
25
of metals from ombrotrophic peat due to drought-induced acidification, Environ. Pollut. 123, 239, 2003.
Wallage, Z., Holden, J., and McDonald, A. T.: Drain blocking: An effective treatment for reduc-ing dissolved organic carbon loss and water discolouration in a drained peatland, Sci. Total Environ., 367 811–821, 2006.
30
Walling, D. E. and Webb B. W.: Estimating the discharge of contaminants to coastal waters by rivers: Some cautionary comments, Mar. Pollut. Bull., 16, 488–492, 1985.
HESSD
4, 719–745, 2007
Fluvial organic carbon flux from an
eroding peatland R. R. Pawson et al. Title Page Abstract Introduction Conclusions References Tables Figures ◭ ◮ ◭ ◮ Back Close
Full Screen / Esc
Printer-friendly Version Interactive Discussion
EGU Worrall, F., Burt, T. P., Jaeban, R. Y., Warburton, J., and Shedden, R.: Release of dissolved
organic carbon from upland peat, Hydrol. Processes 16, 3487–3504, 2002.
Worrall, F., Reed, M., Warburton, J., and Burt, T. P.: Carbon budget for a British upland peat catchment., Sci. Total Environ., 312, 133–146, 2003.
Worrall, F. and Burt, T.: Predicting the future DOC flux from upland peat catchments, J. Hydrol.,
5
HESSD
4, 719–745, 2007
Fluvial organic carbon flux from an
eroding peatland R. R. Pawson et al. Title Page Abstract Introduction Conclusions References Tables Figures ◭ ◮ ◭ ◮ Back Close
Full Screen / Esc
Printer-friendly Version Interactive Discussion
EGU
Table 1. A record of the samples used for the pH DOC calibration in this study.
Sample type Dates Number of samples Description Routine spot samples of
main UNG monitoring point
November 2005– January 2006
20 samples Weekly to bi-weekly routine sampling
High discharge sampling of main UNG monitoring point
November 2005– January 2006
9 samples Grab samples collected at points of storm discharge Intensive Monitoring
pe-riod (AWS)
28/03/2005– 11/04/2005
Twice daily spot sam-pling (28)
Hourly sampling using au-tomated water samplers (AWS)
Storm Sampling (AWS) February 2004– February 2006
24 samples for 6 events, 48 for 1 events
High discharge, flow trig-gered sampling using AWS Total Samples 249
HESSD
4, 719–745, 2007
Fluvial organic carbon flux from an
eroding peatland R. R. Pawson et al. Title Page Abstract Introduction Conclusions References Tables Figures ◭ ◮ ◭ ◮ Back Close
Full Screen / Esc
Printer-friendly Version Interactive Discussion EGU Derwent Reservoir Ladybower Reservoir R. N eo R. Ashop R. Der w nt e 633m BLEAKLOW BLEAKLOW 636m KINDER SCOUT 0 5 10 km N UPPER NORTH GRAIN
HESSD
4, 719–745, 2007
Fluvial organic carbon flux from an
eroding peatland R. R. Pawson et al. Title Page Abstract Introduction Conclusions References Tables Figures ◭ ◮ ◭ ◮ Back Close
Full Screen / Esc
Printer-friendly Version Interactive Discussion EGU 0 100 200m N N
Fig. 2. Arial photograph of UNG catchment displaying the blue, green and near infrared bands.
HESSD
4, 719–745, 2007
Fluvial organic carbon flux from an
eroding peatland R. R. Pawson et al. Title Page Abstract Introduction Conclusions References Tables Figures ◭ ◮ ◭ ◮ Back Close
Full Screen / Esc
Printer-friendly Version Interactive Discussion EGU 0 0.02 0.04 0.06 0.08 0.10 0 5 10 15 20 25 0 50 100 150 200 250 300 0 7 14 Days D O C (m g l -1) O C (m g l -1) P Q (m 3s -1)
Fig. 3. Discharge, DOC and POC concentration data for the two week intensive study period.
HESSD
4, 719–745, 2007
Fluvial organic carbon flux from an
eroding peatland R. R. Pawson et al. Title Page Abstract Introduction Conclusions References Tables Figures ◭ ◮ ◭ ◮ Back Close
Full Screen / Esc
Printer-friendly Version Interactive Discussion EGU R2 = 0.79 0 5 10 15 20 25 30 35 40 3 4 5 6 7 8 pH D O C (m g l -1 ) D O C (m g l -1 )
Fig. 4. Graph showing relationship of DOC and pH for all samples (n=249). Residuals are
HESSD
4, 719–745, 2007
Fluvial organic carbon flux from an
eroding peatland R. R. Pawson et al. Title Page Abstract Introduction Conclusions References Tables Figures ◭ ◮ ◭ ◮ Back Close
Full Screen / Esc
Printer-friendly Version Interactive Discussion EGU 20 30 40 50 60 70 0 0.04 0.08 0.12 0.16 0.20 P O C (% ) Q (m3s-1)
Fig. 5. Graph showing relationship between POC concentrations (%) in suspended sediments
against discharge in study catchment (r2=.68). The curve is added to show the trend of de-creasing POC contents with inde-creasing discharge. This is used for the calibration of SSC for POC concentrations. (n=47).