HAL Id: hal-03020457
https://hal.archives-ouvertes.fr/hal-03020457
Preprint submitted on 23 Nov 2020
HAL is a multi-disciplinary open access
archive for the deposit and dissemination of
sci-entific research documents, whether they are
pub-lished or not. The documents may come from
teaching and research institutions in France or
abroad, or from public or private research centers.
L’archive ouverte pluridisciplinaire HAL, est
destinée au dépôt et à la diffusion de documents
scientifiques de niveau recherche, publiés ou non,
émanant des établissements d’enseignement et de
recherche français ou étrangers, des laboratoires
publics ou privés.
Wavefront dislocations reveal insulator topology
C. Dutreix, Matthieu Bellec, P. Delplace, F. Mortessagne
To cite this version:
C. Dutreix, Matthieu Bellec, P. Delplace, F. Mortessagne. Wavefront dislocations reveal insulator
topology. 2020. �hal-03020457�
Cl´ement Dutreix,1,∗ Matthieu Bellec,2 Pierre Delplace,3 and Fabrice Mortessagne2
1Universit´e de Bordeaux, France and CNRS, LOMA, UMR 5798, F-33400 Talence, France
2Universit´e Cˆote d’Azur, CNRS, Institut de Physique de Nice, 06100 Nice, France
3Univ Lyon, Ens de Lyon, Univ Claude Bernard, CNRS, Laboratoire de Physique, F-69342 Lyon, France
Wavefront dislocations are a fundamental and ubiqui-tous wave phenomenon that originates from an indetermi-nation of the phase of a wavefield, where the amplitude of the wave vanishes. Since the seminal work of John Nye and Michael Berry in 1974 [1], it was realised that such topological defects could emerge in any wavefield ir-respectively of its physical nature or its dispersion rela-tion. Wavefront dislocations have been observed from the physics of fluids, sound, electromagnetism to oceanic tides and astronomy, and even led to the birth of a whole re-search field known as singular optics [2–7]. In quantum mechanics, wavefront dislocations have been predicted in connection to the Aharonov-Bohm effect [8,9], and they have been observed recently in the electron density of graphene as a manifestation of the wave-function Berry phase [10,11]. In parallel, topology also spread in con-densed matter physics, giving rise to the field of topo-logical phases of matter [12,13] and its various classical analogs such as topological photonics [14]. In this con-text, topological properties are defined from singularities of the wave functions delocalised in the bulk of the mate-rial. Still, apart from the pioneering example of the quan-tised electric conductivity in the quantum Hall phase, their experimental manifestations are mainly indirect, through the existence of gapless excitations localised at the bound-aries of the system. Despite this common underlying key role of phase singularities, topological phases and singular waves have remained two distinct fields [15]. Here we rec-oncile them by showing a wavefront dislocation as a direct evidence of the phase singularity of the delocalised wave functions and observe it through standing-wave interfer-ence in a 1D microwave photonic insulator. By bridging the bulk topology of insulators to a ubiquitous wave phe-nomenon, we open a promising route to investigate quan-tum and classical topological systems through real-space interference patterns.
Topological insulating systems are associated with integer-valued numbers (topological indices) that characterise the phase singularities of the bulk wave functions. A change of the topological index requires the spectral gap to close. Such a topological transition is also associated with a phase singularity of the eigenmodes. By including the parameter that controls the spectral gap, a topological transition of a D dimensional system is then described by a singular point in a D+ 1 dimensional parameter space. The 1D case is particularly interesting as it allows us to describe topological transitions with vortices appearing in 2D parameter space. Vortices in real space are known to induce wavefront
dislo-cations onto an incident propagating wave [8]. Similarly, we reveal here that the vortex of the topological transition in-volves a quite analog phenomenon in parameter space. When a defect or an edge is included to a topological insulator, a defect-induced interference pattern of bulk wave functions emerges and abruptly changes at the singular band crossing point, then giving rise to a wavefront dislocation in the D+1 parameter space. We find that this wavefront dislocation is accessible experimentally through the local density of states (LDOS) and demonstrate its existence in a 1D microwave
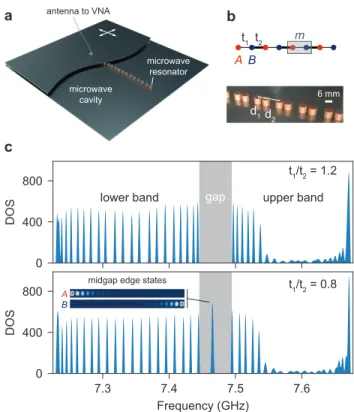
a b c t1/t2 = 1.2 t1/t2 = 0.8 antenna to VNA microwave cavity microwave resonator t1 t2 B A m 6 mm d1d2
lower band gap upper band
A
midgap edge states
B
FIG. 1. 1D microwave photonic insulator. a, Lattice of dielectric resonators inside the microwave cavity made of two metallic plates. The top plate, which is partially shown, is movable in the plane (white arrows), so that an antenna going through and connected to a vector network analyser (VNA) enables the generation and resolu-tion of the microwave signal both spectrally and spatially (LDOS). b, Illustration of the SSH lattice (top) and picture of its realisation with dielectric resonators (bottom). c (top) DOS of a 44-resonator
SSH lattice for t1/t2 = 1.2 (w> = 0) showing two bands separated
by a frequency gap, (bottom) DOS of a 44-resonator SSH lattice for
t1/t2 = 0.8 (w< = −1), revealing two midgap modes A and B. The
resolution of their LDOS (inset) confirms that they are localised at the two ends of the lattice and fully sublattice polarised.
2
photonic insulator. Moreover, we show that the quantised charge of the vortex, which corresponds to the variation of the number of interference fringes at the transition, consistently coincides with the variation in the number of topologically-protected boundary modes inside the spectral gap. This leads us to the experimental demonstration of the pillar of the topological phases of matter, the bulk-boundary correspondence.
Description of the 1D photonic insulator
In 1D, the band topology of insulators may become nontrivial in the presence of chiral symmetry. For lattices with transla-tional invariance, this concerns a class of Bloch Hamiltonians that are bipartite
H(k)= 0 h(k) h†(k) 0
!
, (1)
where k is the dimensionless 1D quasi-momentum. An illu-minating illustration of Hamiltonian (1) is found in the cel-ebrated Su-Schrieffer-Heeger (SSH) model [16]. First intro-duced to describe conducting electrons in polyacetylene, it is involved in the physics of various chiral systems [17–22]. Here, we focus on an experimental realisation in a microwave photonic insulator. The system consists of a dimerised lattice of dielectric resonators in a microwave cavity (see Figs.1a,b). Each cylindrical resonator is made of ZrSnTiO ceramics (ra-dius r= 3 mm, height h = 5 mm, with an index of refraction nr ≈ 6) and supports a fundamental transverse-electric (TE1)
mode of bare frequency of 7.435 GHz. This mode spreads out evanescently, so that the coupling strength can be con-trolled by adjusting the separation distance between the res-onators [23]. The lattice consists in two coupled sublattices A and B with staggered coupling strengths t1 and t2, so that
h(k) = t1 + t2e−ik for the choice of unit cell in Fig.1b. The
corresponding resonator separations are denoted d1and d2. In
our experiments, the coupling strengths t1,2 can be typically
adjusted from 10 MHz to 115 MHz which corresponds to sep-arations d1,2of 16 mm and 7 mm respectively.
The SSH model is known to display a transition between two topologically distinct insulators when varying the cou-pling ratio t1/t2. Its spectrum exhibits two bands given by
f±(k)= ±|h(k)| and whose topology relies on the quantisation
of the geometrical Zak phase of the Bloch wave function in the 1D Brillouin zone (BZ) [24]. This quantisation is char-acterised by the winding number w = HBZ∇kArg[h(k)]dk/2π,
which leads to w> = 0 and w< = −1 in the two insulating
regimes t1≷ t2.
Topology from localised boundary modes
Before shedding new light on the topological transition, let us recall that in experiments, the band topology is mainly evidenced through the appearance/disappearance of midgap modes localised at the lattice boundaries, by virtue of the fa-mous bulk-boundary correspondence [25]. Here, the bulk-boundary correspondence predicts the existence of NA= −w≷
(NB= −w≷) bound states with sublattice polarisation A (B) at
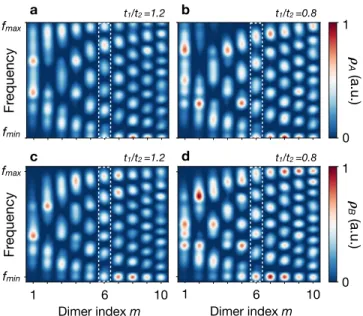
Dimer index m fmin fmax Fr equency a 1 10 fmin fmax Fr equency 6 c t1/t2 =1.2 t1/t2 =1.2 0 𝝆 B (a.u.) 1 6 10 1 0 𝝆 A (a.u.) b Dimer index m t1/t2 =0.8 t1/t2 =0.8 1 d
FIG. 2. Experimental LDOS maps: Resolution of the lower band
between frequencies fmin = 7.23 GHz and fmax = 7.45 GHz (see
Fig.1c). a, LDOS of sublattice A for t1/t2 = 1.2. b, LDOS of
sub-lattice A for t1/t2 = 0.8. The number NAof LDOS maxima changes
identically on each dimer from NA = m in panel a to NA= m − 1 in
panel b (see e.g. the in white dashed box at dimer index m= 6). c,
LDOS of sublattice B for t1/t2 = 1.2. d, LDOS of sublattice B for
t1/t2 = 0.8. The number NB of LDOS maxima remains indentical
in panels c and d (see e.g. in the white dashed box at dimer index
m= 6).
the leftmost (rightmost) edge of the crystal in Fig.1b (See Supplementary Information). We report the observation of these midgap boundary modes in Figs.1c,d. It shows the mea-sured density of states (DOS) of the TE waves in a lattice of 44 microwave resonators (see Supplementary Information for details). For t1/t2 = 1.2, where the bulk winding number is
w>= 0, the sublattice structure produces two frequency bands
of 22 modes each. In contrast, when t1/t2= 0.8, the 1D
wind-ing number switches to w<= −1 and we observe two modes
pinned in the gap. We then confirm that they are sublattice polarised and spatially localised at the two ends of the crystal by resolving their LDOS (inset of Fig.1d).
The observation of midgap modes localised at boundaries is commonly considered as the hallmark of topological transitions, as reported in mechanical, acoustic, photonic, microwave, cold-atomic, and electronic systems [26–33]. Nevertheless, the band topology is defined from the delo-calised waves beyond the excitation gap. Now we present direct evidence of the topological transition through LDOS measurements of the delocalised waves.
LDOS interferences of delocalised waves
The delocalised waves correspond to resonance frequencies in the two bands f±. Figures 2a-d represent the
sublattice-resolved LDOS ρA,B of the delocalised waves of the lower
band f− probed in the two topological regimes. Only the
half is inversion symmetric (see Supplementary Information). The LDOS maps consist of standing-wave interference pat-terns due to the lattice boundaries. We focus in particular on the number NA(B) of constructive-interference fringes in the
LDOS of sublattice A(B). For the sublattice A in Figs.2a,b, we observe that NAchanges identically on each site m through the
topological transition. For instance, there are six constructive-interference fringes on site m= 6 when t1/t2 = 1.2, whereas
there are five of them when reducing the coupling ratio to t1/t2 = 0.8. More generally, it shows that NA = m for
t1/t2 = 1.2 and NA = m − 1 for t1/t2 = 0.8. In contrast,
we do not observe such a change on sublattice B, where there are always NB = m constructive-interference fringes per site,
regardless of the topological phase (Figs.2c,d).
To explain this striking feature in the LDOS maps near the edge, we focus on a semi-infinite SSH chain and model the edge as an infinite potential barrier. Backscattering of the de-localised waves on the edge then leads to the LDOS [34]
ρA(m, k) ∝ 1+ cos(2km + δA(k)+ π) (2)
ρB(m, k) ∝ 1+ cos(2km + π) , (3)
which reproduces very well the experimental LDOS maps in Fig.2(see Supplementary Information). The oscillating terms in the right-hand sides describe the LDOS fluctuations in-duced by the edge. The wavelength of the oscillations on both sublattices relates to the backscattering wavevector 2k. Such 2k-wavevector oscillations are often referred to as (frequency-resolved) Friedel oscillations, with reference to the charge density oscillations that screen charged impurities in metals [35]. It varies with the frequency at which we probe the cavity through the dispersion relation f−(k). The wavelength of the
oscillations is then a spectral measurement and does not imply the topology of the frequency band. For instance, the oscil-lations in ρB only depend on the backscattering wave-vector
and give rise to similar interference patterns in the two topo-logical regimes, as observed experimentally in Figs.2c,d. In contrast, the oscillations in ρAimply the additional phase shift
δA(k)= 2Arg[h(k)] (see Ref. [34]).
The phase shift δAfurther leads to dramatic modifications in
the LDOS interference patterns. Let us focus, for instance, on the LDOS maxima in Eq. (2). They correspond to the specific wavefronts 2nAπ = 2km + δA + π, where nA is an integer.
When summing over the lower frequency band, we find that the number of constructive-interference fringes verifies
NA= Z fmax fmin ∂nA ∂ f− d f−= Z π 0 dk 2π 2m+ ∂δA ∂k ! = m + w . (4)
This sum rule shows that the scattering phase shift δA relates
an observable quantity (NA) of the delocalised waves to their
topological winding w. In particular, the number of interfer-ence fringes depends on the site index m, but the topological invariant shifts the interference fringes identically on all sites. Remarkably, if the winding number w depends on the choice of unit cell [36,37], this arbitrary choice is however included in the labelling of the dimers m, such that their sum yields the
observable quantity NA. The sum rule then explains the
uni-form change of NA observed in the LDOS maps in Figs2a,b
for the winding numbers w> = 0 and w< = −1. Therefore,
the LDOS maps reveal direct evidence of the band topology of the delocalised waves in the 1D microwave insulator.
The phase shifts of wave functions also play a central role in scattering physics, because they relate to the num-ber of (virtual) bound states at a potential barrier. Funda-mental theorems, such as Levinson theorem or Friedel sum rule, show that, for given wave functions, the number of (virtual) bound states change with the depth of the barrier [35, 38, 39]. Similarly here, the bulk-boundary correspon-dence can be rephrased as a relation between the scattering phase shift δAand the number NAof bound states localised at
the potential barrier of the edge. Since δA(π) − δA(0) = 2πw
(see Eq. (4)), we readily find
δA(0) − δA(π)= 2πNA. (5)
The important difference, however, is that the number of bound states here changes with the topological transition, whereas the strength of the potential barrier remains the same. This change results from an intrinsic property of the delocalised waves and the potential barrier at the edge only acts as a natural interferometer that reveals their topology through the scattering phase shift. If the phase shift vari-ation has been measured through NA in the LDOS maps
of sublattice A (Figs.2a,b), we have also resolved the NA
midgap bound states localised at the edge (inset of Fig.1d).
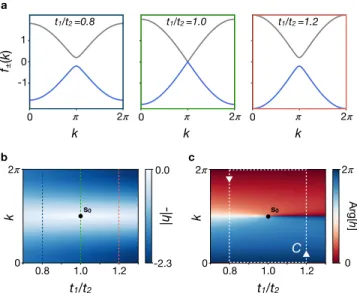
Ar g[ h] 2𝜋 𝜋 2𝜋 𝜋 2𝜋 𝜋 0 0 0 k k k 0 -1 1 f(k± ) t1/t2 =1.2 t1/t2 =1.0 t1/t2 =0.8 0.0 -2.3 -|h | 2𝜋 0 t1/t2 0.8 1.0 1.2 t1/t2 0.8 1.0 1.2 0 2𝜋 k 0 2𝜋 k C s0 s0 a b c
FIG. 3. Band degeneracy and phase singularity: a, Spectral bands
f±(k)= ±|h(k)| in the 1D BZ for various values of the parameter t1/t2.
The band crossing for t1/t2 = 1 marks the topological transition
be-tween the two insulating regimes. b, Energy band f−(s)= −|h(s)|
rep-resented in the 2D parameter space. The spectral degeneracy occurs
at point s0 = (1, π). The colored vertical dashed lines correspond to
the 1D spectral bands in panel a. c, Eigenstate phase θ(s)= Arg[h(s)]
in the 2D parameter space. It is singular at the spectral degeneracy
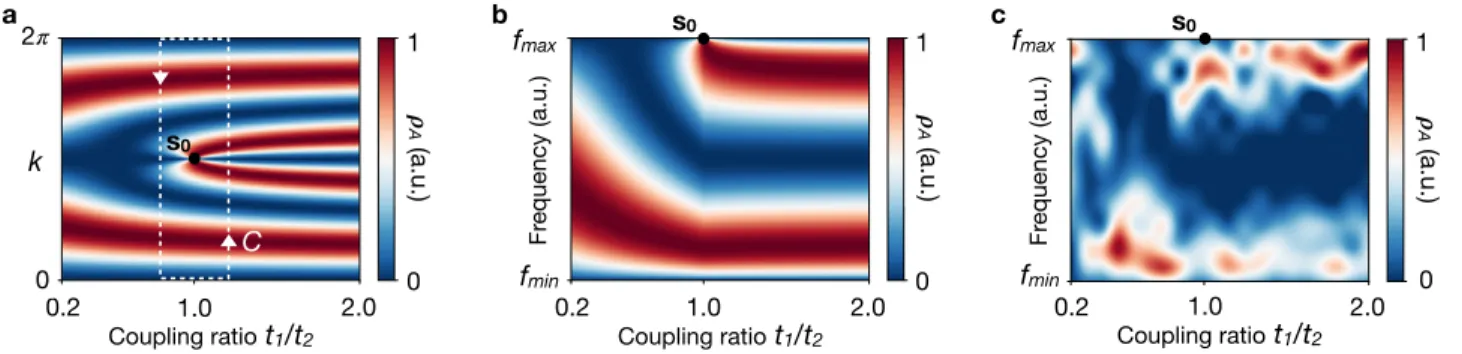
4 Fr equency (a.u.) 0.2 2.0 fmin 0.2 2.0 Coupling ratio t1/t2 0 2𝜋 k -1 1 0 1 𝝆 A (a.u.) a 0.2 2.0 0 1 𝝆 A (a.u.) fmax Fr equency (a.u.) fmin b s0 s0 fmax s0 0 1 𝝆 A (a.u.) 1.0 1.0 1.0
Coupling ratio t1/t2 Coupling ratio t1/t2
c
C
FIG. 4. Wavefront dislocation in the LDOS: a, Theoretical LDOS ρAin the 2D parameter space on site m = 2. The phase singularity
in s0 = (1, π) corresponds to a wavefront dislocation of strength Wd = 2 in the LDOS. b, Theoretical LDOS ρA on site m = 2 in the 2D
space (t1/t2, f−(k)), where f−(0)= fminand f−(π)= fmax. Only one interference fringe emerges from the dislocation core in this frequency
representation of the LDOS. c, Experimental LDOS ρAresolved on site m= 2 for the lower frequency band. One constructive-interference
fringe emerges in the LDOS near s0, as expected from panel b.
Thus, both sides of Eq. (5) are observable independently, and our measurements also bring evidence of the bulk-boundary correspondence. This demonstrates an efficient method to test this key concept of gapped topological systems through the LDOS in the experiments.
Wavefront dislocations in the LDOS
Now we show that the change of NA observed in the LDOS
maps arises as a ubiquitous wave phenomenon and is the sig-nature of a wavefront dislocation in the LDOS. Topological defects in waves rely on generic assumptions that do not in-volve the wave equation, and so they are ubiquitously inin-volved in branches of physics as various as electromagnetism, optics, acoustics, fluid physics, astrophysics, and condensed matter physics [2–8,10,11,40,41]. The wavefront dislocations are associated with the topological phase singularities of wave-fields in a space of at least dimension 2.
Here, the microwave photonic insulator is 1D and its topo-logical transition relies on a spectral band crossing in the 1D BZ (Fig.3a). Nevertheless, the topological transition is driven by the coupling ratio t1/t2. Thus, it is fully characterised in a
2D space associated with the parameter s= (t1/t2, k). In this
parameter space, the spectral bands are f±(s)= ±|h(s)| and the
eigenstates can be chosen as |u±(s)i ∝ |Ai ± eiθ(s)|Bi, where
θ(s) = Arg[h(s)]. The zeroes of h(s) are points where i) the spectral band gap closes and ii) the eigenstate phase θ(s) be-comes ill-defined. This phase singularity in 2D is nothing but a vortex that constrains the surrounding phase texture to wind. The vortex winding is then quantified by a topological index Ws, such that
H
C∇sθ · ds = 2πWsalong a closed circuit C
en-closing the phase singularity. In the SSH model, s0 = (1, π) is
the only point where h(s) vanishes (Fig.3b). This leads to the singularity charge Ws= 1 for the counter-clockwise circuit C
in Fig.3c.
The phase singularity in the 2D parameter space is the source of a wavefront dislocation of strength 2Ws in the
LDOS. We can evidence the dislocation by following the evo-lution of the LDOS interference patterns through the topologi-cal transition. Figure4a shows the predicted LDOS evolution
on a given site of sublattice A (m = 2). It exhibits an edge dislocation with two constructive-interference fringes emerg-ing from the core in s0. Wavefront dislocations are known
to occur as the phase singularity of a complex scalar field whose real (or imaginary) part represents a physical quantity [1]. Here, the physical quantity is the LDOS fluctuations de-fined as∆ρA = −Im∆GA/π (oscillating term in Eq. (2)), so
that the complex scalar field is the scattering Green function ∆GA that describes the delocalised waves backscattering on
the edge of the microwave insulator
∆GA(m, s) ∝ −ieiϕA(s), (6)
where ϕA(s) = 2km + δA(s)+ π. The scattering phase shift
δA(s) = 2Arg[h(s)] maps the phase singularity of the
eigen-states into the phase of the scattering Green function. The lat-ter effectively describes a plane wave (ei2km) passing through
a vortex (eiδA(s)) in the 2D parameter space. This effective
vor-tex perturbs the surrounding phase of the wave in such a way that, for the counter-clockwise Burgers circuit C in Fig.4a, the phase accumulated by the scattering Green function satisfies
2πWd≡
I
C
∇sϕA(s) · ds= 4πWs (7)
The phase variation is 2π-quantised because∆GAmust be
sin-gle valued to describe observable LDOS fluctuations along the circuit C. Thus, the number of additional interference fringes required to fulfil the phase variation along the Burgers circuit Cis Wd. In analogy with Burgers’ vectors whose length
pro-vides the dislocation strength for atomic planes in solids, Wdis
the strength of the wavefront dislocation. Since Ws= 1 in the
SSH model, there are Wd = 2 additional interference fringes
emerging from the dislocation core, as shown in Fig.4a. It is worth stressing that although the expression of the phase ϕA
depends on the choice of the unit cell, its variation over C does not and is observable.
To confirm this prediction, we measure the LDOS on the site m= 2 of sublattice A for 20 values of the coupling ratio t1/t2 between 0.2 and 2.0. Since the LDOS is resolved as a
function of the frequency f−(k) instead of the wave vector k
in our experiments, we do not expect Wd but Wd/2
interfer-ence fringes emerging from the dislocation core (Fig. 4b). Figure 4c experimentally confirms that the number NA of
constructive-interference fringes changes from one to two at the dislocation core. This is also in agreement with the LDOS change on site m = 2 shown in Figs.2a,b. This observation reveals the wavefront dislocation at the topological transition that causes the uniform change in the number of fringes NA
in the LDOS interference pattern. Conclusion
We have probed the band topology of a 1D photonic insulator through the standing-wave interference pattern in the LDOS resulting from backscattering on a boundary. We have shown that the uniform change in the number of interference fringes at the topological transition is a measurement of the disloca-tion strength and then of the eigenstate phase singularity. This 2D phase singularity constrains the 1D winding numbers of the two nonequivalent SSH insulators as Ws = w>− w<(see
Fig.3). Although there is a gauge choice in the definition of the 1D winding numbers, their difference is gauge invariant and the uniform change in the number of interference fringes characterises unambiguously the change of band topology at the transition. Thus, the wavefront dislocation in the LDOS is an observable phenomenon that reveals the topological transi-tion in 1D insulators.
The band topology of 1D insulators is also known to af-fect the electron response to external force fields through phe-nomena such as the electric polarisation and Bloch oscilla-tions [42–44]. Nevertheless, these phenomena are observable in very specific systems. Bloch oscillations, for instance, are hardly observable with electrons in solids, where impurities are usually detrimental to phase coherence, and so they lead to band topology measurements in cold atoms [19]. In con-trast, the LDOS is an observable routinely resolved in various kinds of systems [26–33]. Thus, we expect that topological defects in real-space LDOS interference can reveal the band topology in experiments involving propagating waves of very different natures.
In addition to the band topology through wavefront dis-locations, the LDOS also leads to the resolution of midgap modes localised at boundaries. This enabled us to test of the bulk-boundary correspondence through a single observable and, thus, a single experiment. This efficient approach could then shed light into breakdowns of the bulk-boundary correspondence, as recently reported in systems where the number of bound states may no longer be provided by the bulk topological invariant [22,45].
Methods
Each dielectric microwave resonator (see figures 1 a and b) is made of ZrSnTiO ceramics (radius r = 3 mm, height h = 5 mm, with an index of refraction nr ≈ 6) and supports
a fundamental TE mode of bare frequency ν0 = 7.435 GHz.
This mode spreads out evanescently, so that the coupling
strength can be controlled by adjusting the separation distance between the resonators [23]. As shown in Fig1.b, the lattice consists of two coupled sublattices A and B with staggered coupling strengths t1 and t2. The corresponding resonator
separations are denoted d1 and d2. In our experiments, the
coupling strengths t1,2can be typically adjusted from 10 MHz
to 115 MHz which corresponds to separations d1,2of 16 mm
and 7 mm respectively. Acknowledgments
M.B. and F.M acknowledge fruitful discussions with Urich Kuhl. C.D. acknowledges the support of Idex Bordeaux (Maesim Risky project 2019 of the LAPHIA Program).
∗
[1] Nye, J. F. & Berry, M. V. Dislocations in wave trains. Pro-ceedings of the Royal Society of London. A. Mathematical and Physical Sciences 336, 165–190 (1974).
[2] Berry, M. V. Making waves in physics. Nature 403, 21–21 (2000).
[3] Mawet, D., Riaud, P., Absil, O. & Surdej, J. Annular groove phase mask coronagraph. The Astrophysical Journal 633, 1191 (2005).
[4] Dennis, M. R., O’Holleran, K. & Padgett, M. J. Singular optics: optical vortices and polarization singularities. In Progress in optics, vol. 53, 293–363 (Elsevier, 2009).
[5] Padgett, M. & Bowman, R. Tweezers with a twist. Nature Photonics 5, 343–348 (2011).
[6] Rafayelyan, M. & Brasselet, E. Bragg-Berry mirrors: reflective broadband q-plates. Optics Letters 41, 3972–3975 (2016). [7] Al Dhaybi, A., Degert, J., Brasselet, E., Abraham, E. & Freysz,
E. Terahertz vortex beam generation by infrared vector beam rectification. Journal of the Optical Society of America B 36, 12–18 (2019).
[8] Berry, M. V., Chambers, R. G., Large, M. D., Upstill, C. & Walmsley, J. C. Wavefront dislocations in the Aharonov-Bohm effect and its water wave analogue. European Journal of Physics 1, 154 (1980).
[9] Berry, M. Gauge-invariant Aharonov–Bohm streamlines. Jour-nal of Physics A: Mathematical and Theoretical 50, 43LT01 (2017).
[10] Dutreix, C. et al. Measuring the Berry phase of graphene from wavefront dislocations in Friedel oscillations. Nature 574, 219– 222 (2019).
[11] Zhang, Y., Su, Y. & He, L. Local Berry phase signatures of bilayer graphene in intervalley quantum interference. Physical Review Letters 125, 116804 (2020).
[12] Kosterlitz, J. M. Nobel lecture: Topological defects and phase transitions. Reviews of Modern Physics 89, 040501 (2017). [13] Haldane, F. D. M. Nobel lecture: Topological quantum matter.
Reviews of Modern Physics 89, 040502 (2017).
[14] Ozawa, T. et al. Topological photonics. Reviews of Modern Physics 91, 015006 (2019).
[15] Soskin, M., Boriskina, S. V., Chong, Y., Dennis, M. R. & Desy-atnikov, A. Singular optics and topological photonics. Journal of Optics 19, 010401 (2016).
[16] Su, W., Schrieffer, J. R. & Heeger, A. J. Solitons in polyacety-lene. Physical Review Letters 42, 1698 (1979).
6
states in particle-hole symmetric systems. Physical Review Let-ters 89, 077002 (2002).
[18] Delplace, P., Ullmo, D. & Montambaux, G. Zak phase and the existence of edge states in graphene. Physical Review B 84, 195452 (2011).
[19] Atala, M. et al. Direct measurement of the zak phase in topo-logical bloch bands. Nature Physics 9, 795–800 (2013). [20] St-Jean, P. et al. Lasing in topological edge states of a
one-dimensional lattice. Nature Photonics 11, 651–656 (2017). [21] Parto, M. et al. Edge-mode lasing in 1d topological active
ar-rays. Physical Review Letters 120, 113901 (2018).
[22] Downing, C. A., Sturges, T. J., Weick, G., Stobi´nska, M. & Mart´ın-Moreno, L. Topological phases of polaritons in a cavity waveguide. Physical Review Letters 123, 217401 (2019). [23] Bellec, M., Kuhl, U., Montambaux, G. & Mortessagne,
F. Tight-binding couplings in microwave artificial graphene. Physical Review B 88, 115437 (2013).
[24] Zak, J. Berry’s phase for energy bands in solids. Physical Re-view Letters 62, 2747–2750 (1989).
[25] Franz, M. & Molenkamp, L. Topological insulators (Elsevier, 2013).
[26] Rechtsman, M. C. et al. Photonic Floquet topological insula-tors. Nature 496, 196–200 (2013).
[27] Hafezi, M., Mittal, S., Fan, J., Migdall, A. & Taylor, J. Imaging topological edge states in silicon photonics. Nature Photonics 7, 1001–1005 (2013).
[28] Poli, C., Bellec, M., Kuhl, U., Mortessagne, F. & Schomerus, H. Selective enhancement of topologically induced interface states in a dielectric resonator chain. Nature communications 6, 1–5 (2015).
[29] Nash, L. M. et al. Topological mechanics of gyroscopic meta-materials. Proceedings of the National Academy of Sciences 112, 14495–14500 (2015).
[30] Yang, Z. et al. Topological acoustics. Physical Review Letters 114, 114301 (2015).
[31] Goldman, N. et al. Direct imaging of topological edge states in cold-atom systems. Proceedings of the National Academy of Sciences 110, 6736–6741 (2013).
[32] M´enard, G. C. et al. Two-dimensional topological supercon-ductivity in Pb/Co/Si (111). Nature Communications 8, 1–7 (2017).
[33] Schindler, F. et al. Higher-order topology in bismuth. Nature Physics 14, 918–924 (2018).
[34] Dutreix, C. & Delplace, P. Geometrical phase shift in friedel oscillations. Physical Review B 96, 195207 (2017).
[35] Friedel, J. XIV. the distribution of electrons round impurities in monovalent metals. The London, Edinburgh, and Dublin Philo-sophical Magazine and Journal of Science 43, 153–189 (1952). [36] Rhim, J.-W., Behrends, J. & Bardarson, J. H. Bulk-boundary correspondence from the intercellular Zak phase. Physical Re-view B 95, 035421 (2017).
[37] Guzman, M., Bartolo, D. & Carpentier, D. Geometry and topol-ogy tango in chiral materials. arXiv:2002.02850 (2020).
[38] Levinson, N. On the uniqueness of the potential in
a Schr¨odinger equation for a given asymptotic phase. Matematisk-fysiske meddelelser Kongelige Danske Vidensk-abernes Selskab 25, 1–29 (1949).
[39] Friedel, J. Metallic alloys. Il Nuovo Cimento (1955-1965) 7, 287–311 (1958).
[40] Dutreix, C. & Katsnelson, M. I. Friedel oscillations at the sur-faces of rhombohedral n-layer graphene. Physical Review B 93, 035413 (2016).
[41] Phong, V. T. & Mele, E. J. Obstruction and interference in low energy models for twisted bilayer graphene. arXiv preprint
arXiv:2003.00150(2020).
[42] King-Smith, R. D. & Vanderbilt, D. Theory of polarization of crystalline solids. Physical Review B 47, 1651–1654 (1993). [43] Resta, R. Macroscopic polarization in crystalline dielectrics:
the geometric phase approach. Reviews Modern Physics 66, 899–915 (1994).
[44] Xiao, D., Chang, M.-C. & Niu, Q. Berry phase effects on
elec-tronic properties. Reviews of Modern Physics 82, 1959 (2010). [45] Tauber, C., Delplace, P. & Venaille, A. Anomalous bulk-edge
correspondence in continuous media. Physical Review