HAL Id: hal-02958996
https://hal.archives-ouvertes.fr/hal-02958996
Submitted on 12 Oct 2020
HAL is a multi-disciplinary open access
archive for the deposit and dissemination of
sci-entific research documents, whether they are
pub-lished or not. The documents may come from
teaching and research institutions in France or
abroad, or from public or private research centers.
L’archive ouverte pluridisciplinaire HAL, est
destinée au dépôt et à la diffusion de documents
scientifiques de niveau recherche, publiés ou non,
émanant des établissements d’enseignement et de
recherche français ou étrangers, des laboratoires
publics ou privés.
A latitudinal productivity band in the central North
Atlantic over the last 270 kyr: An alkenone perspective
J. Villanueva, E. Calvo, C. Pelejero, J. Grimalt, A. Boelaert, L. Labeyrie
To cite this version:
J. Villanueva, E. Calvo, C. Pelejero, J. Grimalt, A. Boelaert, et al.. A latitudinal productivity band
in the central North Atlantic over the last 270 kyr: An alkenone perspective. Paleoceanography,
American Geophysical Union, 2001, 16 (6), pp.617-626. �10.1029/2000PA000543�. �hal-02958996�
PALEOCEANOGRAPHY, VOL. 16, NO. 6, PAGES 617-626, DECEMBER 2001
A latitudinal productivity band in the central North Atlantic
over the last 270 kyr: An alkenone perspective
J. ¾illanueva, E. Calvo, C. Pelejero, and J. O. Grimalt
Institute of Chemical and Environmental Research, Consejo Superior de Investigaciones Cientificas Barcelona, Spain
A. Boelaert and L. Labeyrie
Laboratoire des Sciences du Climat et de l'Environnement, CNRS, Gif-sur-Ivette, France
Abstract. Productivity
changes
in the central North Atlantic Ocean have been traced by means of the total C37 alkenone
contents
along two sediment
cores
located
at 43øN and 37øN. Both alkenone
signals
revealed
the occurrence
of discrete
productivity
events every 23 kyr. Spectral
analyses
highlight the presence
of a dominant
23-kyr periodicity in the alkenone
signal, which is highly coherent to the precession
index. However, a close comparison
revealed small but relevant
differences
in the timing of several of the productivity events recorded
at both locations.
These asynchronies
suggest
that
the alkenone
maxima do not necessarily
reflect a general increase
of productivity
over the North Atlantic. We propose
that
the events
are related to a latitudinal
band of productivity
that moves northward
and southward
over time. Satellite-derived
productivity
estimates
show that the present
location
of this band is 45ø-55øN. To illustrate
this hypothesis
we have
constructed
a conceptual
model that reconstructs
the temporal
changes
of productivity
at one given location
by assuming
a
productivity
band that evolutes
latitudinally over time. The model is able to reconstruct
the main features
of the alkenone
records,
namely, (1) the occurrence
of discrete
and abrupt productivity
events, (2) the asynchrony
at different latitudes,
and
(3) the bimodal pattern of many of the productivity
peaks.
1. Introduction
Marine productivity has been proposed to be one of the main factors controlling the CO2 transport from the atmosphere to the intermediate and deep seawaters and sediments. Unfortunately, whereas the atmospheric CO2 variations during the last four glacial-interglacial cycles have been well determined [Petit et al.,
1999], the changes in marine productivity are still far from being described with accuracy.
In the case of the North Atlantic Ocean, much controversy exists concerning estimates of past marine productivity. Studies based on total organic carbon (TOC) measurements in the northeastern Atlantic (50ø-60øN) suggested enhanced or similar productivity during the Holocene and the Last Glacial Maximum (LGM) [Manighetti and McCave, 1995]. These conclusions were not confirmed by investigations based on benthic foraminiferal shell remains in similar cores, which indicated lower productivity during the LGM [Thomas et al., 1995]. Moreover, distributions of diatom assemblages in core DSDP-609 suggested similar productivity in the central North Atlantic (50øN) during the LGM and Holocene periods [Sancetta, 1992]. On the other hand, studies covering one of several glacial cycles indicated higher productivity during glacial periods in the central Labrador Sea [Stein, 1991]. This temporal trend was inverted in the northern Labrador Sea [Stein and Stax, 1991]. Finally, the coccolitho- phorid-related productivity at 43øN was dominated by a 23-kyr cycle [Villanueva et al., 1998b], a precessional control that was not apparent at 52øN [IS'llanueva et al., 1997a]. All these contradicting results evidence a complex spatial and temporal behavior in the paleoproductivity history of the North Atlantic
Ocean.
Copyright 2001 by the American Geophysical Union. Paper number 2000PA000543.
0883-8305/01/2000PA000543 $12.00
The evolution of the polar front in the North Atlantic Ocean during the last glacial-interglacial climatic cycles has been con- strained by studies based on foraminiferal and coccolithophorid assemblages [CLIMAP, 1976; Ruddiman and Mcintyre, 1976]. During glacial periods the polar front was located at intermediate positions between the present position north of Iceland and its southem location at 41 ø-46øN [Ruddiman and Mcintyre, 1976]. Ruddiman [1977] showed that during the last glacial period a massive input of ice-rafted detrital matter accumulated north of the polar front. For this reason, glacial sediments accumulated north of 41øN in the North Atlantic received significant inputs of con- tinental organic matter [Manighetti and McCave, 1995], which can account for more than 80% of the sedimentary organic carbon [Villanueva et al., 1997a]. This fact limits substantially the tradi- tional use of accumulation rates of organic carbon to trace paleoproductivity changes in the North Atlantic.
The long-chain alkenones are a series of C37-C39 ketones with two, three, or four double bonds in the aliphatic chain that are specific markers of some Haptophyte algae [Conte et al., 1995; Marlowe et al., 1984]. These lipids occur in significant amounts in most marine sediments [Marlowe et al., 1990] and represent a substantial fraction of the organic matter in the coccolithophorid Emiliania huxleyi (8.0 + 2.9% [Prahl et al., 1988]). A part from the well-established use of C37 alkenones for the assessment of pale-
otemperatures
by means
of the u3k'7
index
[e.g.,
Brassell
et al.,
1986], the sedimentary content of these compounds was proposed as a tool to estimate changes in Haptophyceae productivity in the past [Brassell, 1993]. However, most studies performed on late Quaternary sediments have systematically shown that the downcore vailabilities of the TOC and alkenone signals are virtually identical [Miiller et al., 1997; Prahl et al., 1989; Rostek et al., 1997; Schubert et al., 1998; Sicre et al., 2000]. The evidence collected by several studies indicates that the alkenone/TOC ratio in one given location remains constant over time [Miiller et al., 1997; Sicre et al., 2000]. The implication is that the downcore alkenone and TOC variabil- ities are virtually the same because the alkenone content of the618 VILLANUEVA ET AL.: A LATITUDINAL PRODUCTIVITY BAND 70 60 Z 50 • 40 30 20 Prod. 21-25W o lO 20 o , I I Prod. 31-35W Prod. 41-45W lO 20 0 lO 20 I I I I 70 60 40 =
30 ,l
20 lO lOFigure
1. (a) Map showing
the spatial
distribution
of marine
productivity
(in gC m -2) during
the month
of June
over the North Atlantic Ocean (adapted from Antoine et al. [ 1996]). The location of cores SU90/08 and MD952037 are included for reference. The thick gray line reflects the presence of a latitudinal area with high productivity. (b) Latitudinal transects of satellite-derived productivity at three different longitudes (see vertical lines in Figure 1 a). The shaded area highlights the presence of a distinct latitudinal band of high productivity. The data used to construct the map and to calculate the latitudinal transects have been kindly provided by David Antoine. The satellite data are compared to the productivity estimates measured by Weeks et al. [ 1993] in June 1989 over a transect at •20øW (see dots at the 21 ø-25øW transect).sedimentary organic matter is a constant feature in one given sedimentary setting.
Schubert et al. [1998] suggested that the relative constancy of the biomarker composition of the organic matter was probably an indicator of a relatively stable phytoplankton community in the past. However, the role of diagenetic processes in uniformiz- ing the sedimentary alkenone/TOC ratio is not well constrained.
One remarkable result is the marked difference in the alkenone/
TOC ratio measured in sediments younger and older than 74 kyrs B.P. [Mfiller et al., 1997; Sicre et al., 2000] that indicates a drastic change in the alkenone content of the sedimentary organic matter associated with a major reversal in the coccoli- thophorid populations (the main alkenone producers) from the dominance of Gephyrocapsaceae spp. to Emiliania huxleyi [Mfiller et al., 1997]. This shift in the alkenone/TOC ratio is a clear indication that changes in the photic zone are reflected in
the sediments and that diagenesis is not the only controlling
factor of this ratio.
The downcore alkenone and TOC profiles from intermediate and high latitudes of the North Atlantic Ocean usually display distinct trends [Madureira et al., 1997; Rosell-Mel& 1994; IS'11anueva et al., 1997a]. These differences are related to significant contribu- tions of continentally derived organic matter associated with ice- rafted detritus. IS'11anueva et al. [1997a] reconstructed the marine fraction of the TOC in two North Atlantic cores assuming a linear relationship alkenone/TOC. In the present study we have used the alkenone profiles to overcome the interference of terrigenous inputs in paleoproductivity studies based on the sedimentary organic matter content in North Atlantic sediments.
In the present study an assessment of the North Atlantic paleoproductivity is obtained from the study of the sedimentary alkenones in a new core located at 37øN. The results are directly
VILLANUEVA ET AL.: A LATITUDINAL PRODUCTIVITY BAND 619
Depth (cm) SU90/08
2.5 3 3.5 4 4.5 5 5.5 0 100 200 300 400 500 600 700 800 900 1000 1100 1200 1300 ,,,,I,,,,I,,,,I,,,.I .... I .... I .... I .... I .... I .... I .... I .... I .... 2.5 : 4 i 4.5 5 i ' i ' i ' i ' i ' i ' i ' i ' 0 200 400 600 800 1000 1200 1400 1600 -4 - 0 3 1800Depth (cm) MD952037
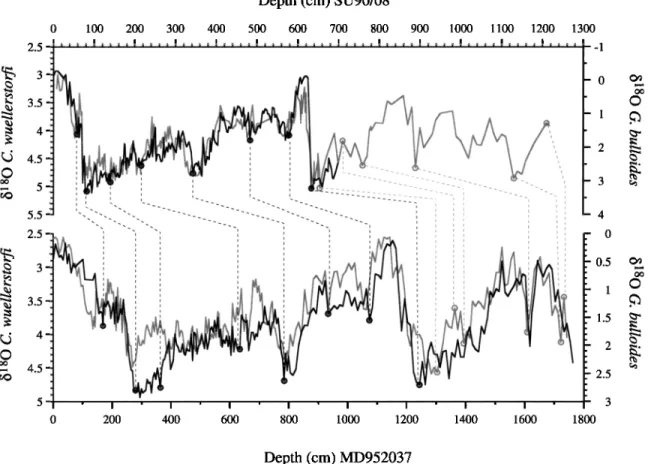
Figure 2. Detailed chronostratigraphy of core MD952037 performed by comparison with the well-studied core SU90/08. Dashed lines connecting circles mark all control points used. The ages of the upper 13 m are based on
comparison
between
both
C.
wuellerstorfi
15180
lines
(thick
lines)•
For
deeper
sections
the
Globigerina
bulloides
15•80
data were used, since there was no SU90/08 C. wuetterstorfi • 0 data available for this period (dotted lines).
compared to a previous biomarker study performed at 43øN [IS'ttanueva et al., 1998b]. The spectral analyses of these two records reveal a precessional control of marine productivity, which is inferred by the occurrence of discrete events occurring approxi- mately every 23 kyr. However, a detailed comparison of both records reveals significant temporal offsets which can be inter- preted from latitudinal oscillations of an area of increased produc- tivity over the central North Atlantic.
2. Relevant Oceanographic and Ecological
FeaturesStudies based on sediment accumulation rates and incubation
experiments have suggested a latitudinal gradient of primary productivity in the North Atlantic between 30 ø and 65øN. More intense seasonal algal blooms and a higher flux of biogenic particles to the sediments have been reported north of 40ø-50øN [ShimmieM et at., 1995; Weeks, 1993]. Between 15 ø and 40øN, productivity is generally low, owing to the presence of a deep and well-established thermocline associated with the Eckman pumping in the central gyre.
More recently, modeling of satellite-derived chlorophyll fields has been used to predict primary production in the global oceans [Antoine et at., 1996; Antoine and Morel, 1996; Morel et at., 1996; Platt et al., 1995]. This newly developed tool allows the possibility of examining spatial gradients of primary production, their seasonal variation, and their fluctuation between years. Concerning the central North Atlantic, the oligotrophic character
of the subtropical gyre is well represented between 15 ø and 40øN by such satellite-derived estimations [Antoine et at., 1996; Platt et at., 1995]. Productivity increases latitudinally north of the sub- tropical gyre (Figures l a and lb). One remarkable feature revealed by the satellite estimates is the existence of a distinct latitudinal band of high primary productivity that extends from 45 ø to 55øN (Figure 1), which is well developed during spring and summer [Antoine et at., 1996; Platt et at., 1995]. The occurrence of a band of high productivity is better observed at
the 21ø-25øW transect than farther west. The latitudinal trend
reconstructed by satellite data coincides remarkably well with the productivity estimates measured in situ in June 1989 [Weeks,
1993].
3. Materials and Methods 3.1. Stratigraphy
Gravity core SU90/08 (43ø30'N,
30ø24'W,
3100 m deep, 12 m
long) and piston core MD952037 (37ø05'N,
32ø02'W,
2630 m
deep, 36 m long) were retrieved in the North Atlantic during PALEOCINAT I (1990); Le Suroœt vessel) and IMAGES 101 (1995; Marion Dufresne H vessel) cruises, respectively. Both cores are located in the western side of the Mid-Atlantic Ridge. Core SU90/08 and core MD952037 are located at the northern edge and within the subtropical North Atlantic Gyre, respectively.
In order to put both records into the same age scale, the age model published for core SU9008 [IS'ltanueva et at., 1998b] has been taken as a reference. This core has already been extensively
620 VILLANUEVA ET AL.' A LATITUDINAL PRODUCTIVITY BAND 2.5 4.5 5.5 30 3OOO 2000
lOOO
o 0 50 100 150 200 250 .... I . • , , I .... I .... I . • • • I •- ...
.
.•..
./.: P ...
...
...
\
"- ,.'• :. , ..: ,.A •...-•'i i \ • . •i •' ¾ :. ." •..•:." •..:..
h gr ' 0 1 2 3 $U00/08,.., ...
... ...
...
,
i i i i .... i ß 0 50 100 150 200 250 Age (kyr) 3000 2000 - •ooo 0Figure
3. Comparison
of time
profiles
of cores
SU90/08
and
MD952037
of C. wuellerstorfi
6•80, G. bulloides
15180,
sedimentation
rate,
and
C37
alkenone
concentration.
The
precessional
index
is also
plotted
for
comparison
[Laskar, 1990].
studied [Cortijo et al., 1997; Elliot et al., 1998; Grousset et al., 1993; •dal et al., 1997], and its age model is based on 10
accelerator
mass
spectrometry
(AMS) 14C measurements
and
correlation
between
15180
records
of Cibicides
wuellerstorfi
and
Globigerina
bulloides
with the SPECMAP-normalized
isotope
curve [Imbrie et al., 1984; Martinson et al., 1987]. Core
MD952037 has been correlated with SU90/08 on the basis of
comparison
between
parallel
features
on both
C. wuellerstorfi
15180
curves
for the period
from which
they are available
(Figure
2; 150
kyr B.P.
till present).
For the rest
of the record
(270-150 kyr B.P.)
the age model was determined relying on planktic G. bulloides
15180
data
(Figure
2).
Both
planktonic
and
benthic
foraminifera
oxygen
isotope
records
are plotted
versus
ages
in Figure
3, evidencing
a clear
concordance
and thus inferring the same response to the major ice volume changes for these two close locations. Sedimentation rates for both
cores
range
between
2 and
10 cm kyr
-1 (Figure
3). According
to
our sampling
intervals,
the temporal
resolution
ranges
from.4
to 2
kyr in the northermnost
core
and from 0.05 to 4 kyr in the southern
VILLANUEVA ET AL.: A LATITUDINAL PRODUCTIVITY BAND 621 2 1500 1000 5oo 100 110 120 130 140 150 .... I .... I .... I .... I .... -0 .. 3 ß , .... I .... I .... I .... I .... 100 110 120 130 140 150 1500 "• 1000 ¸ • 500 100 110 120 130 140 150 3 100 110 120 130 140 150
2 ....
i ....
i ....
i ....
!.
...
•....:•
• 3 • : ¸ • 1500 lOOO 500 100 110 120 130 140 150 100 110 120 130Age (kyr)
Age (kyr)
Age (kyr)
140 150
Figure 4. A comparison of three dating methods used to evaluate the existence or not of significant temporal shifts
in the occurrence
of alkenone
peaks
at 37øN
and
43øN.
(a) A comparison
of the benthic
15•80,
planktonic
15•80,
and
alkenone profiles that result from the age model described in Figure 2, which is based on the pointers described withthe
arrows.
While
the 15•80
show
concordant
features
(as
imposed
by the
age
model
based
on the
benthic
record),
the
alkenone peaks in both cores occur at completely different times, with temporal offsets of ,-•10 kyr. (b) An artificial•8
age model produced with the planktic 15 O profiles. The pointers used to construct this age model are represented with arrows. Using this method, one pair of the alkenone peaks coincide in time, but significant shifts in the other peaks still exist. (c) An artificial model based on the hypothesis that the alkenone peaks at both core locations are coeval. This assumption clearly leads to significant shifts in the timing of termination II observed in both cores, which are not realistic. Therefore the alkenone peaks recorded at both core locations are not synchronous.
at a higher resolution in both cases. The unusually high sedimenta-
tion
rates
of the top 6 m of core
MD952037
(50-10 cm kyr
-•) are
probably related to stretching processes associated to the Calypso coring device and do not represent the "true" sedimentation rate inthis location.
3.2. Analysis
The procedures and equipment used for C37 alkenones in deep- sea sediments are described elsewhere [Villanueva et al., 1997b]. Briefly, sediment samples were freeze-dried and manually grounded to ensure sample homogeneity. After the addition of an internal standard containing n-nonadecan-l-ol, n-hexatriacon- tane, and n-tetracontane, dry subsamples (•3 g) were extracted
with dichloromethane in an ultrasonic bath. The extracts were
hydrolyzed with 6% potassium hydroxide in methanol for the
elimination of wax ester interferences. The n-hexane extracts were
then evaporated under a N2 stream, derivatized with bis(trimethyl- silyl)trifluoroacetamide, and analyzed by gas chromatography with flame ionization detection. The C37:2 and C37:3 alkenones were identified by coelution with synthetic standards kindly provided by
J. R. Maxwell (University of Bristol, England, UK). Selected samples were examined by gas chromatography; mass spectrom- etry was used for the confirmation of compound identification and the evaluation of possible coelutions. The concentration of each compound was determined using hexatriacontane as the internal
standard
and expressed
as ng g-• of dry weight
sediment
(ng
gdw-1). Absolute
concentration
errors
of C37 alkenones
were
below 10%.
4. Results
4.1. Description of Alkenone Profiles
The alkenone concentration patterns obtained along cores SU90/ 08 and MD952037, which are situated only 700 km apart, show the same general features (Figure 3). First, the concentration range is the same in both cores, with values lying between 10 and 2800 ng
gdw-•. Second,
both
cores
show
similar
temporal
evolutions
in the
alkenone signal, which is not dominated by a glacial-interglacial pattern. Third, some of the alkenone peaks display a bimodal pattern, presenting a clear interruption at the middle of the event.622 VILLANUEVA ET AL.: A LATITUDINAL PRODUCTIVITY BAND ]- 0.8-- 0.6
0.4
0.2 o oSU90/08
O. bulloides 100 41 23 19 i . . . I I I I BVV ! • • • • I CIi
I " ... ' :..I...
• I I , I I ,I '1 ' I ' 0.02 0.04 0.06 0.08 0.1Frequency
(kyr-
1)
] - 0.8 0.6 0.4 0.2 0 0SU90/08
Alkenones 100 41 23 19.i•.•/'l
'l 'l
BW
I I '-4ci,•/' \_"i
' \ ' •
I v I ""; I "d... • ' ' ' ' \% • • • • ,.-...•_ / , I I I I "''. I I I I """%..':I
I
•
I
:'"":.""
I I I .. I ... l ... i 0.02 0.04 0.06 0.08 0.1Frequency
(kyr-
1)
] - 0.8-- 0.60.4
0.2 o o o MD952037 G. bulloides 100 41 23 19 '-', -./' \•""2• ' ' I ,,,./, "": •"'": I .,I
;'"":...:,...
\,,.,.,
I i I I i i i , i I I I ' I ' I ' I ' I ' 0.02 0.04 0.06 0.08 0.1 MD952037 Alkenones 100 41 23 19 . i I I I I BW I • I i I •/x,.L • ,'
Io,
v
I
Ii
•"
'";...,.,..,:.,,
.•
I I',
,
I I I I I I v]V [ [ [ I I I I ] i i ii 0.02 0.04 0.06 0.08 0.1Frequency
(kyr-
1
)
Frequency
(kyr-
1)
Figure
5. Variance
spectra
of G. bulloides
6180
and C37
alkenone
abundances
for both
cores
(expressed
as the
logarithm
of spectral
power
density
versus
frequency
in cycles
kyr-•). Solid
lines
were
obtained
using
the
Blackman-
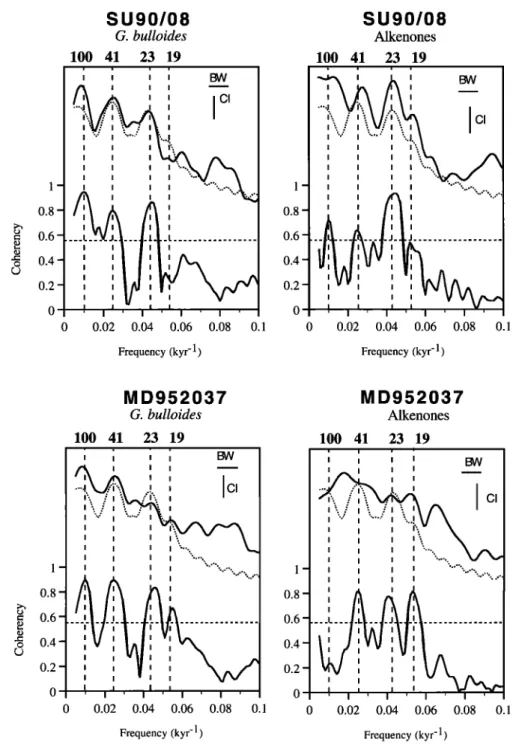
Tuckey method and cross-correlated with a combination of the thre• main orbital parameters, the ETP curve (dotted lines) [Imbrie et al., 1984]. CI and BW stand for confidence interval at 80%, and bandwidth, respectively. The vertical and horizontal solid lines represent their magnitudes, respectively. Vertical dashed lines mark the main orbital periods of eccentricity (100 kyr), obliquity (41 kyr), and precession (23 and 19 kyr). The coherency spectra between core profiles and ETP are shown at the bottom of each profile. The horizontal dashed line indicates the level of nonzero coherence at the 80% confidence interval. We used the Analyseties software [Paillard et al., 1996] to perform the spectral analyses.Finally, both records coincide in the regular appearance of discrete concentration maxima, suggesting a cyclic pattern. However, a closer inspection reveals discrepancies in the timing of some of the events between both cores. Although some of the maxima are synchronous, some of them show some dephasing, especially between 150 and 100 kyr B.P. In order to assess whether the
differences in the timing of some events are significative or are simply associated with uncertainties in the age model, we gener- ated an artificial age model by matching the alkenone peaks observed in both cores (Figure 4). This exercise resulted in serious biases in the oxygen isotope records for both cores, with differ- ences of • 10 kyr in the ages of some well-defined events such as
VILLANUEVA ET AL.: A LATITUDINAL PRODUCTIVITY BAND 623
the termination II and the transition 5e-5d. Such discrepancies are well beyond the uncertainties of the dating method. Thus we conclude that the temporal biases observed between the two alkenone records represent true differences in productivity maxima
between the two locations.
4.2. Spectral Analysis
Simple visual comparison evidences a significant relationship between alkenone maxima and high values in the precession index (Figure 3). In order to evaluate the response of the alkenone signal to the precessional orbital forcing, cross-spectral analyses of both records with the eccentricity-tilt-precession (ETP) curve [Imbrie et al., 1984] have been performed. The alkenone signal of core SU90/08 shows a very high coherency (k = 0.93) at the precessional 23-kyr cyclicity (Figure 5). This mathematical tool also suggests a minor response to the eccentricity and obliquity orbital components that are not visually observed in the original record (Figure 3). Core MD952037 also presents a strong response to the precessional 23- and 19-kyr periodicities with a coherency of 0.77 and 0.80, respectively. In contrast to core SU90/08, in this case the spectral analysis reveals significant variance at the obliquity cycle (41 kyr) with a coherency of 0.82. Overall, the spectral analyses highlight the relevance of the precessional forcing in the accumulation of alkenones in the
central North Atlantic.
The downcore variability of the alkenone signals could be attributed to paleoproductivity changes over time or to a changing degree of preservation of the organic matter, which are associated with sedimentary conditions, especially sedimentation rate and the redox conditions of the bottom waters. In previous North Atlantic studies the possible dominance of preservation effects in the alkenone pattern was discarded on the basis of distinct downcore patterns between the alkenones and other lipids such as the n- alkanes and the fatty acids unsaturation index. In the two cores studied, n-alkanes display a glacial-interglacial pattern that is very similar to the pattern of other tracers of terfigenous components, such as the magnetic susceptibility and the noncarbonate fraction (see I41lanueva et al. [1997a] and Calvo et al. [2001] for a detailed discussion). In contrast, the profiles of concentration and accumu- lation rates of alkenones display a different pattern dominated by a precessional cyclicity [IS'llanueva et al., 1998a, 1998b]. Moreover, none of the alkenone peaks did coincide with any detectable increase in the abundance of the n-alkanes. Accordingly, diagenesis alone cannot account for the large differences observed in the downcore profiles of alkenones and n-alkanes, which have similar diagenetic stability but a different origin.
On the other hand, there is no evidence for changing sedimentary conditions associated with the alkenone peaks. For example, sedimentation rates in both cores are relatively uniform over the whole sedimentary column (Figure 3), and there is no hint of high sedimentation rates during the alkenone peaks. The possibility of changing bottom redox conditions in the North Atlantic Ocean linked to a precessional forcing is highly unlikely. Other studies have found evidence of a precessional control on surface processes in this oceanographic region [Bout- Roumazeilles et al., 1997; Imbrie et al., 1989]. Imbrie et al.
[1989] described a precessional control in the sea surface temperature (SST) evolution in core V3097 (41 øN) and hypothe- sized a direct link between low-latitude processes and surface or atmospheric processes in this region. In this sense, the alkenone
accumulation rate in core SU90/08 has been correlated with
surface processes of low-latitude areas typically dominated by a strong precessional forcing, such as the trade wind intensity in the equatorial Atlantic [lfillanueva et al., 1998b]. Accordingly, the precessional forcing in the alkenone signal observed in cores MD952037 and SU90/08 reflects the temporal variability in surface productivity.
5. Discussion
By considering core SU90/08 by its own, IS'llanueva et al. [1998b] concluded that productivity changes in the central North Atlantic were precessionally related. The incorporation of the new alkenone profile of core MD952037 provides a unique opportunity to further understand the causes and mechanisms of this preces- sional control. Clear similarities between the pulsating behaviors of both cores as well as between the alkenone magnitudes of individ- ual productivity peaks are evident, thus confirming a similar response to the climatic system in both records. However, a detailed comparison of both alkenone records indicates several discrepan- cies in the timing of some of the alkenone maxima. Clear examples of this situation are the productivity event at •130 kyr B.P. observed only in core MD952037 and the peaks recorded at 260 and 50 kyr B.P., only present at core SU90/08 (Figure 3). These examples represent periods when productivity estimations were higher in the southern location and periods when this trend was reversed, respectively. According to the alkenone records, produc- tivity decreased northward at 10, 65, 130, 145, and 190 kyr B.P., a situation opposed to the general trend observed in the modem ocean. In order to explain this in principle unexpected result, we have examined the spatial distribution of productivity in the modem ocean. Satellite-derived productivity maps of the North Atlantic reveal the occurrence of a high-productivity latitudinal band cen-
tered at '50øN [Antoine,
1996] (Figures
la and lb). From 45 ø to
55øN there is a clear decreasing trend northward that is related to the existence of this area of high productivity. We, suggest that the past episodes of reversed latitudinal gradient could be explained by the displacement of the productivity band south of 43øN, causing higher productivity estimates at 37øN. Accordingly, we suggest that the productivity band observed in the modem ocean existed in the past and that its latitudinal position changed over time.
This hypothesis is able to account for the main features observed in the alkenone data. The first feature is the pulsating character of the alkenone profiles in both cores can be explained by the latitudinal displacement of this productivity band. High-productiv- ity events are related to the passage of this latitudinal band over the core location, and low-productivity periods are recorded during the absence of this band at the given latitude. The second feature successfully explained by this hypothesis is the asynchrony observed in some productivity events at different latitudes. 5.1. Description of the Productivity Band Model
In order to illustrate and evaluate this hypothesis, a simple conceptual model has been constructed that assumes a latitudinal productivity band that moves northward and southward over time. The model has been designed to reconstruct the temporal changes of productivity at one given latitude, which are caused by the move- ment of the productivity band. In this case the productivity varia- tions at 37 ø and 43øN computed by the model have been compared to the alkenone data in cores MD952037 and SU90/08, respectively.
The simplest method for modeling the occurrence of a produc- tivity band similar to that observed in the modem North Atlantic is by describing it as a Gaussian function:
Pi -- e
-«F2(Li-Lx)2
(1)
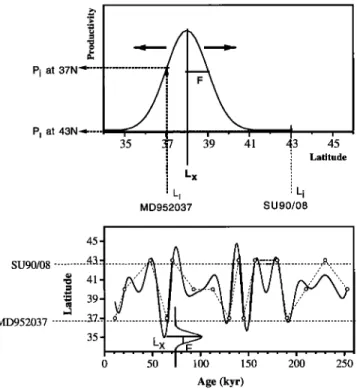
where Pi are the calculated productivity values at a given latitude Li, F is related to the amplitude of the Gaussian function and thus to the productivity band (Figure 6a), and Lx represents the latitude coordinate of the maximum of the Gaussian curve (approximately the productivity band) at a given time. We used a value of F = 2 (representing 4o-6 ø in latitude) as a realistic amplitude of the productivity band, according to the satellite-derived primary production values for present times (Figure lb). The movement of the productivity band over time has been traced by using the
624 VILLANUEVA ET AL.' A LATITUDINAL PRODUCTIVITY BAND 35 2U ! 39 41 43 . 5 ] i Latitude ß Pi at 37N • ... Pi at 43N• ... l • Lx : L i Li MD952037 SU90/08 45- SU90/08 ... .43..-. ,• 41- m 39- MD952037 ... 35- 100 150 200 250 Age (kyr)
Figure 6. Description of the productivity band model. The top panel depicts the Gaussian curve used to represent the productivity band (see equation (1) for a description of the parameters). In this situation, high productivity values would be observed in the location of core MD952037, whereas core SU90/08 would record very low values (dashed arrows). Solid thick arrows represent the latitudinal displacement of the productivity band. The bottom panel shows the proposed trajectory followed by the band over time. Circles represent all selected snapshots, dashed line represents the staircased pathway, and the solid line represents the trajectory after filtering by a 23-kyr filter (see text).
following procedure. First, the periods where the productivity band overpassed the latitudes 43 ø and 37øN were determined by locating
the alkenone maxima in cores SU90/08 and MD952037, respectively. In the cases where the alkenone maxima were synchronous at both locations, we assumed that the productivity band was located between 37 ø and 43øN, and a latitude of 40øN was arbitrarily chosen. The selected list of known positions of the productivity band is represented in Figure 6 (bottom) as circles. In order to obtain a continuous trajectory of the productivity band, we interpolated the staircased pathway every 1 kyr, and the resulting trajectory was smoothed by using a band-pass Gaussian filter. The best fitting to all known band locations was obtained by using a filter centered at 23 kyr. Tests performed after filtering at 41 and 100 kyr gave poor results. This finding is not surprising, since the alkenone records show a marked response to the precessional 23- kyr cyclicity.
5.2. Modeled Productivity at Both Locations
A comparison of the productivity reconstructed by the model at
37 ø and 43øN with the alkenone records in cores MD952037 and
SU90/08 is shown in Figure 7. By using this simple conceptual model, several of the main features observed in the alkenone profiles have been simulated successfully. First, the pulsating character of the productivity events is explained by assuming a latitudinal motion of the productivity band. Second, the model is able to reconstruct the asynchrony of the productivity events observed at the two sites. Third, the model reproduces the bimodal
pattern of some of the productivity events. The model computes such a peculiar feature every time that after migration from one core latitude to the other, the productivity band slightly overpasses the core location. A clear example of this situation is the maximum observed around 140 kyr in core SU90/08 (Figure 6, bottom, and Figure 7). In contrast, the finding of synchronous alkenone events at both locations implies the occurrence of periods of a general increase of productivity between 37 ø and 43øN. Within the context of the proposed model, these particular events can be explained by assuming a band wide enough to comprise both latitudes at the same time. Such a possibility has not been considered in this model, and therefore it is not able to reconstruct these features (see the period between 90 and 120 kyr B.P. in Figure 7). In the context of the hypothesis proposed here, the periods of increased produc- tivity at both locations can be explained by assuming an increase in the geographical extent of the productivity band. Accordingly, in our mathematical model those discrepancies could be solved by assuming a variable width of the productivity band ("F" of the Gaussian function).
Thus the main features of the alkenone records have been
reconstructed by using an extremely simple mathematical model, providing further support to the hypothesis of a moving produc- tivity band as a control of productivity changes in the past. However, this raises the question on the causes and mechanisms governing the temporal evolution of this productivity band. Remarkably, the alkenone profiles in cores SU90/08 and MD952037 do not follow a glacial-interglacial pattern. Conse- quently, the controls on productivity are independent of the global climatic changes. This result is unexpected since the evolution of the water masses in the North Atlantic is linked to the growth and decay oft he northern ice sheets [CLIMAP, 1976]. For example, the polar front migrated as far south as 43øN during the last glacial period, involving a transition from intermediate to polar conditions at the location of core SU90/08. In contrast, the alkenone records at both locations show a strong response to the precessional orbital forcing and suggest that the controls on the latitudinal evolution of the productivity band are related to low-latitude processes. •lla- nueva et al. [1998b] correlated the periods of increased productiv- ity in the North Atlantic with enhanced trade wind intensity in the equatorial Atlantic. This temporal coincidence suggested the idea that productivity in the North Atlantic could be modulated by the strength of the westerlies, and it proposed the idea of a coupling in the dynamics of the Ferrell and Hadley cells. However, this simple explanation does not explain successfully the observed asynchro-
nies observed between 37 ø and 43øN and cannot account for the
hypothesis of a moving productivity band. The understanding of the mechanisms controlling the history of this paleoproductivity band in the past requires a better knowledge of the causes of its
existence in the modem ocean.
6. Conclusions
The paleoproductivity history of the central North Atlantic has been studied by means of the alkenone abundances along two sediment cores located at 43øN and 37øN. A simple visual inspec- tion of the alkenone records has revealed that discrete events of high productivity dominated the temporal productivity evolution. The timing of the productivity peaks in the northern location presented a strong response to the precessional cycle. Such a precessional control is not so evident at the 37øN site, where spectral analysis suggests a response to both the obliquity and the precessional cycles. On the other hand, a detailed comparison of the productivity peaks in the two records has revealed some slight but significant discrepancies in the timing of the productivity events at the two latitudes. We suggest that this asynchrony can be explained by a latitudinal productivity band that migrated northward and south- ward over time. Satellite-derived productivity estimates indeed
VILLANUEVA ET AL.' A LATITUDINAL PRODUCTIVITY BAND 625 3000- 2000- . 1000 _ . - , . i .
43 ø N
2000
!ooo
0 0 50 100 .:
37 ø N
. i 150 200 250Age (kyrs)
Figure 7. Modeled productivity at sites SU90/08 and MD952037. Comparison of the reconstructed paleopro- ductivity (solid thick line) to the alkenone-derived productivity records (shaded area) for each location. Numbers above the plot refer to the oxygen isotopic stages, and vertical dashed lines refer to the transition between them.
show the existence of a productivity band in the modem North Atlantic between 45 ø and 55øN. We have illustrated our hypothesis by modeling the latitudinal movement of this band over time. Both the timing of the productivity events at the two locations and their bimodal pattern have been reconstructed using this conceptual model. The relevance of the precessional forcing in the alkenone records suggests that the mechanism controlling the migration of this productivity band is controlled by low-latitude processes.
Acknowledgments. Thanks are due to the French MENRT, TAAF, CNRS/INSU, and IFRTP for support to the Marion Dufresne and the IMAGES program. C. P. and J. V. thank a Ph.D. grant and a postdoctoral contract from C.I.R.I.T (Generalitat de Catalunya), respectively. Financial support from the TEMPUS EU project (ENV4-CT97-0564) is acknowl- edged. We are grateful to David Antoine (Laboratoire de Physique et Chimie Marines, Villefranche-sur-Mer, France) and to Ramon Crehuet (C.I.D.-C.S.I.C., Barcelona, Spain) for useful comments and for computer assistance, respectively.
References
Antoine, D., and A. Morel, Oceanic primary production, 1, Adaptation of a spectral light-photosynthesis model in view of appli- cation to satellite chlorophyll observations, Global Biogeochem. Cycles, 10(1), 43-55,
1996.
Antoine, D., J. M. Andrb, and A. Morel, Oceanic
primary production, 2, Estimation at global scale from satellite (coastal zone color scanner) chlorophyll, Global Biogeochem. Cycles, 10(1), 57-69, 1996.
Bout-Roumazeilles, V., P. Debrabant, L. Labeyrie, H. Chamley, and E. Cortijo, Latitudinal control of astronomical forcing parameters on the high-
resolution clay mineral distribution in the 45 ø- 60øN range in the North Atlantic Ocean during the past 300,000 years, Paleoceanography,
12(5), 671-686, 1997.
Brassell, S.C., Applications of biomarkers for
delineating marine paleoclimatic fluctuations during the Pleistocene, in Organic Geochem-
626 VILLANUEVA ET AL.: A LATITUDINAL PRODUCTIVITY BAND
istry: Principles and Applications, edited by M. H. Engel and S. A. Macko, pp. 699-738,
Plenum, New York, 1993.
Brassell, S. C., G. Eglinton, I. T. Marlowe, U. Pflaumann, and M. Samthein, Molecular stra-
tigraphy: A new tool for climatic assessment,
Nature, 320, 129-133, 1986.
Calvo, E., J. Villanueva, J. O. Grimalt, A. Boe-
laert, and L. Labeyrie, New insights into the glacial latitudinal temperature gradients in the
North Atlantic: Results from UK'37 sea
surface temperatures and terrigenous inputs,
Earth Planet. Sci. Lett., 188, 509-519, 2001.
CLIMAP, The surface of the ice-age Earth,
Science, 191, 1131-1137, 1976.
Conte, M. H., A. Thompson, G. Eglinton, and J. C. Green, Lipid biomarker diversity in the coccolithophorid Emiliania huxleyi (Prymne- siophyceae) and the related species Gephyro-
capsa oceanica, J. Phycol., 31, 272-282, 1995.
Cortijo, E., et al., Changes in sea surface hy- drology associated with Heinrich event 4 in
the North Atlantic Ocean between 40øand
60øN, Earth Planet. Sci. Lett., 146, 29-45,
1997.
Elliot, M., L. Labeyrie, G. Bond, E. Cortijo, J.-L.
Turon, N. Tisnerat, and J.-C. Duplessy, Millen-
ial-scale iceberg discharges in the Irminger Ba- sin during the last glacial period: Relationship
with the Heinrich events and environmental
settings, Paleoceanography, •3(5), 433-446,
1998.
Grousset, F., L. Labeyrie, J. Sinko, G. Bond, J.
Duprat, M. Cremer, and S. Huon, Patterns of
ice rafted detritus in the Glacial North Atlantic
(40-55øN), Paleoceanography, 8(2), 175-
192, 1993.
Imbrie, J., J. D. Hays, D. G. Martinson, A. Mcin-
tyre, A. C. Mix, J. J. Morley, N. G. Pisias, W.
L. Prell, and N.J. Shackleton, The orbital the-
ory of Pleistocene climate: Support from a re- •8
vised chronology of the marine d O record, in Milankovitch and Climate.' Part 1, edited by A. L. Berger et al., pp. 269-305, D. Reidel,
Norwell, Mass., 1984.
Imbrie, J., A. Mcintyre, and A. Mix, Oceanic response to orbital forcing in the late Quatern- ary: Observational and experimental strategies, in Climate and Geosciences, edited by A. Ber- ger, S. Schneider, and J.-C. Duplessy, NATO
ASI Set., 285, 121 - 164, 1989.
Laskar, J., The chaotic motion of the solar sys-
tem: A numerical estimate of the chaotic
zones, Icarus, 88, 266-291, 1990.
Madureira, L. A. S., S. A. van Kreveld, G. Eglin- ton, M. H. Conte, G. Ganssen, J. E. van Hinte,
and J. J. Ottens, Late Quaternary high-resolu- tion biomarker and other sedimentary climate proxies in a northeast Atlantic core, Paleocea-
nography, •2(2), 255-269, 1997.
Manighetti, B., and I. N. McCave, Depositional fluxes, palaeoproductivity, and ice rafting in the NE Atlantic over the past 30 ka, Paleocea- nography, •0(3), 579-592, 1995.
Marlowe, I. T., J. C. Green, A. C. Neal, S.
C. Brassell, G. Eglinton, and P. A. Course, Long chain (n-C37-C39) alkenones in the Prymnesiophyceae: Distribution of alke- nones and other lipids and their taxonomic significance, Br. Phycol. J., 19, 203-216,
1984.
Marlowe, I. T., S. C. Brassell, G. Eglinton, and J. C. Green, Long-chain alkenones and alkyl al-
kenoates and the fossil coccolith record of
marine sediments, Chem. Geol., 88, 349- 375, 1990.
Martinson, D. G., N. G. Pisias, J. D. Hays, J. J.
Imbrie, T. C. Moore, and N.J. Shackleton,
Age dating and the orbital theory of the ice ages: Development of a high-resolution 0 to 300,000 year chronostratigraphy, Quat. Res.,
27, 1-29, 1987.
Morel, A., D. Antoine, M. Babin, and Y. Dan-
donneau, Measured and modeled primary pro-
duction in the northeast Atlantic (EUMELI JGOFS program): The impact of natural varia-
tions in photosynthetic parameters on model predictive skill, Deep Sea Res., Part I, 43(8),
1273-1304, 1996.
M/filler, P. J., M. Cepek, G. Ruhland, and R. Schneider, Alkenone and coccolithophorid species changes in late Quaternary sediments
from the Walvis Ridge: Implications for the
alkenone paleotemperature method, Palaeo-
geogr. Palaeoclimatol. Palaeoecol., 135, 71- 96, 1997.
Paillard, D., L. Labeyrie, and P. Yiou, Macintosh program performs time-series analysis, Eos
Trans. AGU, 7, 379, 1996.
Petit, J. R., et al., Climate and atmospheric his- tory of the past 420,000 years from the Vostok
ice core, Antarctica, Nature, 399, 429-436, 1999.
Platt, T., S. Sathyendranath, and A. Longhurst, Remote sensing of primary production in the
ocean: Promise and fulfilment, Philos. Trans. R. Soc. London., Set. B, 348, 191-202,
1995.
Prahl, F. G., L. A. Muehlhausen, and D. L.
Zahnle, Further evaluation of long-chain alke- nones as indicators of palaoceanographic con-
ditions, Geochim. Cosmochim. Acta, 52, 2303-2310, 1988.
Prahl, F. G., L. A. Muehlhausen, and M. Lyle, An organic geochemical assessment of ocea- nographic conditions at MANOP Site C over the past 26,000 years, Paleoceanography, 4(5),
495-510, 1989.
Rosell-Mel•, A., Long-chain alkenone and alkyl
alkenoate, and total pigment abundances as
climatic proxy-indicators in the northeastern Atlantic: Analytical methods, calibration, and stratigraphy, Ph.D. thesis, Univ. of Bristol, Bristol, England, 164 pp., 1994.
Rostek, F., E. Bard, L. Beaufort, C. Sonzogni,
and G. Ganssen, Sea surface temperature and
productivity records for the past 240 kyr in the Arabian Sea, Deep Sea Res., Part II, 44(6-7),
1461-1480, 1997.
Ruddiman, W. F., Late Quaternary deposition of ice-rafted sand in the subpolar North Atlantic (lat 40 to 60 N), Geol. Soc. Am. Bull., 88,
1813-1827, 1977.
Ruddiman, W. F., and A. Mcintyre, Northeast
Atlantic paleoclimatic changes over the past
600,000 years, Mem. Geol. Soc. Am., 145, 111 - 146, 1976.
Sancetta, C., Primary production in the glacial
North Atlantic and North Pacific oceans, Nat- ure, 360, 249-250, 1992.
Schubert, C. J., J. Villanueva, S. E. Calvert, G. L. Cowie, U. von Rad, H. Schulz, and U. Bemer,
Stable phytoplankton community in the Ara-
bian Sea over the last 200,000 years, Nature, 394(6), 563-566, 1998.
Shimmield, G. B., T D. Brand, and G. Ritchie,
The benthic geochemical record of late Holo-
cene carbon flux in the northeast Atlantic, in
The Role of the North Atlantic in the Global
Carbon Cycle, edited by G. Eglinton et al., Philos. Trans. R. Soc. London, Set. B, 348,
153-160, 1995.
Sicre, M.-A., Y. Temois, M. Pateme, A. Boireau, L. Beaufort, P. Martinez, and P. Bertrand,
Biomarker stratigraphic records over the last 150 kyears off the NW African coast at 25øN, Org. Geochem., 31, 577-588, 2000. Stein, R., Accumulation of organic carbon in
marine sediments, Lect. Notes Earth Sci., 34, 217 pp., 1991.
Stein, R., and R. Stax, Late Quaternary organic carbon cycles and paleoproductivity in the
Labrador Sea, Geo Mar. Lett., 11, 90-95, 1991.
Thomas, E., L. Booth, M. Maslin, and N.J. Shackleton, Northeastern Atlantic benthic for-
aminifera during the last 45,000 years: Changes in productivity seen from the bottom up, Paleoceanography, •0(3), 545-562, 1995.
Vidal, L., L. Labeyrie, E. Cortijo, M. Arnold, J.
C. Duplessy, E. Michel, S. Becqu•, and T C. E. van Weering, Evidence for changes in the North Atlantic Deep Water linked to meltwater surges during the Heinrich events, Earth Pla-
net. Sci. Lett., 146, 13-27, 1997.
Villanueva, J., J. O. Grimalt, E. Cortijo, L. Vidal,
and L. Labeyrie, A biomarker approach to the organic matter deposited in the North Atlantic during the Last Climatic Cycle, Geochim. Cos- mochim. Acta, 61(21), 4633-4646, 1997a.
Villanueva, J., C. Pelejero, and J. O. Grimalt,
Clean-up procedures for the unbiassed estima- tion of C37-C39 alkenones sea surface tempera- tures and terrigenous n-alkane inputs in paleoceanography, J. Chromatogr., 757,
145-151, 1997b.
Villanueva, J., J. O. Grimalt, E. Cortijo, L. Vidal,
and L. Labeyrie, Assessment of sea surface temperature variations in the central North Atlantic using the alkenone unsaturation index (Uk'37), Geochim. Cosmochim. Acta, 62(14),
2421-2427, 1998a.
Villanueva, J., J. O. Grimalt, L. D. Labeyrie, E. Cortijo, L. Vidal, and J.-L. Turon, Precessional forcing of productivity in the North Atlantic Ocean, Paleoceanography, •3(6), 561-571,
1998b.
Weeks, A. E. A., The physical and chemical en- vironment and changes in community structure
associated with bloom evolution: The Joint
Global Flux Study North Atlantic Bloom Ex-
periment, Deep Sea Res., Part II, 40, 347- 368, 1993.
A. Boelaert and L. Labeyrie, Laboratoire des
Sciences du Climat et de l'Environnement, Domaine du CNRS, Av. De la Terrasse, 91191 Gif-sur-Ivette, Cedes, France.
E. Calvo, J. O. Grimalt, C. Pelejero, and J.
Villanueva, Institute of Chemical and Environ-
mental Research, Consejo Superior de Investi- gaciones Cientificas, Jordi Girona, 18, 08024 Barcelona, Catalonia, Spain. (jvrqam•cid.
csic.es)
(Received May 19, 2000;
revised May 2, 2001; accepted May 25, 2001.)