HAL Id: hal-02987552
https://hal.archives-ouvertes.fr/hal-02987552
Submitted on 10 Nov 2020HAL is a multi-disciplinary open access archive for the deposit and dissemination of sci-entific research documents, whether they are pub-lished or not. The documents may come from teaching and research institutions in France or abroad, or from public or private research centers.
L’archive ouverte pluridisciplinaire HAL, est destinée au dépôt et à la diffusion de documents scientifiques de niveau recherche, publiés ou non, émanant des établissements d’enseignement et de recherche français ou étrangers, des laboratoires publics ou privés.
confined in porous glass
R. Neffati, P. Judeinstein, J. Rault
To cite this version:
R. Neffati, P. Judeinstein, J. Rault. Freezing, melting and dynamics of supercooled water confined in porous glass. Journal of Physics: Condensed Matter, IOP Publishing, 2020, 32 (46), pp.465101. �10.1088/1361-648X/abaddd�. �hal-02987552�
Freezing, mel0ng and dynamics of supercooled
water confined in porous glass
R. Neffa01,4, P. Judeinstein2,3 and J. Rault2
1 Department of Physics, King Khalid University P. Box 9032, Abha 61413 - Kingdom of Saudi Arabia. 2 Université Paris-Saclay, CNRS, Laboratoire de Physique des Solides, 91405, Orsay, France.
3 Université Paris-Saclay, CNRS, CEA, Laboratoire Léon Brillouin, 91191, Gif-sur-Yvette, France 4 IPEIN, University of Carthage, Campus of El Mrazga, P. Box 62, Nabeul 8000, Tunisia
E-mail: riadhneffati@gmail.com , ryad@kku.edu.sa
Received xxxxxx
Accepted for publication xxxxxx Published xxxxxx
Abstract
The freezing, melting and dynamics of supercooled water at different hydration of controlled porous glass (CPG) with mean pore sizes 10 nm, 30 nm, 50 nm and 70 nm are studied using differential scanning calorimetry (DSC) and deuteruim nuclear magnetic resonance (2H-NMR). For saturated
samples, the melting tempertaure follows the Gibbs-Thomson relation despite a clear linear decrease of the melting enthalpy when the transition is shifted due to confinement. For partially filled porous glasses the crystalization and melting temperatures as well as enthalpy are lower than for the saturated samples.
2H-NMR confirms the existence of a non-crystallizable part of water adsorbed on the surface of pores.
At room temperature, spin-lattice relaxation rate (1/T1) is proportional to the inverse of the mean pore
size indicating that the relaxation is governed by a surface limited process. At low tempertaure relaxation rate follows the Vogel-Fulcher-Tammann (VFT) relation.
1. Introduc0on
Confinement of liquids in porous media, has notable effects on their thermodynamic transitions [1-6] as well as on their dynamics and glass transition temperature [7-15]. Particularly, the freezing and melting of liquids in confined situations was subject of many investigations [16-21]. Confined water took special attention [21-24] mainly because of its importance in biological systems [24] , food and geology [25] but also because of the abnormal behavior of water [22, 26-30]. In fact, Near the melting point bulk water is considered as the most fragile liquid but around its glass transition it is one of the strongest liquids [31]. Hence confinement allows to supercool water and study its dynamics in the so called “No-Man’s Land” region (150−235 K) where one could observe (high-density liquid) HDL - LDL (low density liquid) corresponding to a transition fragile - strong transition. Although avoiding crystallization is one of the main goal of the community working on supercooled liquids and glass transition, another active research community seeks the study of porous media through the investigation of effects of confinement on phases transitions and liquid dynamics [32, 33]. So the focus could be on the hosting porous material and how it affects both the phase transitions and the dynamic of an imbedded liquid. The main output of decades of active research in the field of confined liquids could be recapitulated as following:
1) One measures a shifting of the melting point to low temperatures in most of the studied cases. The
shift (ΔTm) of the melting point is inversely proportional to the average radius r of the pores and follows
the classic Thomson-Gibbs [1] relation:
(a) ; ⇔ (b) (
where is the melting temperature of an infinite crystal in contact with its pure liquid and its melting enthalpy. The Gibbs-Thomson length is defined by and has as order of magnitude a molecular size. is the surface tension of the solid-liquid interface and v is
0 0 0 2 sl m 1 m m m m vT T T T r H γ Δ = − = ⋅ Δ 0 0 2 m m GT m m T T a t d T − = = 0 273.15 k m T = 0 334 j/g m H Δ = aGT =2γSl /
(
ΔHm0 /v)
sl γthe specific volume of the crystalline phase.The only problem with Gibbs-Thomson relation, is that in all “thermodynamic proof” of such relation we assume always constant melting enthalpy when shifting the melting temperature due to the finite size effect of the crystalline phase! This assumption is often clearly contradicted by experimental facts [1, 3, 19-21].
2) The melting enthalpy is reduced by confining. The relative decrease is also proportional to the
reduced shift as pointed out in previous work [3]. Replacing the reduced shift from Gibb-Thomson relation (1b) inside equation (2a) one could find out the dependence of the melting enthalpy with the crystal size:
(a) ⇔ (b) (
where is a typical size at which . Such dependence of the melting enthalpy with crystal size was already found experimentally [1, 34]. It is worth mentioning, that expressions 2a and 2b are deduced from experiments and needs theoretical justification.
3) A non-crystallisable part of the liquid (in the case of liquid wetting the pore’s surface), this is often presented as an experimental fact and never a predictable part from a rigorous theoretical treatment. Intuitively, we know that an amount of the liquid adsorbed on the surface has lowered their chemical potential so that they do not need to reach a crystalline state as one cools down.
4) Broadening of DSC peaks, could be often linked to the pore size distribution this was at the origin of developing thermoporosimetry [2, 35, 36]. However, even for well-defined pores size glasses as MCM-41 [37] one notice also a broadening.
The dynamics of liquids in confined situation was studied by different experimental techniques however NMR remains a powerful tool for following the behavior of confined liquids [32, 33, 38, 39]. For a two phases system (here adsorbed and free water) and under the fast-exchange condition [39, 40],
0 * 1 m . m m m t H H t ⎛ ⎞ Δ = Δ ⋅⎜⎜ − ⎟⎟ ⎝ ⎠
(
)
0 * ( ) 1 / m m H d H d d Δ = Δ ⋅ − * 2 / * GT m d = a t ΔH dm( ) 0* =on measures average relaxation rates for transverse (i=2 : spin-spin) , or longitudinal (i=1 : spin-lattice) nuclear magnetization given by [39]:
(
where d is the mean pore diameter, α a shape factor which is respectively 1,2,3 for planar, cylindrical or spherical pore and D the self-diffusion coefficient of the confined liquid. is the surface relaxivity where x is a typical thickness of the molecular layer having as relaxation rate. One can distinguish two limiting regimes diffusion-limited (DL) or surface-limited (SL) depending on whether respectively or in each case the relaxation rate is given by :
(DL) : (SL) : (
In this paper we report DSC and 2H-NMR studies of the freezing and melting of confined water in
controlled porous glasses with pore size 10 nm, 30 nm, 50 nm and 70 nm but having the same pore volume and specific surface so that effects could be correlated directly to the confining size. In addition, the effect of the hydration rate on DSC curves and 2H-NMR spin-lattice relaxation rate is presented. The
dynamics of the non-freezable fraction (supercooled water) was studies at different temperature and hydration through the spin-lattice relaxation time.
2. Experimental
Controlled porous glass (CPG) from Schott - Germany was used in this work. These porous glasses have the same pore volume V=0,8 cm3/g and specific surface S=225 m2/g but different average pore size
10 nm, 30 nm, 50 nm and 70 nm as estimated by Brunauer-Emmett-Teller (BET) analysis [41] of the N2
adsorption isotherms. Such porous glasses powder consists of 30 µm to 60 µm porous particles with very narrow pore size distribution. Due to the high specific surface of these porous particles, the area of
1 / i i R = T
( )
bulk s 1 2 / / 4 s d R d R R R d D α = + ⋅ + ⋅ , / s i s R =x T , 1 /Ti s 4 /D d!Rs 4 /D d!Rs( )
2 8 bulk D R d R d α + !( )
bulk s 2 / R d !R +R ⋅ α dthe outer surface is less than 1% of the inner surface. These glasses are obtained from borosilicate glass after a spinodal decomposition and acid etching of the boron rich phase. The obtained pores are in principal interconnected and form a network and could be considered locally as cylindrical [42].
Samples for thermo-analysis were prepared directly in aluminum pans by putting first the porous glass powder then the right amount of distilled and degassed water. The mass of the dry powder and then the total mass of hydrated samples was measured using a high precision Mettler Balance. The DSC pans were hermetically closed to avoid evaporation then kept at room temperature for few days for equilibration. NMR samples were directly prepared in glass tubes and sealed in order to avoid evaporation and kept at room temperature for one week before NMR measurements. We used high purity deuterated water D2O in order to perform 2H-NMR measurements. The content in water is given
its concentration by weight w or the degree of hydration h which are related and given by the following relations:
(a) ; (b) (
where mw is the mass of water in the sample and m0 is the mass of the dry porous silica. DSC curves
are recorded using a DSC30 Mettler with TA3000 processing unit. The analysis of DSC curves was done using the Mettler software. After standard calibration, different scanning rate was performed first on distilled and degasified water. The cooling/heating rate ±5 °C/min is then used to have acceptable signal/ noise ratio.
NMR experiments was performed using a Bruker NMR spectrometer with static magnetic field , equipped with a 5 mm broad band probe used without frequency lock control. The Larmor frequency was = 38.376 MHz. Temperaure control was performed with a BVT2000 unit and calibrated using standard methods (ethylene glycol reference tube) from 190 K to 300 K. After
0 1 w w m h w m m h = = + + w/ 0 1 w h m m w = = − 0 5.87 T B = 0 0 / 2 ν =ω π
evaluating the pulse width (PW~15.5 µs) corresponding to an angle 90°, we acquired a free induction decay (FID). The Fourier transformation of the FID gives a very simple 2H-NMR Spectra composed of
one broad line as reported in previous works [3]. The spin-lattice T1 relaxation time was measured by
mean of the inverse recovery method (180°-τ-90°) [43]. Measurements for different heavy water content of the intensity and linewidth as well as the spin-lattice relaxation time was performed at different temperatures from 190 K to 300 K. For N spins I, the equilibrium longitudinal magnetization in the presence of a longitudinal fixed magnetic field , at a temperature T, is given by Curie law [43]:
(
Since we’re using a liquid NMR spectrometer the solid signal vanishes already in the time delay (about 2s) before starting acquisition of a FID. So only the signal from liquid parts in the system are acquired. Consequently, the slope of the curve intensity versus 1/T is proportional to the quantity of liquid in system, this fact was used in the NMR cryoporosimetry methods [44].
3. Results and discussion
Typical DSC curves of water crystallization and ice melting of the 10 nm porous silica powder at different hydration are presented respectively in figure 1a and 1b. the cooling/heating rates for all curves is ± 5 °C/min. Note that the lower the hydration is the more shifted to lower temperature are the curves of both crystallization and melting. The broadening of DSC curves of pure water at different scanning rates (0.5 °C/min, 2 °C/min, 5 °C/min and 10 °C/min) was done and extrapolates to zero while in the case of confined water in porous media it never extrapolates to zero. This could be an indication that broadening of DSC curves in the case of confined water is due to the pore size distribution in addition to
0 0/ D B =ω γ T k I I N M B z 3 ) 1 ( . ~ ω02⋅ +
the scanning rate enlargement. This fact, was at the origin of developing thermoprosimetry [35, 36], and was also applied to estimate the fractal aspect of size distribution in porous glass [2].
At lower hydration ratio, DSC curves seems to be a part of those with higher hydration. This could be an experimental clue that at lower hydration pores with smaller sizes are filled. Furthermore, the aspect of crystallization curves is different from that of melting at the same hydration. In fact, the starting of crystallization curves is abrupt which could be a signature of pore interconnection. In fact, as soon as the first germs of Ice crystals appears, crystallization spread through the pore network. Operating annealing on the crystallization zone gives always the same melting curve which is another experimental proof that pores are interconnected. This was not the case of droplets in butyl rubber where fractionation of crystallization curve by annealing at different temperature gave different melting curves [36].
FIGURE 1. DSC curves (heat flow JQ versus temperature T) of water crystallization (a) and ice melting (b) at different
hydration inside CPG porous glass with pore mean size 10 nm. The water content in wt-% is indicated on the corresponding curve. The scanning rate is ± 5 °C/min. For the sake of clarity, these curves are vertically translated.
Melting is a thermodynamic transition compared to crystallization which has a kinetic aspect (nucleation followed by growth). As one heats up, crystals with smaller sizes melt first as predicted by Gibbs-Thomson relation. In other words, the temperature scale in DSC curves of melting processes, could by translated into a size scale according to equation (1b). Obviously, the starting of the melting is
progressive and not abrupt as the crystallization curves, this is directly linked to the size distribution of the melting crystals and consequently to the filled pore size distribution. During the partial filling of pores the water vapor condenses first in pores with smaller sizes according to Kelvin relation about gas adsorption and capillary condensation insides porous media [41]. Consequently, since at lower hydration pores with lower sizes are filled, one observes a shift to lower temperature for the whole DSC curves.
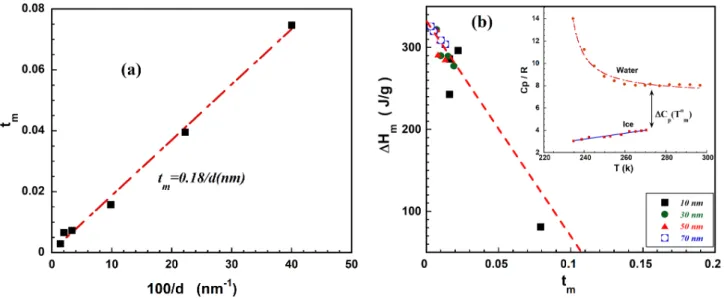
Figure 2a depicts the reduced shift of the melting point defined as for the saturated
samples against 100/d where d is the mean pore diameter. As predicted by Gibbs-Thomson relation (equation 1) one obtains a straight line. The slope in this curve is twice the Gibbs-Thomson length just because we used the diameter instead of the radius. Adjustment when using in addition previous published results [3] gives a slope about 0.18 nm that mean aGT~0.09 nm.
Figure 2b gives the decrease of the melting enthalpy versus the reduced shift. The fact that the melting enthalpy decreases linearly with the reduced shift of melting temperature is in a clear contradiction with the main assumption for establishing the Gibbs-Thomson relation.
(
0)
/ 0m m m m
FIGURE 2. (a) The reduced shift of the melting point , for saturated samples versus 100/d where d is
the mean pore diameter (value for Victor glass with size 2.5 nm and 5 nm are added) . (b) The melting enthalpy versus the reduced shift of the melting point for all porous glasses at four hydrations. Inset figure gives the adjusted heat capacity at constant pressure for water and ice.
The thermodynamic justification of such decrease of the melting enthalpy with the reduced shift of the melting point goes through the adoption of a model for the excess heat capacity , where (Cp)liq and (Cp)sd are respectively the heat capacity at constant pressure
for liquid and its solid. Since melting enthalpy (or entropy) are obtained by integration over temperature to :
(
Modeling the heat capacity difference between a supercooled liquid and its solid
was and still a challenge for statistical physics as pointed out by Granato [45]. One will adopt here a precise approximation for the heat capacity suggested by the inset of figure 4b : where one could find for water by adjusting data from literature [6, 22]
the following values , , and as shown in
(
0)
/ 0 m m m m t = T −T T( ) ( )
p p liq p sd C C C Δ = − p C Δ 0 0 ( ) m m T m m m p T H T H C dT Δ = Δ +∫
Δ ⋅( ) ( )
p p liq p sd C C C Δ = − 0 / ( ) p p f s C C A T T α T Δ !Δ + − + ⋅(
)
0 10.4 0.2 p C R Δ = ± ⋅ (41 7) f A !− ± ⋅R α = −0.024R 228 s T = Kthe inset of figure 2b. R is the ideal gas constant . Using such expression of ,
one finds by integrating equation 8 the following :
(
Where and the melting entropy of an infinite crystal. After expansion to the first order in tm, the melting enthalpy is found to behave as the experimental expression (2a) with:
⇔ (
In conclusion, because we need only the first order expansion of the melting enthalpy to explain the linear experimental decrease, whatever the expression we take for , the thermodynamic expression
of the temperature is always . The former estimation remain about when
considering and . In order to give better theoretical explanation to the
experimental value , we propose to take into account the non-crystalline fraction as we did in previous publication [3]. In fact, assuming that a layer of thickness x do not crystallize one has to multiply the measured enthalpy by the fraction of the crystallizable amount of water which is
1 1 1.987 . . R= Cal mol k− − p c Δ
(
)
0 0 0 1 0 0 0 ln 1 2 0 2 p f m m m m m m s m m m m m c A H t T t t t t H S T S S α Δ ⎛ ⎞ Δ − ⋅ + ⋅ ⎜ − ⎟− − Δ ! Δ Δ ⎝ ⎠ Δ(
0)
/ 0 s m s m t = T −T T 0 0 / 0 m m m S H T Δ = Δ 0 0 * 0 0 0 0 1 p f m m m m m s m c A T t S T S t S α Δ + + Δ Δ ⋅ Δ !( )
0 * 0 m m p m S t c T Δ = Δ p C Δ * m t * 0 / ( 0) m m p m t = ΔS ΔC T t*m!0.57 0 2.65 m S R Δ ! ΔC Tp( m0) 4.6! R( )
* exp 0.11 m t =, where the exponent 2 is for pores of cylindrical shape (and should be
replaced by 3 when pores are spherical). If one remembers that The resulting enthalpy is
then :
(
In such case, an expansion to the first order in gives the following expression for the temperature at
which the melting enthalpy should vanish :
(
Assuming and taking the experimental estimations and we
could deduce the thickness of the adsorbed layer from DSC . In other words, in order to
explain the experimental value one has to consider that about two layers of water molecules
does not crystallize in addition to the “thermodynamic” decrease of melting enthalpy when lowering the
(
)
2 2 2 1 2 / c tot V d x x d V d − ⎛ ⎞ =⎜ ⎟ = − ⎝ ⎠ 2 GT / m d= a t 2 0 * ( ) 1 m 1 m m m m GT m t x H T H t a t ⎛ ⎞ ⎛ ⎞ Δ Δ ⋅⎜⎜ − ⎟ ⎜⎟⋅ − ⎟ ⎝ ⎠ ⎝ ⎠ ! m t( )
* * exp 1 1 2 GT m m x a t t = + * 0.57 m t ! aGT !0.09⋅nm( )
* exp 0.11 m t ! 0.36 nm DSC x ! * 0.11 m t !melting point. The existence of such non crystalline fraction will be confirmed by NMR in the following sections.
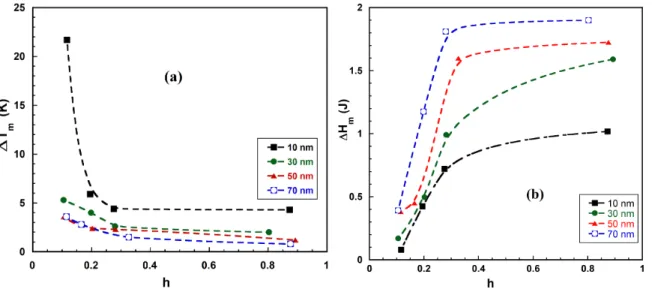
For partially filled samples, one finds as depicted in figure 3a that the shift is higher as we lower the hydration. This effect is more pronounced for the sample with lower mean pore size. One can deduce that, as we increase progressively the hydration, the condensation of water vapor took place in pores with increasing mean pore size. The melting enthalpy deduced from the melting pic integration is plotted versus the hydration rate in figure 3b. One could notice that for the same hydration, the melting enthalpy is lower as we confine more (by reducing the mean pore diameter). Obviously this effect is directly linked to lower size of pore because all porous glasses have the same pore volume and the same specific surface. In addition, this kind of curves is an experimental proof that one has essentially water inside the pores and almost no extra-pore water. In fact, when having a continuous linear increase of the surface of the peak as we add water to the sample, that reveals the existence of extra-pore water since the melting enthalpy is proportional to the added mass for bulk water.
FIGURE 3. (a) The shift of the melting point versus the degree of hydration (b) The total melting enthalpy (surface of the
2H-NMR confirms the existence of a non-crystallizable part since the liquid signal below the
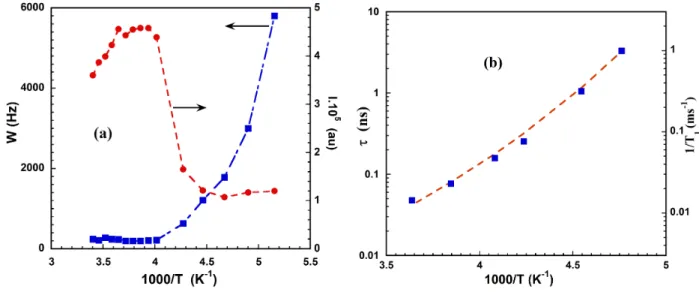
crystallization interval does not vanish (figure 4a). Starting from room temperature T=294 K, one cools down up to T=194 K. Starting from the highest, temperature the evolution of the intensity of the NMR signal follows in a first step, Curie’s law (equation 6), therefore the quantity (I×T) is proportional to the number of participating spins in the total magnetization. In a second step a sudden decrease of the intensity is associated with the crystallization of an amount of the water. Nevertheless, the NMR signal associated to the presence of liquid does not vanish even at lower accessible temperature (194 K) indicating the presence of a non-crystallizable fraction. At the same time, we could notice on the same figure 4a, that the line width starts to increase indicating a slowing down of the dynamics of this supercooled fraction.
Since pores are completely filled with water, we could imagine that this adsorbed amount of water is where fnc is the non crystalizable fraction determined from the curve I(T), V =0.8 cm3/g
and S=225 m2/g. Hence, the thickness could be estimated from NMR as . The existence
of the non crystallizable fraction is an opportunity to follow the supercoold liquids’s dynamics.
The dynamics of the supercooled part of water, is followed by the measurement of spin-lattice relaxation rate (1/T1) better than the line width which contain a contribution of field inhomogeneity in
addition to the spin-spin relaxation rate (1/T2). Figure 4b gives the variation of the spin-lattice relaxation
rate (1/T1) when changing temperature. ( / ) nc x= f ⋅ V S 0.63 NMR x ! nm
FIGURE 4. (a) Evolution of the intensity and line width of the 2H-NMR line versus 1000/T for the saturated CPG porous
glasses with mean pore size 10 nm (b) The spin-lattice relaxation rate and the corresponding correlation time versus 1000/T in fully saturated 10 nm porous glass. The dashed line is the VFT equation for D = 7,8 ; T0=120 k and τ0 = 10-14s.
In fast narrowing limit ( ), the spin lattice relaxation rate is proportional to the correlation
time of the molecular motion by [43] where is the
quadrupole coupling constant of a nucleus with spin I and a quadrupole moment eQ interacting with a local electric field gradient Vzz=eq. For heavy water the quadrupole coupling constant of deuterium with
the local electric field of the polarized O-D bond is about , so one could reports an
estimation of the correlation time on the same figure 4b. The curvature of the plot in figure 4b is given by the D coefficient in the Vogel-Fulcher-Tammann (VFT) equation : where
indicates the temperature at which the relaxation or correlation time diverges. This temperature is therefore associated with the complete freezing of the molecular motion whereas the glass transition temperature Tg corresponds to a slowdown of the molecular motion . The prefactor τ0 =
0 1 ω τ <<
(
2)
1 1 / 1 3 Q/ 16 R = T ! ω ⋅τ ω =Q e qQ2 / (2I−1) 200 kHz Q ν ! 0/( 0) 0 eDT T T τ =τ ⋅ − T0( )
102 g T s τ !0,01 ps is the phonon time scale which the correlation time when temperature goes to infinity. Often the coefficient D ranges from 5 to 100 allowing a classification of the liquids behavior respectively from fragile to strong. The best adjustment for the measured data is given when taking D = 7,8 and T0=120 K.
These values gives using the fact that [46] : an estimation of the glass transition
about 144 K. As shown in Figure 4a, NMR signal is strongly broadened with temperature decrease, restraining low temperature measurement on liquid NMR switch and prohibiting a VFT adjustment in broader temperature range.
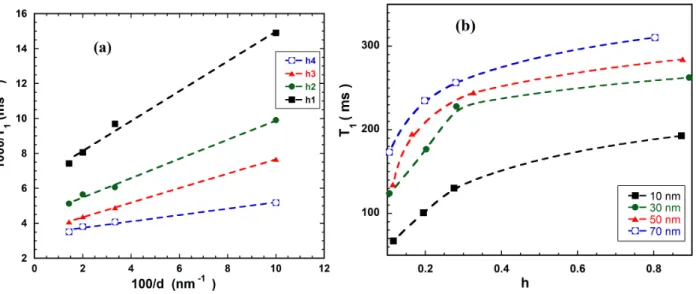
FIGURE 5. (a) 2H-NMR Spin lattice relaxation rate (1/T1) dependence with pore size at different hydration (the four
hydration for each size are indicated in figure 5b (b) 2H-NMR Spin lattice relaxation time (T1) versus the degree of hydration
h for porous glasses with mean pore size 10 nm, 30 nm, 50 nm and 70 nm but the same specific volume and surface.
Figure 5a shows the effect of confinement on water molecular dynamics. The spin lattice relaxation rate is proportional to the inverse of the mean diameter of the pores as predicted by the equation (4SL) which is obviously a clear indication that the dynamics is surface limited as one can expect. In fact, due to the possible hydrogen bonding of water molecules with surface groups insides pores one found a non-crystalline fraction of the water which dynamics is governed by the exchange between the free and bound water. As can be noted from figure 5a and equation (4SL), the surface relaxivity change with
hydration. As suggested by DSC measurements, the thickness x of the adsorbed layer seems to be independent of the confining size d. Hence the change in relaxivity (x/T1s) is related to a change of the
spin-lattice relaxation rate of the adsorbed molecules. The more the porous glass is hydrated the less is the slope in figure 5a corresponding to lower relaxation rate at the surface. This could be followed better on figure 5b depicting the overall spin lattice relaxation time at room temperature versus the hydration rate for each porous glass of a given mean pore size.
On figure 5b, we could notice for all pore sizes that, as we hydrate more the spin-lattice relaxation time increases but remain less than the bulk relaxation time (about 2500 ms). For a given hydration the variation of the relaxation rate of the longitudinal magnetization with the mean pore size is given by figure 5a which confirm the fast exchange model (equation 3) dominated by the relaxation at the surface (equation 4SL). Hence the more we add water the more the contribution of non-adsorbed water molecules at the center of the pore is higher. This is in line with DSC results since at higher hydration pores with bigger sizes (where the average relaxation time is higher) are progressively filled.
3. Conclusion
The freezing, melting and dynamics of water at different hydration ratio of porous silica (CPG) was studied by both DSC and 2H-NMR. From DSC measurements one deduce that the reduced shift of the
melting temperature tm is governed by the experimental relation 0.18/d(nm). The decrease of melting enthalpy is given experimentally by where in the case of water in
porous silica. The theoretical explanation of such experimental consequences on the melting enthalpy involves both the change of the heat capacity with temperature but also the non-freezable fraction of water. Lower hydration is associated with the filling of smaller size pores, therefore all DSC curves are shifted to lower temperature. This indicates that at low hydration, condensation took place at pores with
(
)
0 1 / *
m m m m
H H t t
lower sizes. The presence of such non-freezable fraction of water allows to study the dynamics of surface adsorbed molecules through the spin-lattice relaxation time. It is found the at room temperature the relaxation process is surface limited and that the surface relaxivity of water molecules decreases with increasing hydration. The change with temperature of the spin-lattice relaxation rate is governed by VFT the adjustment gives a glass transition of the adsorbed water about 144 k.
Acknowledgments
Dr. R. Neffati extend his appreciation to the Deanship of Scientific Research at King Khalid University for financial support through research groups program under grant number (R.G. P2/81/41). The authors, thanks the NMR team of ICMMO - University Paris-Sud/CNRS for the access to the NMR facility.
References
[1] Alcoutlabi M and McKenna G B 2005 Effects of confinement on material behaviour at the nanometre size scale J. Phys.: Condens. Matter 17 R461-R524
[2] Neffati R and Rault J 2001 Pore size distribution in porous glass: fractal dimension obtained by calorimetry The European Physical Journal B-Condensed Matter and Complex Systems 21 205-10
[3] Rault J, Neffati R and Judeinstein P 2003 Melting of ice in porous glass: why water and solvents confined in small pores do not crystallize? The European Physical Journal B-Condensed Matter and Complex Systems 36 627-37
[4] Gelb L D, Gubbins K E, Radhakrishnan R and Sliwinska-Bartkowiak M 1999 Phase separation in confined systems Rep. Prog. Phys. 62 1573–659.
[5] Zanotti J M, Judeinstein P, Dalla-Bernardina S, Creff G, Brubach J B, Roy P, Bonetti M, Ollivier J, Sakellariou D and Bellissent-Funel M C 2016 Competing coexisting phases in 2D water Sci Rep 6 25938
[6] Puibasset J, Judeinstein P and Zanotti J M 2018 Molecular simulation study of the heat capacity of metastable water between 100 and 300 K MoSim 45 462-5
[7] Richert R 2011 Dynamics of nanoconfined supercooled liquids Annu. Rev. Phys. Chem. 62 65-84 [8] Kim K, Miyazaki K and Saito S 2011 Slow dynamics, dynamic heterogeneities, and fragility of
supercooled liquids confined in random media J. Phys.: Condens. Matter 23 234123
[9] Cerveny S, Schwartz G A, Bergman R and Swenson J 2004 Glass transition and relaxation processes in supercooled water Phys. Rev. Lett. 93 245702
[10] Patkowski A, Ruths T and Fischer E W 2003 Dynamics of supercooled liquids confined to the pores of sol-gel glass: A dynamic light scattering study PhRvE 67 021501
[11] Liu L, Faraone A, Mou C, Yen C and Chen S 2004 Slow dynamics of supercooled water confined in nanoporous silica materials J. Phys.: Condens. Matter 16 S5403
[12] Lagrené K, Zanotti J M, Daoud M, Farago B and Judeinstein P 2010 Dynamical behavior of a single polymer chain under nanometric confinement The European Physical Journal Special Topics 189 231-7
[13] Gallo P, Rovere M and Chen S-H 2010 Dynamic crossover in supercooled confined water: Understanding bulk properties through confinement The Journal of Physical Chemistry Letters 1 729-33
[14] Zanotti J-M, Bellissent-Funel M-C and Chen S-H 1999 Relaxational dynamics of supercooled water in porous glass PhRvE 59 3084
[15] Bergman R and Swenson J 2000 Dynamics of supercooled water in confined geometry Nature
403 283-6
[16] Alba-Simionesco C, Coasne B, Dosseh G, Dudziak G, Gubbins K E, Radhakrishnan R and Sliwinska-Bartkowiak M 2006 Effects of confinement on freezing and melting J Phys Condens Matter 18 R15-68
[17] Christenson H K 2001 Confinement effects on freezing and melting J. Phys.: Condens. Matter
13 R95
[18] Jiang Q and Ward M D 2014 Crystallization under nanoscale confinement J Chemical Society Reviews 43 2066-79
[19] Jackson C L and McKenna G B 1990 The melting behavior of organic materials confined in porous solids The Journal of Chemical Physics 93 9002-11
[20] Mu R and Malhotra V 1991 Effects of surface and physical confinement on the phase transitions of cyclohexane in porous silica Physical Review B 44 4296
[21] Handa Y P, Zakrzewski M and Fairbridge C 1992 Effect of restricted geometries on the structure and thermodynamic properties of ice The Journal of Physical Chemistry 96 8594-9
[22] Franks F 1982 Water and Aqueous Solutions at Subzero Temperatures vol 7: Springer US)
[23] Cerveny S, Mallamace F, Swenson J, Vogel M and Xu L 2016 Confined water as model of supercooled water Chem. Rev. 116 7608-25
[24] Brovchenko I and Oleinikova A 2008 Interfacial and Confined Water: Elsevier)
[25] Zhang C and Liu Z 2018 Freezing of water confined in porous materials: role of adsorption and unfreezable threshold Acta Geotechnica 13 1203-13
[26] Angell A 2007 Thermodynamics: Highs and lows in the density of water Nature nanotechnology
2 396
[27] Levinger N 2002 Water in confinement Science 298 1722-3
[28] Nilsson A and Pettersson L G 2015 The structural origin of anomalous properties of liquid water J Nature communications 6 1-11
[29] Pettersson L G M, Henchman R H and Nilsson A 2016 Water The Most Anomalous Liquid. ACS Publications)
[30] Angell C A 2008 Insights into phases of liquid water from study of its unusual glass-forming properties Science 319 582-7
[31] Ito K, Moynihan C T and Angell C A 1999 Thermodynamic determination of fragility in liquids and a fragile-to-strong liquid transition in water Natur 398 492-5
[32] Valori A and Nicot B J P 2019 A review of 60 years of NMR wettability 60 255-63
[33] Kimmich R 2012 NMR: tomography, diffusometry, relaxometry: Springer Science & Business Media)
[34] Mei Q S and Lu K 2007 Melting and superheating of crystalline solids: From bulk to nanocrystals Progress in Materials Science (2007) 52 1175–262
[35] Brun M, Lallemand A, Quinson J-F and Eyraud C J T a 1977 A new method for the simultaneous determination of the size and shape of pores: the thermoporometry 21 59-88
[36] Neffati R, Apekis L and Rault J 1998 Size Distribution of Water Droplets in Butyl Rubber Application of DSC in thermoporosimetry Journal of thermal analysis calorimetry 54 741-52 [37] Jähnert S, Chávez F V, Schaumann G, Schreiber A, Schönhoff M and Findenegg G J P C C P
2008 Melting and freezing of water in cylindrical silica nanopores 10 6039-51
[38] Vogel M 2010 NMR studies on simple liquids in confinement The European Physical Journal Special Topics 189 47-64
[39] Korb J 2011 Nuclear magnetic relaxation of liquids in porous media NJPh 13 035016
[40] Brownstein K R and Tarr C 1979 Importance of classical diffusion in NMR studies of water in biological cells J Physical review A 19 2446
[41] Gregg S J and Sing K S W 1983 Adsorption, Surface Area and Porosity Academic Press)
[42] Levitz P, Ehret G, Sinha S and Drake J 1991 Porous Vycor glass: The microstructure as probed by electron microscopy, direct energy transfer, small-angle scattering, and molecular adsorption The Journal of chemical physics
95 6151-61
[44] Hansen E W, Schmidt R and Stöcker M 1996 Pore structure characterization of porous silica by 1H NMR using water, benzene, and cyclohexane as probe molecules The Journal of Physical Chemistry C 100 11396-401
[45] Granato A V 2002 The specific heat of simple liquids J. Non·Cryst. Solids 307–310 376–86 [46] Angell C 2002 Liquid fragility and the glass transition in water and aqueous solutions Chem.