HAL Id: halshs-02994903
https://halshs.archives-ouvertes.fr/halshs-02994903
Submitted on 8 Nov 2020
HAL is a multi-disciplinary open access archive for the deposit and dissemination of sci-entific research documents, whether they are pub-lished or not. The documents may come from teaching and research institutions in France or abroad, or from public or private research centers.
L’archive ouverte pluridisciplinaire HAL, est destinée au dépôt et à la diffusion de documents scientifiques de niveau recherche, publiés ou non, émanant des établissements d’enseignement et de recherche français ou étrangers, des laboratoires publics ou privés.
Real effects of lending-based crowdfunding platforms on
the SMEs
Olena Havrylchyk, Aref Mahdavi-Ardekani
To cite this version:
Olena Havrylchyk, Aref Mahdavi-Ardekani. Real effects of lending-based crowdfunding platforms on the SMEs. 2020. �halshs-02994903�
Documents de Travail du
Centre d’Economie de la Sorbonne
Real effects of lending-based crowdfunding platforms on the SMEs
Olena HAVRYLCHYK, Aref MAHDAVI ARDEKANI
Real effects of lending-based crowdfunding platforms on the
SMEs
Olena Havrylchyk
a,b, Aref Mahdavi Ardekani
aa CES, University of Paris 1 Panthéon-Sorbonne
b LabEx ReFi
21 August, 2020
This paper explores the short-term impact of borrowing via lending-based crowdfunding on performance and health of small and medium enterprises (SMEs) in France. We find that firms borrowing from lending-based crowdfunding platforms are more dynamic (higher asset growth and higher profitability) and innovative, but they have lower leverage, less cash, higher funding costs and less tangible assets that could be pledged as a collateral. To account for this selection bias, we construct three control groups by using Propensity Score Matching, Mahalanobis Distance Matching and Coarsened Exact Matching methods and then run difference-in-difference regressions. We find that borrowing via lending-based crowdfunding platforms increases SMEs’ leverage and interest rate burden in the short-term, but these impacts disappear after two years. We observe asset growth during the year of borrowing, but no impact on sales growth, investment, employment or profitability.
JEL codes: G21, G23, G31, G32
Keywords: lending-based crowdfunding, firm financing, firm performance, informational asymmetry
________________
Email Address: [email protected] (O. Havrylchyk), [email protected] (A.M. Ardekani)
1. Introduction
Lending-based crowdfunding platforms represent a new mode of financial intermediation by connecting directly lenders and borrowers via internet platforms. Although lending-based crowdfunding platforms do not technically perform risk and maturity transformation, there is an ongoing experimentation with different business models that could allow them to perform bank-like functions in the future (Havrylchyk and Verdier, 2018; Havrylchyk, 2018). Indeed, in some countries, platforms are becoming a real alternative to bank credit. For example, in 2017, business lending facilitated by UK crowdfunding platforms amounted to £2 bn of business loans or 0.5% of the total new loans to SMEs (Zhang et al., 2019). The development of lending-based crowdfunding platforms in continental Europe has started much later than in the UK. A regulatory framework for lending-based crowdfunding has been put in place in France in 2014 and in 2017, €88 mln of business loans were facilitated in France, the continental leader in crowdfunding.
Crowdfunding platforms claim that their loans increase firms’ revenues, create jobs and contribute to the GDP via an increased investment (Funding Circle and Oxford Economics, 2019). Firms’ surveys, conducted by platforms, suggest that firms use crowdfunding platforms to increase their working capital, consolidate their debt, buy new equipment and machinery, hire new employees, buy more inventory, launch or develop a new product, move to a larger premise, invest in marketing and expand abroad. The speed of obtaining a crowdfunding loans might allow firms to seize an opportunity that would have been missed if they had to rely on the bank loan (Funding Circle and Oxford Economics, 2019).
The objective of this paper is to investigate the real effects of lending-based crowdfunding on small and medium enterprises (SMEs). More precisely, this paper addresses two interrelated questions. What are the characteristics of SMEs that borrow via lending-based crowdfunding platforms? And what are the effects of these loans on real variables, such as sales growth, investment and employment? In other words, given SMEs’ difficulty to access external finance due to the severe informational asymmetries, we explore the ability of new Fintech entrants, such as lending-based crowdfunding platforms, to contribute to the efficient credit allocation. Earlier literature has documented that riskier SMEs are more likely to borrow from crowdfunding platforms. Findings of the US-based survey suggest that online lenders target SMEs that tend to be smaller, younger, and less profitable than those borrowing from banks
(Wiersch, 2016). A survey of the Funding Circle, the largest UK SME lending platform, shows that their borrowers choose crowdfunding because they do not have collateral (Pierrakis and Collins, 2013). Findings for consumer lending confirm the hypothesis that crowdfunding is allocated to riskier borrowers. De Roure et al. (2016) suggest that borrowers from Auxmoney, the largest consumer-based lending platform in Germany, pay higher interest rate and higher default rate. 1 Di Maggio and Yao (2018) and Morse (2015) show that individual borrowers
from the US platforms are likely to be more debt-laden and to be in more financial distress than the mean US borrowers.
A fundamental follow-up question is whether crowdfunding platforms are able to serve these riskier borrowers that might be underserved or rejected by incumbent banks. Indeed, there is survey evidence that borrowers from online lenders have also submitted more loan applications than borrowers from traditional banks (Wiersch et. al., 2016). While platforms might be more agile in using new financial and information technologies (Liu et al., 2020) and be more proactive in using alternative data, incumbent banks might have informational advantage due to the private information obtained during past lending relationships.2 Moreover, incumbent
banks enjoy implicit government subsidies that allow them to have lower cost of funding in comparison to platforms (Havrylchyk, 2018).
This is the first paper to identify the causal impact of lending-based crowdfunding on SMEs’ performance. In the first step, we document the selection bias by highlighting characteristics of borrowing SMEs. Unlike earlier studies that rely on survey evidence, we rely on the Diane database that collects data on over one million French firms that are obliged to published their financial accounts. We match this data with the list of firms that have borrowed from lending-based crowdfunding platforms between 2015 and 2017.
In the second step, we explore the real effects of lending-based crowdfunding by measuring its impact on the firm’s performance, balance sheet health, capital structure, and use of capital. To mitigate the selection bias, we construct control groups by using Propensity Score Matching
1 Website of Auxmoney acknowledges that borrowers can receive a loan despite a bad credit rating
provided by the Schufa, the German private credit bureau.
2 An earlier literature about the entry of foreign banks might be relevant in this discussion. Dell'Ariccia et al.
(1999) show that new banks that enter the market would make negative profits due to adverse selection problems. In Dell'Ariccia et al. (2004), private information obtained by lenders leads to borrower capture and when incumbent banks face greater competition from outside lenders, banks reallocate credit toward more captured borrowers (flight to captivity). Claeys and Hainz (2014) set up a model where domestic banks possess private information about their incumbent clients but foreign banks have better screening skills.
(PSM), Mahalanobis Distance Matching (MDM), and Coarsened Exact Matching (CEM) methods. We rely on the balancing tests to assess the ability of these matching methods to construct reliable control groups that consists of firms that have not borrowed from lending-based crowdfunding platforms but have similar observable characteristics. We then run difference-in-difference regressions to identify the causal impact of lending-based crowdfunding on the borrowing SMEs. Given the recent nature of the phenomena and data availability, we can measure short-term effects: at the end of the borrowing year, one year and two years after obtaining a loan.
We next explore different mechanisms of how lending-based crowdfunding might affect firm performance. In particular, do lending-based crowdfunding platforms lend to firms that have insufficient collateral to obtain a bank loan? What is the impact on the capital structure, cost of funding and interest rate burden? How do firms use capital raised via platforms? Do platforms contribute to new employment? Do lending-based crowdfunding platforms finance investment, in particular intangible assets that are essential in the knowledge economy?
The last question is important because there is anecdotal evidence that in France SMEs do not have difficulty to obtain a bank credit with collateral but they turn to crowdfunding platforms to finance projects without underlying tangible assets (new marketing strategy, research and development, hiring a new salesperson). This strategy implies that platforms lend to projects that were not financed in the past and, hence, scoring models cannot reliable use credit history (Havrylchyk, 2018). There is a growing academic growing literature that shows that banks might underfund intangible assets, such as software, databases, R&D, design, training, market research, and branding. These assets are difficult to finance because they cannot serve as collateral and are often characterized by the sunk costs (meaning that they cannot be resold in case of failure), non-rivalry, spillovers and synergies (Dell'Ariccia et al., 2017; Döttling at al., 2016; Mann, 2017; Haskel and Westlake, 2018).
Our paper contributes to the rapidly growing literature about lending-based crowdfunding. The existing studies focus on the financial returns for lenders and their decision-making (to whom to lend and at what interest rate) and mostly use the example of consumer lending in the US and China. Several studies document that soft information and social ties could provide an informative signal for lenders (Freedman and Jin, 2014; Everett, 2015; Lin et al., 2013; Lu et al., 2012). Iyer et al. (2016) find that unsophisticated lenders can predict the default rate better than FICO score, while Vallee and Zeng (2018) provide empirical evidence that sophisticated
investors outperform unsophisticated ones. Several studies describe the dark side of crowdfunding as there is evidence of discrimination in terms of race and beauty (Ravina, 2019; Pope, 2011). Unlike these earlier studies that focus on the return and risk tradeoff for individual lenders, we explore the potential benefits of lending-based crowdfunding for the borrowing SMEs. Moreover, the institutional setting of business crowdfunding in France implies that lenders are more willing to delegate due diligence to platforms and invest in all listed SMEs. Our paper is structured as follows. Sections 2 and 3 describe the methodology and data set. Section 4 reports our empirical finding and Section 5 concludes.
2. The institutional environment of lending-based crowdfunding platforms in France
In 2014, France has set-up specific legislation to break banks’ monopoly in business lending and to regulate lending-based crowdfunding platforms with the objective to facilitate credit to businesses.3 More precisely, two legal statuses were introduced: (1) crowdfunding
intermediary (IFP: Intermédiaire en financement participative) for lending-based crowdfunding platforms and (2) crowdfunding advisor (CIP: Conseiller en investissement participatif) for investment-based crowdfunding platforms that include mini-bonds.4
Crowdfunding intermediaries are allowed to facilitate loans up to 1 mln Euros, and crowdfunding advisors facilitate unlisted securities (bonds with fixed rates and since 2016, bonds convertible into shares) and minibonds (a subcategory of « bons de caisse » dedicated to crowdfunding) of up to 8 mln Euros.5
While there is a difference between providing a loan and debt security, as long as platforms do not offer secondary markets, the difference between these two types of crowdfunding platforms is blurred. This paper uses the term lending-based crowdfunding that covers both legal statuses as long as they use a debt contract (loan or mini-bond). In 2019, the European Council, European Commission and European Parliament have agreed to create a euro-wide status for European Crowdfunding Service Providers for Business that will become a mandatory status in the future.
3 Ordonnance n° 2014-559 has modified the Financial and Monetary code to introduce the legal status of
crowdfunding (financement participative).
4Regulation of minibonds was introduced by ordonnance n° 2016-520 (28 april 2016).
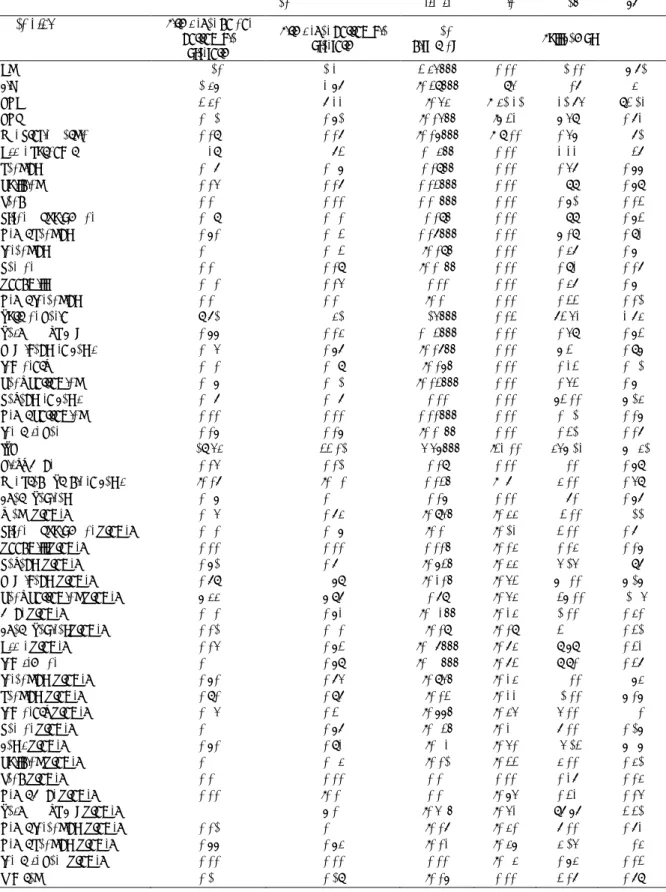
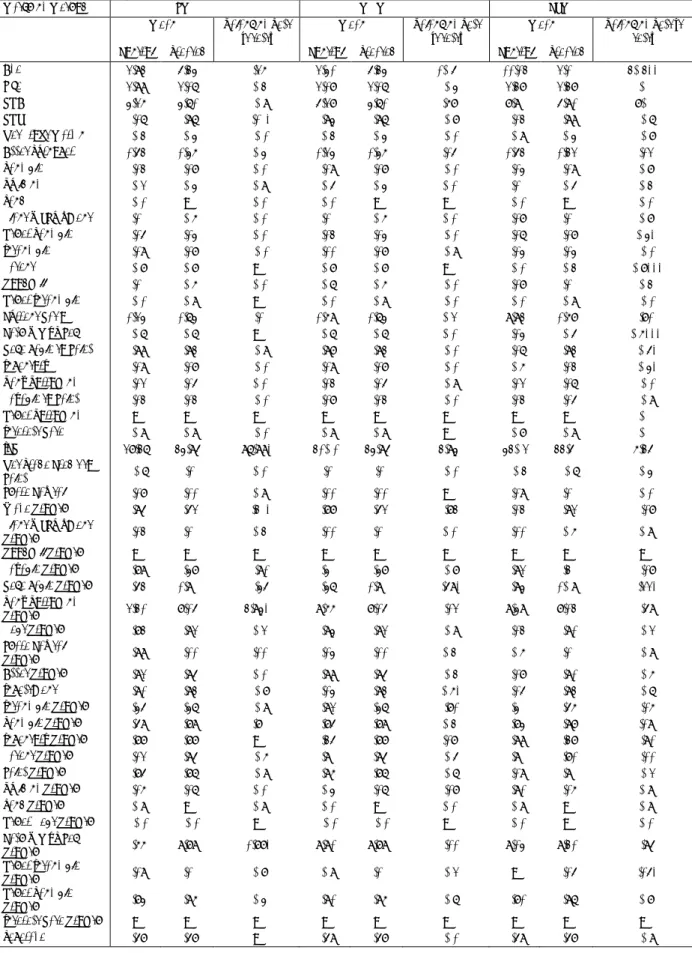
Figure 1. Business lending by crowdfunding platforms in continental Europe (in € million).
Source: Ziegler, T., R. Shneor, K. Wenzlaff, A. Odorović, D. Johanson, R. Hao, L. Ryll,
2019. The 4th European Alternative Finance Benchmarking Report
Figure 1 shows the growth of lending-based crowdfunding in France and other countries in continental Europe. In 2017, €88 mln of business loans were facilitated in France. While this makes France one of the EU leaders, it is a very small share of total bank’s business lending. In contrast, in the UK, £2 bn of business loans were facilitated by platforms. To put the UK numbers in context, business lending by platforms has contributed to 9.5% of total new loans issued to SMEs by the UK banks (Zhang et al., 2019).
Platforms in many countries have established secondary markets (e.g. UK, Israel) that are a useful mechanism for providing liquidity to investors. The French regulatory approach to this question is not clear. Secondary markets “are not foreseen” for lending-based crowdfunding platforms (for loans up to 1 mln Euros) but “are not excluded” for investment-based crowdfunding platforms (for debt securities up to 8 mln Euros) and even “foreseen” for minibonds that could be traded in the future on the blockchain.6 In practice, none of the French
platforms offers secondary markets because of the regulatory uncertainty.
6 The ordonnance from December 2017 has introduced the concept of the blockchain (dispositif
d’enregistrement électronique partagé) that will allow the registration and trading of different financial instruments, including minibonds issued by French investment-based crowdfunding platforms. This legislation provides a framework for experimentation with a new technology in the organization of secondary markets.
0 20 40 60 80 100 120 140 FR NL DE ES CH FI PL IT BL LV DK AU EE LT 2013 2014 2015 2016 2017
The differences in legal statuses introduce differences in the supervision: the supervision of crowdfunding intermediaries is done by the ACPR (banking supervisor), while the supervision of crowdfunding advisors is done by the AMF (financial markets supervisor). Platforms do not have capital requirements, but they are required to have a professional liabilityinsurance policy covering 250 000 euros per event and 500 000 euros per year for IFP and 400 000 euros per event and 800 000 euros per year for CIP.One could characterize the supervision of platforms as a light touch because there are currently no reporting requirements for platforms and the equivalent of one man per year is devoted to controls at the ACPR (Havrylchyk, 2018). Importantly, these platforms are allowed to facilitate credit only to business and banking monopoly still exists for consumer credit. United Credit, the largest consumer-to-consumer lending platform in France, had to obtain a credit institution license.
French platforms are explicitly forbidden to invest in loans that they facilitate. While this eliminates balance sheet risks for platforms, it might undermine platforms’ incentives to properly assess risks because platform business model could be seen as a ‘originate and distribute model’, which has led to the build-up of risks before the global financial crisis (Keys et al., 2010).7 Despite such interdiction, some platforms design ways to invest in loans to signal
their “skin in the game”.
To ensure business continuity in the case of platform liquidation, French platforms are required to sign a contract with a third-party payment institution to ensure business continuity. Platforms cannot receive any money from clients unless they obtain the status of the agent providing payment services. While a limited payment institution license was put in place, none of the platforms has asked to have this status. All platforms prefer to rely on a third party to process payments.
The French market has experienced consolidation and partnering with traditional financial institutions. Unilend, the pioneer of lending-based crowdfunding, failed in 2018 and was acquired by Pretup. Banque Postale has acquired a Lendopolis and has entered the capital of WeShareBonds, a platform that facilitates minibonds. In 2017, the Bpifrance, the French state investment bank, has decided to co-finance loans originated by October, the largest French
7In the wake of the crisis, the regulators have imposed the risk retention requirement (a securitizer is required to
retain at least 5% of the credit risk) to create economic incentives for securitizers to monitor the quality of the securitized assets. The ultimate goal is to help align the interests of securitizers with those of investors.
platform, followed by the European Investment Bank’s decision to co-finance 18.5 mln Euros of loans. Lending by Bpifrance and EIB provide a valuable signal to the market that the crowdfunding business model is viable. Several platforms have referral arrangements with
institutional partners and exchange data with them (Ziegler et al., 2019), but details are
confidential.
3. Methodology
To estimate the real impacts of crowdfunding loans, we run a counterfactual analysis on the accounting data of firms that have borrowed via lending-based crowdfunding platforms. Since earlier studies show that the two types of firms have very different characteristics before borrowing, we cannot directly compare their performance as this would lead to the biased results (Wiersch, 2016; Pierrakis and Collins, 2013). Hence, to overcome the selection bias, we construct an appropriate control group that is similar to our treated group based on variety of covariates. In particular, we consider three matching techniques: Coarsened Exact Matching (CEM), Propensity Score Matching (PSM) and Mahalanobis Distance Matching (MDM). Requiring exact matches often leads to many individuals not being matched, which can result in larger bias than if the matches are inexact but more individuals remain in the analysis (Rosenbaum and Rubin, 1985). This problem is partly solved by the CEM that allows matching on categories rather than continuous variable. Mahalanobis Distance Matching regards all covariates as equally important. Therefore, it performs well with relatively small number of covariates, while its performance might deteriorate when the covariates are not normally distributed or there are many covariates. The advantage of Propensity Score Matching is its ability to summarize all of the covariates into one score: the probability of being treated (Rosenbaum and Rubin, 1983). It works well with large number of covariates and, hence, allows to exploit the informational richness of our dataset. All these methods are frequently used in the economic and financial literature (Cheng et al., 2020; Cui & Xu, 2019; García-Vega et al., 2020; Giannetti, 2019; Özbuğday et al., 2020; Zhang et al., 2020; Havrylchyk and Jurzyk, 2011). There are also several practical manuals for the application of matching techniques, in particular PSM (Stuart, 2010; Caliendo and Kopeinig, 2008; Imbens, 2015).
Matching can be only done on the observable characteristics, which might still leave us with the selection bias due to the unobservable firm characteristics. We address this bias, by
combining matching with difference-in-difference (DiD) estimation. This allows us to release the assumption of unobservable but time-invariant differences, such as the quality of the management. It is important to underline that one of the defining features of lending-based crowdfunding is the speed of the decision making about listing the loan on a platform. This is possible because platforms use mostly hard information to select firms, while the role of soft information is limited. For example, October, the largest French platform, has started to issue instant loans, which by definition can be done by using only hard information. Hence, matching on observable characteristics should allow us to have a reliable control group and estimate the causal impact of borrowing via a platform.
In light of the above discussion, we have chosen the PSM as our baseline methodology, but we test the robustness of our results with the MDM. We exclude the CEM because it does not allows us to construct a good control group, as is discussed in section 5.
To perform PSM, we run Probit model where we estimate the probability of borrowing from lending-based crowdfunding platforms on the set of firm’s observable factors:
PSi = Pr(Ti = 1|Xi-1)
Where T is dummy of treatment which takes value of 1 if firm i is treated and zero otherwise. X are the vector of covariates.
Selection of variables of the Probit model
To select variables into our Probit model we rely on several rules that are described in the literature (Stuart, 2010; Caliendo and Kopeinig, 2008; Imbens, 2015). However, there is no agreement among researcher about which variables should be included in the propensity score model. According to Caliendo and Kopeinig (2008), one should include only variables that influence simultaneously the participation decision and the outcome variable to avoid having over-parameterized models. In contrast, Stuart (2010) advices to include variables that may be associated with treatment assignment and/or the outcomes and provides examples of matching that have 50 or even 100 covariates included in the procedure. Imbens (2015) also considers that the penalty for including irrelevant terms in the propensity score is generally small, but warns that the precision will go down if too many terms are included in the specification.
Augurzky and Schmidt (2001) divide all covariates in three sets. The first set includes covariates which strongly influence the treatment decision but weakly influence the outcome variable. The second set includes covariates which are relevant to the outcome but irrelevant to the treatment decision. The third set of covariates influences both treatment and outcome. They show that using only the third set of covariates or the first and the second set of covariates produces better estimation that the use of the full set of covariates.
Since we use firms’ financial accounts to measure both treatment and outcome, it is difficult to argue that variables that measure treatment are not related to outcomes or that variables that measure outcomes are not related to the treatment. Hence, we prefer to be liberal in the number of included variables and use the approach of Augurzky and Schmidt (2001).
Since only variables that are unaffected by participation (or its anticipation) should be included in the model, all explanatory variables are either fixed over time or measured before participation. Lagged values of outcomes influence future outcomes and are therefore included in the specification. Given the recent nature of crowdfunding, we can plausibly assume that our lagged explanatory variables have not been influenced by the anticipation of participation. Finally, in order to decrease variance, our final propensity score specification only includes significant variables.
Choosing a Matching Algorithm
Based on the estimated probability of treatment from our Probit model, we pair each treated firm with a control firm by one-to-one nearest-neighbor matching without replacement, meaning that an untreated individual can be used only once as a match. Nevertheless, to avoid the risk of bad matches if the closest neighbor is far away, we impose the maximum propensity score distance (caliper) of 0.2 standard deviation, which is standard in the literature (Stuart, 2010). Finally, we ensure the common support assumption between treatment and comparison group by deleting all observations whose propensity score is smaller than the minimum and larger than the maximum in the opposite group.
The above matching choices usually involve trade-offs between bias and variance. Choosing single neighbor matching (in contrast to multiple neighbor) with caliper (in contrast to no caliper) minimizes the bias in our estimates, but at the expense of the larger variance. Choosing matching without replacement (in contrast to replacement) could increase the bias if we had a
lot of treated individuals with high propensity scores but only few comparison individuals with high propensity scores. However, our dataset includes small number of treated firms (187) and a very large number of untreated firms (almost 1 million firms), which should limit the trade-off. For example, the caliper of 0.2 does not lead to losing any matches, which means that we always have a good candidate for matching and hence the imposition of the caliper does not increase variance. When we do matching with replacement, we have a large pool of firms that enable us to match the high-score treated firms with high score untreated ones. For the same reason, multiple neighbor matching should not increase the bias of our results because the quality of matching should not deteriorate, but it could decrease the variance because we use more information. We test the robustness of our results with multiple neighbor matching, with caliper and with replacement.
PSM allows us to identify the matching pairs that have relatively small differences in propensity scores. To test the quality of the matching, we compute the balancing score or a two-sample t-test to check if there are significant differences in covariate means for both groups (Rosenbaum and Rubin, 1985). We must ensure that the covariates are balanced in both groups after matching and hence no significant differences should be found. To ensure the quality of our control group, we perform our balancing test for all variables, even for outcome variables that are not included in the Probit regression.
Finally, we run the following regression to obtain our DiD estimators for the paired sample:
Firm-Characteristicsit = α + Crowdi + Aftert + Crowdi × Aftert + eit
Where α is constant, Crowd is a dummy variable that takes a value of one if firm i has borrowed via lending-based crowdfunding platform, and zero otherwise. After is dummy variable that takes a value of one for the period of borrowing via lending platform and zero otherwise and
eit is idiosyncratic error term. We cluster standard errors.
For the robustness check, we employ Mahalanobis distance matching (MDM) and Coarsened Exact Matching (CEM):
Mahalanobis distance matching (MDM):
where Xi and Xj are observable characteristics of firm i and firm j. We use the same covariate vector (X) that we used in PSM. Following the running of MDM, we pair each control with treated firm by shortest distance between Xi and Xj without replacement.
Coarsened Exact Matching (CEM):
By using the same covariate vector that we have used in PSM and MDM, we first allocate the appropriate coarsening to each continuous covariate by creating a certain number of equally spaced cut-points. Our binary covariates are not coarsened.
Selecting an optimum number of cut-points is challenging. Because of the small number of treated firms (187) and the large number of covariates used in this method, increasing the number of cut-points will substantially drop many of our treated firms from the final matched sample. Using the small number of cut-points also would increase the matching bias. By carefully considering the above points and to construct a matched group that could be comparable with those that are constructed by our alternative matching methods, we finally come up with the three equally spaced cut-points for all our continuous covariates.
We then follow the CEM algorithm developed by Blackwell et al (2009): 1- Start with covariate vector (X) and copy them to vector (X*) 2- Coarsening vector (X*) by the three equally spaced cut-points
3- Assign each observation in a stratum that is created per unique observation of covariate vectors (X).
4- All the created strata assign to the original data (vector(X)) and any observation whose stratum does not contain at least one treated and one control unit is dropped.
4. Data, variable selection and descriptive statistics
For our analysis, we use the Diane database which contains financial statement information for French firms that are obliged to publish their financial accounts. Starting from 2016, the new law (“loi Macron ») has exempted small firms from publishing their financial accounts. Small firms are defined as those under one of the following thresholds: balance sheet size of 4 mln euros, sales of 8 mln euros, or 50 employees.
The initial number of firms available in Diane database for the period of our study is 1,264,462 out of 4,290,853 existing French firms. When we exclude firms with poor accounting information, our final sample consists 955,949 firms which cover 22.28% of the total French firms or around 70% of the total bank credit. Our dataset covers the period between 2014 and 2018.
We also retrieve a list of 780 firms that obtained loans via the leading French lending-based crowdfunding platforms between 2015 and September 2017. Due to the missing data for small firms that do not publish their financial accounts, we are left with 187 firms for which we have rich data on all the covariates used in the paper. Loosing 80% of the sample highlights the difficulty of not only doing research on this topic, but also lending to small firms that are not well covered by public databases, exposing lenders to severe adverse selection problems.
Selection of treatment variables
To build our model, we rely on the economic theory, previous research and our knowledge about the institutional settings. See all variable definitions in Table 1.
Earlier crowdfunding literature has documented that online borrowers tend to be smaller, younger, fast growing, less profitable, have less collateral and more generally have credit constraints (Wiersch, 2016; Pierrakis and Collins, 2013). Hence, we include Size (log of assets),
Age, ROE, ROA, Net Profit Margin, Sales growth, Asset Growth, and Wage Growth. To
measure the strength of the balance sheet we rely on the Leverage, Current ratio and Asset
Turnover. Note that the last measure is often used as a predictor of future earnings (Fairfield et
al., 2001). To better explore firms’ capital structure, we disaggregate total debt into Bank
Borrowing, Accounts payable, and Other Borrowing and Debt. The current ratio is a measure
of corporate liquidity or the ability of a firm to meet its short-term liabilities. We additionally disaggregate current assets into Cash and Marketable Securities, Accounts Receivable, and
Inventory.
We also study firms’ funding cost, Interest Rate, that should reflect all credit risk relevant information that the lender can observe (Petersen and Rajan, 1997). In addition, we include
Interest Coverage Ratio (ICR = earnings before interest and taxation to interest paid), which
reflects the burden of interest rate payments. According to the French Financial Stability Council (le Haut Conseil de Stabilité Financière), ICR below three indicates risky debt.
Banerjee and Hofmann (2018) define firm as a zombie if its ICR has been less than one for at least three consecutive years and if it is at least 10 years old.
To evaluate firms’ capacity to pledge collateral, we include the share of firm’s Tangible Assets (Lands, Buildings, Plants & Equipment and Other Tangible Assets) in total assets. The availability of collateral is one of the most fundamental variables that determines banks willingness to lend and influences credit constraints (Carbo-Valverde et al., 2016). Since crowdfunding platforms do not require collateral, firms with low level of pledgeable assets might be more likely to turn to these new intermediaries, which is confirmed by survey evidence for the UK (Pierrakis and Collins, 2013; Funding Circle and Oxford Economics, 2019). Indeed, lending platforms emphasize the benefits of lending without collateral and the growth potential of the digital sector and firms that adopt digital technology that is “asset light” (Funding Circle and Oxford Economics, 2019).
There is a growing literature that the investment in intangible assets is less likely to be financed by banks because they are more difficult to pledge as collateral (Dell'Ariccia et al., 2017; Döttling at al., 2016; Mann, 2017; Haskel and Westlake, 2018). Hence, we also include the share of Intangible Assets (Patent, R&D, Goodwill and Other Intangible Assets) that have been on the rise in the knowledge economies. Note that firms in the knowledge economy have high asset turnover ratio than firms in the traditional economy. We additionally include industry dummies for the services, manufacturing, trade, agriculture and transportation, as well as classification of knowledge intensive services (low technology, knowledge intensive services, high tech knowledge intensive services, financial knowledge intensive services, other knowledge intensive services). Finally, geographic dummies should capture the impact of local credit and market conditions.
Many of the above variables might capture credit constraints (Age, Size, Leverage, Current
Ratio, Profit Margin, Interest Rate, Tangible Assets) (Beck et al., 2005; Beck et al., 2006;
Gómez, 2019). In addition, we compute Net Trade Credit to understand if trade credit is a source of funding. (Peterson and Rajan, 1997). Since trade credit is considered to be more expensive than bank credit, this variable can also be used a proxy for credit constraints.
Selection of outcome variables
Our main outcome variables are performance and revenue measures, such as sales growth, asset growth, profit margin, ROA and ROE. These variables are standard measures of firm
performance in the academic literature that explores the impact of credit constraints or credit access (Giannetti & Ongena, 2009; Gómez, 2019; Banerjee and Duflo, 2014).
Next, we explore three different channels through which improved access to finance via lending-based crowdfunding platforms could impact firms’ performance: (1) increased investment; (2) increased employment; (2) working capital management; (3) debt consolidation.
To study the impact on investment, we define investment as a change in fixed assets and its components (land, building, plants and equipment, other tangible assets) which is standard approach in the literature (Beck et al., 2020; Garcia-Appendini, 2018; Carbo-Valverde et al., 2016; Moyen, 2004; Fazzari et al., 1988). In addition, we explore the impact on the intangible assets and its components (goodwill, patents, other intangible assets). We recognize that these are imperfect measures of the knowledge economy because we lack data on the total R&D expenditures and consider only the part that is capitalized.
To measure employment effect of crowdfunding, we compute wage growth, which might reflect either an increase in number of employees8, higher wages and salaries or skill upgrading.
This will allow us to test the claim of crowdfunding platforms that they contribute to job creation. If firms were credit constrained before borrowing from a platform, we expect an improvement in all these performance measures.
Most firms claim that they use crowdfunding loans to finance working capital (Funding Circle and Oxford Economics, 2019). Working capital management could have beneficial impact on firms’ profitability and sales (Deloof, 2003). To account for this, we consider the following outcome variables: current ratio, growth in current assets and its components (cash and marketable securities, accounts receivables, inventory) and net trade credit. While a generous trade credit policy may lead to higher sales, the flip side is that money is locked up in working capital (Deloof, 2003).
Finally, we consider the role of crowdfunding in debt consolidation and capital structure to explore whether crowdfunding substitutes for other types of loans or whether it provides an additional source of financing. Our outcome variables are Leverage (and its components: Bank
Loans, Accounts Payable, Other Borrowings and Debt), Interest Cover Ratio and Interest Rate.
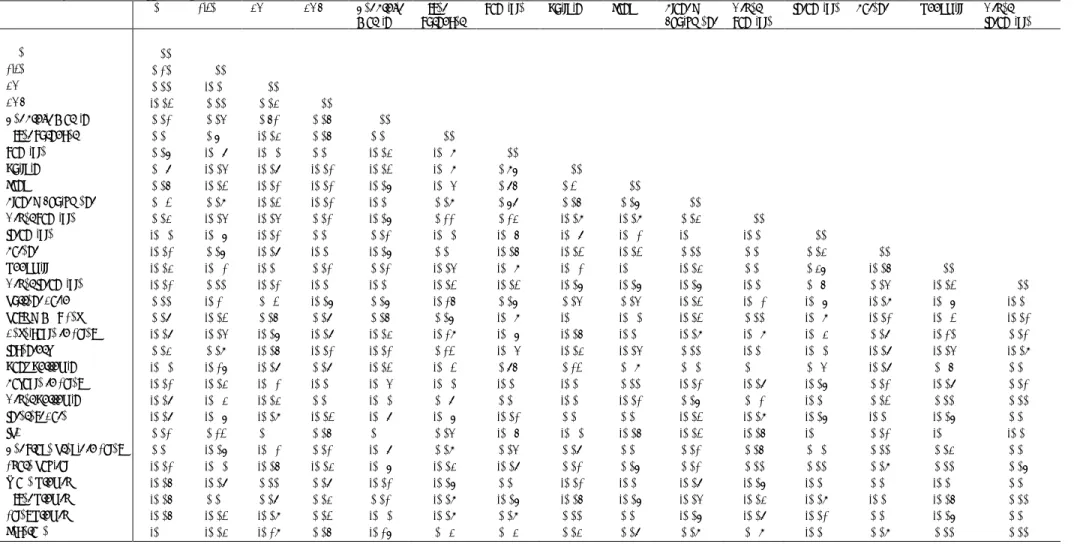
Table 2 shows the descriptive statistics separately for firms that have received loans via crowdfunding platforms and those that have not. We perform a t-test that documents significant differences between these two groups of firms, that can be considered as evidence of the selection bias. Firms that have loans from lending platforms are younger (5.5 versus 7.5 years), more profitable (ROE of 0.3% versus 0.2%), have significantly less cash (8% versus 23% of total assets), have higher interest rate burden (IRC of 43 versus 57), have higher wage growth (0.7% versus 0.3%), have less tangible assets that can be used as collateral (12% versus 15%) and more intangible assets (14% versus 10%). Table 3 presents the correlation matrix.
5. Empirical findings
5.1. Determinants of access to lending-based crowdfunding platforms
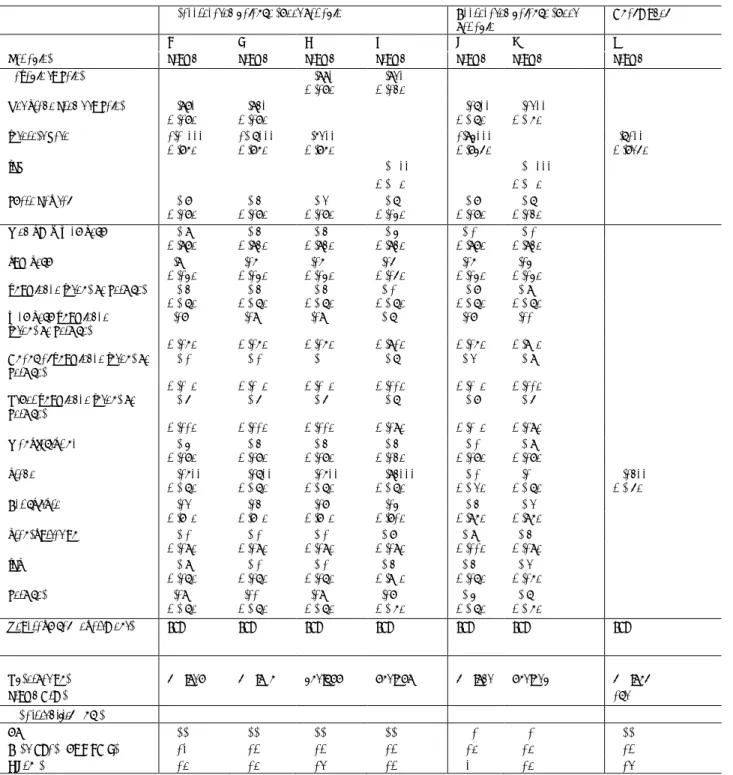
We first investigate determinants of access to the crowdfunding loans with a Probit model. The dependent variable is equal to one for firms that borrow from lending-based crowdfunding platforms for a year before borrowing. In other words, we rely on the data that is available to the lender at the moment when it has to make a lending decision. To eliminate the impact of crowdfunding loans, we delete data for these firms for the period after the borrowing. The Probit model results are presented in Table 49. Columns 1-4 presents models with some
variables at the disaggregated level. Due to the high correlation between some variables (in particular different profitability measures and growth measures), they are introduced one at a time. Columns 5-6 reports the results of models with aggregated balance sheet data.
Column 7 includes only significant variables (preferably at the aggregated level, but if they are not significant, then at the disaggregated level) and is our preferred model that we use for matching. Different tests (R2, area under the ROC curve, F-score) show that this model predicts
well the firm’s probability to borrow via lending-based crowdfunding platform.
We find that younger firms with lower leverage, less cash, higher asset growth and profitability, higher financing costs and less tangible assets are more likely to borrow from lending-based crowdfunding platforms. Such findings are in line with the hypothesis that these firms are dynamic (high growth and profitable), but might be facing financial constraints, as they have less debt, less cash, less tangible assets that could be pledge as collateral and higher financing
costs. While some of these results are in line with the earlier literature (less liquid, younger, less tangible assets), higher profitability of these firms contrasts with earlier findings. Importantly, firms borrowing from lending-based crowdfunding platforms do not appear to have been excluded from bank credit in the past as they have a higher share of bank borrowing and lower share of accounts payable. These firms appear to be characterized by high share of inventory, which might be a sign of the poor inventory management. While we do not find that firms borrowing from lending-based crowdfunding belong to the knowledge-intensive sectors of the economy, they appear to have a higher share of patents.
Concerning the interest rate burden, we find that firms with higher burden (lower IRC) are more likely to borrow via lending-based crowdfunding. Importantly, wehave identified 2610 zombie firms in our full sample that includes one lending-based crowdfunding borrower. In addition, there are 53774 firms with risky debt in our full sample (5% of the full sample) and among them 19 firms borrow via lending-based crowdfunding platform (10% of the firms borrowing via platforms).
By relying on our Probit model results, we match firms that have borrowed via crowdfunding platforms with similar firms that have not done so. We consider three matching methods: PSM, MDM, CEM. To ensure the quality of our control group and matching, we perform balancing tests that measure differences between our treated and control groups before obtaining credit via crowdfunding platforms (Table 5). Our results suggest that the PSM and the MDM allow us to construct a control group that is not significantly different from the treated group. However, the results of balancing tests for CEM show that there are still significant differences between our treated and control groups. Hence, we cannot rely on this type of matching in our causal estimation.
We now turn to the results of real impacts by looking at the finding of Difference-in-Difference estimations for firms matched using PSM and MDM methods. We present separately the results of the crowdfunding effects for the borrowing year, one year and two years after the loan issuance. It is important to note that the sample of firms for which we can calculate the impact after two years is smaller than for the first two years. If we restrict our sample only to firms that have borrowed before 2017 and for which we have three years of data after borrowing (2016, 2017 and 2018), our findings for the first two years remain largely unchanged.
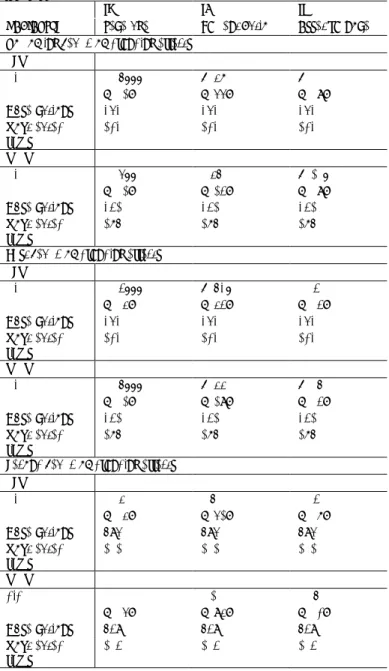
5.2. Impact on balance sheet strength and capital structure
Tables 6 reports the impact of lending-based crowdfunding platforms on the balance sheet strength (measured by leverage, current ratio and asset turnover). Borrowing via platforms leads to an increase in firm leverage in the borrowing year and one year after, but this impact disappears two years after the issuance of crowdfunding platform. An increase in leverage is consistent with the complementary role of platform borrowing, which appear to satisfy firms’ demand for credit that was unmet by other sources of funding. We find no impact on the firm liquidity, measured by the current ratio, or asset turnover.
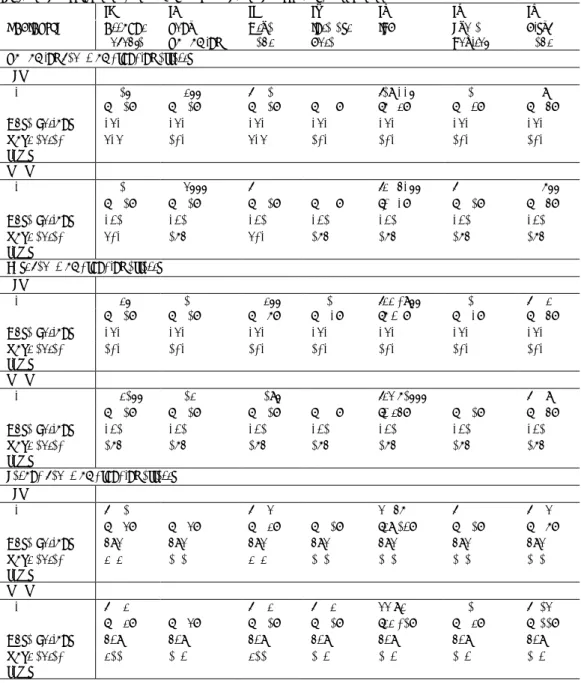
To explore the effect on firm leverage in more detail, Table 7 presents results for the capital structure (bank borrowing, accounts payable, other debt, share capital), the cost of funding and interest coverage ratio. Since firms’ balance sheets do not have a separate line for crowdfunding loans, they are accounted in the same line as bank borrowing which explains an increase in the ratio of bank borrowing in the borrowing year. One year after borrowing, this impact disappears, which is surprising because most crowdfunding loans have a maturity of over one year. This finding suggest that either firms in the control group have succeeded in increasing their bank loans, or firms in the treatment group have diminished their reliance on bank loans. When we look at other categories of the capital structure, we observe an increase in accounts payable and other debt one year afterwards.
An increase in firm leverage increases interest coverage ratio, which is a proxy for interest rate burden. This increase does not reflect an increase in the average financing costs of the borrowing firms, but rather a decline in revenues that will be discussed later. Despite an increase in interest rate burden, there is no robust evidence that debt become riskier. To be more precise, when matching is done with the MDM, we find that risky debt increases at the borrowing year, but this result is not robust when matching is done with PSM. Recall that debt is defined as risky by the French Financial Stability Council when ICR is equal or less than 3. To sum up our results so far, we find that access to lending-based crowdfunding increases leverage and interest rate burden in the short-term, but these effects disappear two years after borrowing.
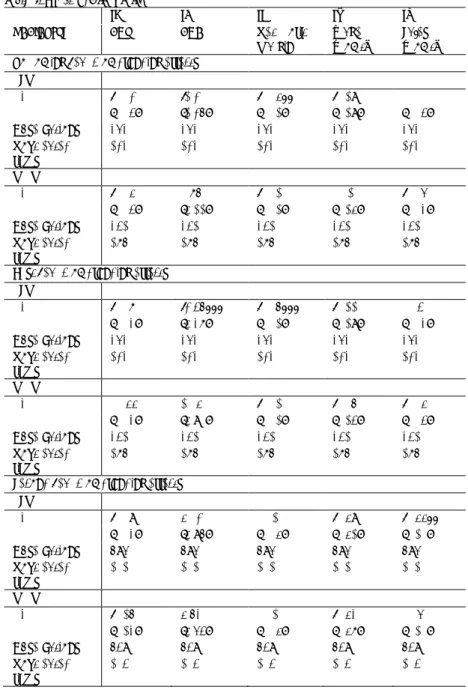
5.3. Impact of firm performance
Table 8 reports results for the impact of crowdfunding on firm performance, measured by ROE, ROA, profit margin, sales growth and wage growth. We find no robust evidence for the positive impact on firm profitability. On the contrary, the PSM suggest that there is a decline in profitability in the borrowing year and a year after the loan issuance. While this finding is not robust in the MDM specification, it might explain a decline in the ICR described above. We find no robust evidence of increased sales growth or wage growth. On the contrary, results with PSM suggests a reduction in sales growth two years following the loan issuance.
5.4. Impact on the use of capital
Tables 9, 10 and 11 report our findings on the use of raised capital, measured by asset growth and its components, such as investment in tangible (Table 9) and intangible assets (Table 10) and an increase in liquid assets (Table 11). While our findings document the impact of crowdfunding loans on total asset growth during the borrowing year, we do not find any significant impact on the precise nature of these assets. Such lack of significant results is likely to reflect different uses of raised capital. While some firms might have used new debt to invest in tangible assets, others might have decided to acquire another company (which would increase goodwill), to increase their cash holdings or inventory or hire new employees. Such wide range of different uses of crowdfunding loans would be consistent with what is described by platform founders.
Finally, our results suggest that two years after borrowing, firms’ total investment, and in particular investment in patents, decline. These last results should be interpreted with caution because we do not observe these results in the first two years and these finding are obtained with a smaller sample of firms, as it was explained above.
6. Conclusions and discussion
Using the counterfactual analysis, we investigate the real effects of access to credit via lending-based crowdfunding platforms. We study 187 firms that have borrowed from platforms in a period between 2015 and 2017. To identify causal effects on the firm performance, we rely on
two control groups using Propensity Score Matching and Mahalanobis Distance Matching that allow us to construct reliable control groups and then run difference-in-difference regressions. Given the short history of this phenomena, we are able to analyze only short-term impacts: during the year of the borrowing, one and two years after borrowing.
We find that lending-based crowdfunding platforms facilitate access to credit for younger firms that have less cash, less debt, less tangible assets that could be pledged as collateral and higher funding costs that might reflect their higher probability of default. At the same time, the borrowing firms appear to be more profitable, to have higher growth rates and to be more innovative (as illustrated by higher patents ratio). This is consistent with the hypothesis that lending platforms attract dynamic SMEs that are likely to have been rejected by incumbent banks due to the lack of collateral. This also means that platforms face significant adverse selection problems, which is a major challenge because they have less access to credit history data than incumbent banks.
Controlling for the above selection bias, we document that borrowing via platforms leads to an increase in leverage and interest rate burden, but these impacts disappear two years after borrowing. While firms’ assets grow during the borrowing year, we do not identify one unique use of these assets, which might reflect different firms’ strategies, such as investment in tangible or intangible investment, holding more cash or buying inventory. Moreover, its effect is very short-lived and disappears one year after borrowing. We find no impact on firm performance, measured by profitability, sales growth, employment growth or asset turnover. The lack of significant impact on firm performance might be interpreted as an evidence of lending-based crowdfunding platforms being as good in credit allocation as incumbent banks. In the context of the informational advantage of incumbent banks and the fact that crowdfunding platforms attract firms that have been rejected by every other lender, the lack of negative impact could be interpreted as good news. At the same time, it is important to remember that our econometric analysis is done with a sample of the most transparent SMEs that are served by lending-based crowdfunding platforms. We are currently working with other data sources to understand the impact of lending-based crowdfunding platforms on SMEs that are not covered by traditional data providers.
References
Augurzky, B. & Schmidt C. (2001). The propensity score: a means to an end. Discussion Paper No. 271, IZA.
Banerjee, A.V., E. Duflo (2014). Do Firms Want to Borrow More? Testing Credit Constraints Using a Directed Lending Program, The Review of Economic Studies, Volume 81, Issue 2, Pages 572–607
Banerjee, Ryan Niladri and Boris Hofmann (2018). "The rise of zombie firms: causes and consequences," BIS Quarterly Review, Bank for International Settlements, September. Beck, T., A. Demirgüç-Kunt, L. Laeven and V. Maksimovic (2005). “Financial and Legal Constraints to Firm Growth: Does Firm Size Matter?”, Journal of Finance, Vol.60, No 1, pp. 137-177.
Beck, T., A. Demirgüç-Kunt, L. Laeven and V. Maksimovic (2006). “The determinants of Financing Obstacles”, Journal of International Money and Finance, Vol. 25:6, 932- 952.
Beck, T., Da-Rocha-Lopes, S. Silva, A. F (2020). Sharing the Pain? Credit Supply and Real Effects of Bank Bail-ins, The Review of Financial Studies.
Blackwell, M., Iacus, S., King, G., & Porro, G. (2009). cem: Coarsened exact matching in Stata. The Stata Journal, 9(4), 524-546.
Caliendo, Marco & Kopeinig, Sabine (2008). Some Practical Guidance For the
Implementation of Propensity Score Matching. Journal of Economic Surveys. 22. 31-72. Carbo-Valverde, S., Rodriguez-Fernandez, F. and Udell, G.F (2016). Trade Credit, the
Financial Crisis, and SME Access to Finance. Journal of Money, Credit and Banking, 48: 113-143.
Cheng, H., Wang, Z., Peng, D., & Kong, Q. (2020). Firm’s outward foreign direct investment and efficiency loss of factor price distortion: Evidence from Chinese firms. International
Review of Economics and Finance, 67, 176–188.
Claeys, Sophie & Hainz, Christa (2014). Modes of foreign bank entry and effects on lending rates: Theory and evidence. Journal of Comparative Economics, Elsevier, vol. 42(1), pages 160-177.
Cui, L., & Xu, Y. (2019). Outward FDI and profitability of emerging economy firms: Diversifying from home resource dependence in early stage internationalization. Journal of
World Business, 54(4), 372–386.
Dell'Ariccia, Giovanni, Friedman, Ezra and Marquez, Robert (1999). Adverse selection as a Barrier to Entry in the Banking Industry, RAND Journal of Economics 30 (3), 515-534.
Dell'Arricia, Giovanni and Marquez, Robert (2004). Information and Bank Credit Allocation, Journal of Financial Economics, vol. 72, issue 1, pages 185-214.
Dell'Ariccia, G., Kadyrzhanova , D., Minoiu, C., & Ratnovski, L. (2017). Bank Lending in the Knowledge Economy. IMF Working Papers.
Deloof, M. (2003), Does Working Capital Management Affect Profitability of Belgian Firms?. Journal of Business Finance & Accounting, 30: 573-588.
De Roure, C., L. Pelizzon, P. Tasca. (2016). How does P2P lending fit into the consumer credit market? Deutsche Bundesbank Discussion Paper No 30/2016
Di Maggio, Marco and Yao, Vincent (2018). Fintech Borrowers: Lax-Screening or Cream-Skimming?
Döttling, R., Ladika, T., & C.Perotti, E. (2016). The (Self-)Funding of Intangibles. SSRN. Everett, C. R. (2015). Group membership, relationship banking and loan default risk: The case of online social lending, Banking and Finance Review 7(2).
Fairfield, P.M., Yohn, T.L. (2001). Using Asset Turnover and Profit Margin to Forecast Changes in Profitability. Review of Accounting Studies 6, 371–385
Fazzari, S. M., Hubbard, R. G., Petersen, B. C., Blinder, A. S., & Poterba, J. M. (1988). Financing Constraints and Corporate Investment Author(s). In Source: Brookings Papers on
Economic Activity (Vol. 1988).
Freedman, S. and Jin, G., (2014). Learning by Doing with Asymmetric Information : Evidence from Proper.com. NBER Working Paper n°16855.
Funding Circle and Oxford Economics (2019). The big business of small business. The Funding Circle Impact Report.
Garcia-Appendini, E. (2018). Financial distress and competitors’ investment. Journal of
Corporate Finance, 51, 182–209.
García-Posada Gómez, M. (2019). Credit constraints, firm investment and employment: Evidence from survey data. Journal of Banking and Finance, 99, 121–141.
García-Vega, M., & Vicente-Chirivella, Ó. (2020). Do university technology transfers increase firms’ innovation? European Economic Review, 103388.
Giannetti, Mariassunta and Ongena, Steven R. G. (2009). Financial Integration and Firm Performance: Evidence from Foreign Bank Entry in Emerging Markets (April 2009). Review of Finance, Vol. 13, Issue 2, pp. 181-223.
Giannetti, C. (2019). Debt specialization and performance of European firms. Journal of
Empirical Finance, 53, 257–271.
Haskel J., Westlake S, (2018). Capitalism without Capital. The rise of the intangible economy. Princeton University Press
(2019). The Expansion of the Peer-to-Peer Lending (August 23, 2019). Available at SSRN: https://ssrn.com/abstract=2841316
Havrylchyk, O., (2018). Regulatory framework for the loan-based crowdfunding platforms, (2018). OECD Working Paper No. 1513.
Havrylchyk, O. and M. Verdier (2018). The financial intermediation role of the P2P lending platforms, Comparative Economic Systems 60 (1), 115-130
Havrylchyk, O. and E. Jurzyk (2011). Inherited or earned? Performance of foreign banks in Central and Eastern Europe, Journal of Banking and Finance 35(5), 1291-1302.
Imbens, Guido. (2015). Matching Methods in Practice: Three Examples. Journal of Human Resources. 50. 373-419.
Iyer, R., A. I. Khwaja, E. F. P. Luttmer and K. Shue, (2016). Screening Peers Softly: Inferring the Quality of Small Borrowers, Management Science 62:6, 1554-1577
Keys, B. J., Mukherjee, T., Seru, A. and Vig, V. (2010). Did securitization lead to lax screening? Evidence from subprime loans, Quarterly Journal of Economics, No 125(1), pp. 307‐362.
Lin, M., Prabhala, N. R., and Viswanathan, S. (2013). Judging Borrowers By The Company They Keep: Friendship Networks and Information Asymmetry in Online Peer-to-Peer Lending. Management Science, 59(1): 17-35.
Liu, Z., Shang, J., Wu, S. yi, & Chen, P. yu. (2020). Social collateral, soft information and online peer-to-peer lending: A theoretical model. European Journal of Operational Research,
281(2), 428–438.
Lu, Y., Gu, B., Ye, Q., and Sheng, Z. (2012). Social Influence and Defaults in Peer-to-Peer Lending Networks. Conference on Information Systems and Technology (CIST 2012) White Paper.
Mann, William (2017). Creditor Rights and Innovation: Evidence from Patent Collateral (September 26, 2017). Available at SSRN: http://dx.doi.org/10.2139/ssrn.2356015
Morse, A. (2015). Peer-to-Peer Crowdfunding: Information and the Potential of discruption in consumer lending. NBER Working Paper No. 20899.
Moyen, N. (2004). Investment-cash flow sensitivities: Constrained versus unconstrained firms.
Journal of Finance, 59(5), 2061–2092.
Özbuğday, F. C., Fındık, D., Metin Özcan, K., & Başçı, S. (2020). Resource efficiency investments and firm performance: Evidence from European SMEs. Journal of Cleaner
Production, 252.
Petersen, M. A., & Rajan, R. G. (1997). Trade Credit: Theories and Evidence. Source: The
Pierrakis, Y. and L. Collins (2013). Banking on each other. Peer–to–peer lending to business: Evidence from Funding Circle, Nesta working paper.
Pope, D., and Sydnor, J. (2011). What’s in a Picture? Evidence of Discrimination from Prosper.com. Journal of Human Resources, 46(1): 53-92.
Ravina, Enrichetta (2019). Love & Loans: The Effect of Beauty and Personal Characteristics in Credit Markets (February 15, 2019). Available at SSRN:
http://dx.doi.org/10.2139/ssrn.1101647
Rosenbaum, P. R., & Rubin, D. B. (1983). The central role of the propensity score in observational studies for causal effects. Biometrika, 70(1), 41–55.
Rosenbaum, Paul R., and Donald B. Rubin. (1985). Constructing a control group using multivariate matched sampling methods that incorporate the propensity score. The American Statistician 39(1): 33-38.
Stuart, Elizabeth. (2010). Matching Methods for Causal Inference: A Review and a Look Forward. Statistical science : a review journal of the Institute of Mathematical Statistics. 25. 1-21.
Vallee, Boris and Zeng, Yao (2018). Marketplace Lending: A New Banking Paradigm?, Paris December 2018 Finance Meeting EUROFIDAI - AFFI.
Wiersch, A. M., B. J. Lipman and B.Barkley (2016). New Insights on Online Lender Applicants from the Small Business Credit Survey, Federal Reserve Bank of Cleveland
Zhang, B., T. Ziegler, K. Garvey, S. Ridler, N. Yerolemou and R. Hao (2017). Entrenching innovation. 4th UK Alternative Finance Industry Report, Cambridge Centre for Alternative Finance.
Zhang, B. T. Ziegler, L. Mammadova, D. Johanson, M. Gray and N. Yerolemou (2019). 5th UK Alternative Finance Industry Report, Cambridge Center for Alternative Finance
Ziegler, T., R. Shneor, K. Wenzlaff, A. Odorović, D. Johanson, R. Hao, L. Ryll (2019). The 4th European Alternative Finance Benchmarking Report
Table 1 : Variable definition
Variable Definition
Crowd Dummy variable that takes value of one if firm receives loans from lending-based crowdfunding platforms and zero otherwise
Leverage Ratio of total debt to total assets
Current Ratio Ratio of current assets (up to 1 year) to current liabilities (up to 1 year).
Asset Turnover Ratio of net sales to total assets.
ROE Return on Equity is a ratio of net income to shareholder’s equity.
ROA Return on Assets (ROA) is a ratio of net income to total assets.
Net Profit Margin Net profit margin calculated as the ratio of net income to total revenue
Interest Rate Ratio of firm’s total financial charges by its total debts
ICR Interest Coverage Ratio defined as the ratio of earnings before interest and taxation to interest paid
Size Logarithm of total assets
Age The number of years elapsed since firm’s establishment year
Asset Growth Sales Growth Wage Growth Net Trade Credit to Sales
Ratio of asset changes calculated by subtracting asset’s current value from the last year value divided by the value of the last year.
Ratio of Sales changes calculated by subtracting sales current value from the last year value divided by the value of the last year.
Ratio of wage changes calculated by subtracting wage current value from the last year value divided by the value of the last year.
Net trade credit to sales is calculated by dividing the difference between account payable and account receivable to net sales
Turnover Growth Ratio of Turnover changes calculated by subtracting turnover’s current value from the last year value divided by the value of the last year.
Tangible Assets Assets with physical form and finite monetary value. It defined as sum of lands, buildings, plants & equipment and other tangible assets scaled by total assets.
Intangible Assets Risky Debt
Assets without physical presence which are sum of patent, goodwill and other intangible assets scaled by total assets.
Dummy variable that takes value of 1 if ICR is equal or less than 3 and zero otherwise (According to the French Financial Stability Council, ICR below three indicates risky debt)
Balance sheet Ratios: Land Value of land divided by total assets
Buildings Value of buildings divided by total assets
Plant & Equipment Value of plant & equipment divided by total assets
Other Tangible assets Value of the tangible assets excluded lands, buildings and plants & equipment divided by total assets
Patent Value of patent divided by total assets
Goodwill Value of goodwill divided by total assets
Other Intangible Assets
Value of intangible assets excluded patent and goodwill divided by total assets
Cash & MKT Sec Sum of cash and marketable securities divided by total assets
Receivable to Sales Value of account receivable divided by net sales
Inventory Value of inventory divided by total assets where inventory is defined as sum of raw materials, work in process, service in process, semi-finished and finished goods and goods for sale
Bank Borrowing Amount of bank loans divided by total assets
Payable to Sales Value of account payable divided by total assets
Other Borrowing Amount of borrowing excluded bank borrowing and account payables and included taxes, debts to suppliers, convertible loans, other debenture loans and other borrowings divided by total assets
Share Capital Value of Share capital divided by total assets
Balance sheet Growth: Investment
Balance Sheet Variables Growth
Growth of Fixed assets calculated by subtracting fixed asset’s current value from the last year value divided by the value of the last year.
Growth of balance sheet variables calculated by subtracting balance sheet variables’ current value from the last year value divided by the value of the last year.
Industry Dummy:
We introduce industry dummy variables using Eurostat guideline based on NACE Rev.2. for compiling aggregates related to each industry.
Services Dummy variable that classifies firms operate in service industry
Low Technology Dummy variable that Classifies firms operate in low-tech industry
Knowledge Intensive Services
Dummy variable that Classifies firms operate in Knowledge Intensive Services industry. Knowledge Intensive Services are services and business operations heavily reliant on professional knowledge. They are mainly concerned with providing knowledge-intensive support for the business processes of other organizations. As a result, their employment structures are heavily weighted towards scientists, engineers and other experts.
High-Tech Knowledge Intensive Services
Dummy variable that Classifies firms operate in High-Tech Knowledge Intensive Services industry.
Financial Knowledge Intensive Services
Dummy variable that Classifies firms operate in Financial Knowledge Intensive Services industry.
Other Knowledge Intensive Services
Dummy variable that Classifies firms operate in Knowledge Intensive Services industry excluded High-Tech and Financial.
Manufacturing Dummy variable that Classifies firms operate in Manufacturing industry.
Trade Dummy variable that Classifies firms operate in Trade industry.
Agriculture Dummy variable that Classifies firms operate in Agriculture industry.
Table 2. Descriptive Statistics
Mean t-test Min Max SD
Variables Firms that do not borrow via
platform
Firms that borrow via
platform difference Mean Full Sample
Age 11.60 6.71 4.89*** 0.00 116.00 12.56
Size 6.82 7.25 -0.43*** 1.39 11.05 1.81
ROA 4.80 5.77 -0.98 -186.76 176.59 34.67
ROE 0.16 0.26 -0.09** -2.47 2.93 0.57
Net Profit Margin 0.03 0.05 -0.02*** -13.00 0.92 1.56
Asset Turnover 1.73 1.54 0.18** 0.00 7.77 1.45
Tangible 0.15 0.12 0.03** 0.00 0.95 0.22
Building 0.09 0.05 0.04*** 0.00 1.33 0.23
Land 0.01 0.00 0.01*** 0.00 0.26 0.04
Plant & Equipment 0.13 0.10 0.03* 0.00 1.33 0.24
Other Tangible 0.20 0.14 0.05*** 0.00 2.03 0.37 Intangible 0.11 0.14 -0.03* 0.00 0.85 0.21 Patent 0.01 0.03 -0.01** 0.00 0.37 0.05 Goodwill 0.10 0.09 0.00 0.00 0.85 0.21 Other Intangible 0.01 0.01 -0.01 0.00 0.44 0.06 Current Ratio 3.56 1.86 1.69*** 0.04 54.97 7.58
Cash & MKT Sec 0.22 0.08 0.14*** 0.00 0.93 0.24
Receivable to Sales 0.19 0.25 -0.05** 0.00 2.41 0.32 Inventory 0.10 0.13 -0.02* 0.00 0.74 0.16 Bank Borrowing 0.12 0.16 -0.04*** 0.00 0.94 0.21 Payable to Sales 0.15 0.15 0.00 0.00 24.00 2.68 Other Borrowing 0.00 0.00 0.00*** 0.00 0.16 0.02 Interest Rate 0.02 0.02 -0.01** 0.00 0.46 0.05 ICR 63.98 44.06 19.92*** -47.00 892.67 121.86 Risky Debt 0.09 0.06 0.03 0.00 1.00 0.23
Net Trade Credit to Sales -0.05 -0.10 0.04* -1.51 8.00 0.93
Share Capital 0.12 0.11 0.02 0.00 1.50 0.25
Wage Growth 0.19 0.58 -0.39* -0.88 14.00 1.66
Plant & Equipment Growth 0.10 0.12 -0.01 -0.67 4.00 0.51
Goodwill Growth 0.00 0.00 0.00* -0.08 0.08 0.02
Payable Growth 0.26 0.51 -0.24* -0.88 9.69 1.35
Receivable Growth 0.53 1.23 -0.70* -0.94 21.00 2.62
Bank Borrowing Growth 2.88 2.35 0.53 -0.98 142.00 16.19
Debt Growth 0.10 0.27 -0.17** -0.78 6.00 0.80
Share Capital Growth 0.06 0.10 -0.03 -0.03 4.11 0.46
Asset Growth 0.09 0.24 -0.15*** -0.58 3.23 0.47 Investment 0.11 0.23 -0.11*** -0.54 3.30 0.45 Intangible Growth 0.20 0.59 -0.39* -0.78 11.00 1.28 Tangible Growth 0.30 0.35 -0.04 -0.77 16.00 2.02 Inventory Growth 0.19 0.41 -0.22* -0.89 9.00 1.10 Patent Growth 0.11 0.25 -0.14* -0.71 5.00 0.62 Sales Growth 0.20 0.37 -0.17 -0.90 19.64 2.12 Building Growth 0.11 0.18 -0.06 -0.44 8.00 0.86 Land Growth 0.01 0.00 0.01 0.00 0.75 0.08
Other Debt Growth 0.00 -0.01 0.01 -0.29 0.47 0.09
Cash & MKT Sec Growth 1.11 2.01 -0.91* -0.97 35.25 4.46
Other Intangible Growth 0.06 0.11 -0.05 -0.80 5.00 0.57
Other Tangible Growth 0.22 0.28 -0.07 -0.82 8.69 1.08
Interest Rate Growth 0.00 0.00 0.00 -0.18 0.28 0.04
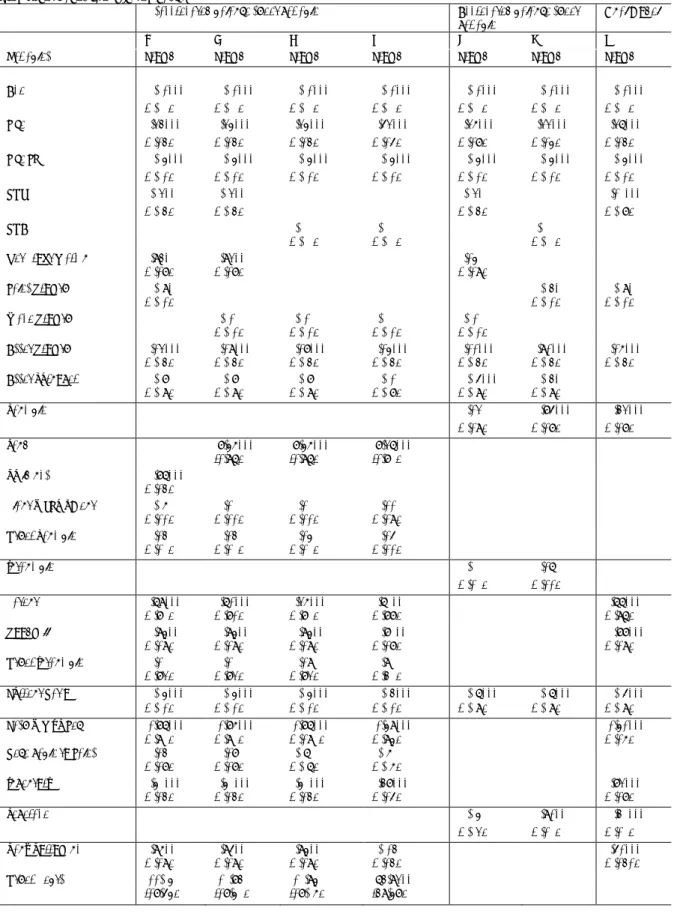
Table 3. Correlation matrix
Age Size ROA ROE Net Profit
Margin Asset Turnover Tangible Building Land Plant & Equipment Other Tangible Intangible Patent Goodwill Other Intangible
Age 1.00
Size 0.20 1.00
ROA 0.00 -0.01 1.00
ROE -0.05 0.00 0.09 1.00
Net Profit Margin 0.02 0.08 0.72 0.07 1.00
Asset Turnover 0.01 0.31 -0.09 0.07 0.01 1.00
Tangible 0.03 -0.14 -0.10 0.01 -0.09 -0.16 1.00
Building 0.14 -0.08 -0.04 -0.02 -0.05 -0.16 0.63 1.00
Land 0.07 -0.05 -0.02 -0.02 -0.03 -0.18 0.47 0.51 1.00
Plant & Equipment 0.15 0.06 -0.05 -0.02 -0.01 0.06 0.34 0.07 0.03 1.00
Other Tangible 0.09 -0.08 -0.08 0.02 -0.03 0.22 0.29 -0.06 -0.06 0.09 1.00 Intangible -0.10 -0.13 -0.02 0.01 0.02 -0.10 -0.17 -0.14 -0.12 -0.11 -0.01 1.00 Patent -0.02 0.03 -0.04 -0.01 -0.03 0.01 -0.07 -0.05 -0.05 0.00 0.01 0.09 1.00 Goodwill -0.09 -0.12 -0.01 0.02 0.02 -0.08 -0.16 -0.12 -0.11 -0.09 0.01 0.93 -0.07 1.00 Other Intangible -0.02 0.00 -0.02 -0.01 -0.01 -0.05 -0.05 -0.03 -0.03 -0.03 -0.01 0.17 0.08 -0.05 1.00 Current Ratio 0.00 -0.21 0.15 -0.03 0.03 -0.27 0.03 0.08 0.08 -0.05 -0.12 -0.13 -0.06 -0.13 -0.01
Cash & MKT Sec 0.04 -0.05 0.07 0.04 0.07 0.03 -0.16 -0.11 -0.10 -0.05 0.00 -0.16 -0.02 -0.15 -0.02
Receivable to Sales -0.04 -0.08 -0.03 -0.04 -0.09 -0.26 -0.13 -0.07 -0.01 -0.06 -0.16 -0.19 0.04 -0.20 0.02 Inventory 0.09 0.06 -0.07 -0.02 -0.02 0.25 -0.18 -0.09 -0.08 0.00 -0.01 -0.10 -0.04 -0.08 -0.06 Bank Borrowing -0.10 -0.23 -0.04 0.04 -0.05 -0.15 0.47 0.25 0.16 0.10 0.11 0.18 -0.04 0.17 0.01 Payable to Sales -0.02 -0.09 -0.12 -0.01 -0.18 -0.10 -0.01 -0.01 0.00 -0.02 -0.04 -0.03 0.02 -0.04 0.02 Other Borrowing -0.04 -0.19 -0.09 0.01 -0.10 0.14 0.01 -0.01 -0.02 0.03 0.12 -0.01 0.05 0.00 0.00 Interest Rate -0.04 -0.13 -0.06 -0.05 -0.14 -0.13 -0.02 0.01 0.01 -0.05 -0.06 -0.03 -0.01 -0.03 0.01 ICR 0.02 0.25 0.11 0.07 0.11 0.08 -0.17 -0.10 -0.07 -0.05 -0.07 -0.11 0.02 -0.11 -0.01
Net Trade Credit to Sales 0.01 -0.03 -0.12 0.02 -0.14 0.06 0.08 0.04 0.01 0.02 0.07 0.10 0.00 0.09 0.01
Share Capital -0.02 -0.10 -0.07 -0.09 -0.13 -0.09 -0.04 0.02 0.03 0.02 0.00 0.00 0.06 0.00 0.03
Wage Growth -0.07 -0.04 0.00 0.04 -0.02 -0.03 0.01 -0.02 -0.01 -0.04 -0.03 -0.01 0.01 -0.01 0.01
Asset Growth -0.07 0.01 0.04 0.09 0.02 -0.06 -0.03 -0.07 -0.03 -0.08 -0.09 -0.06 -0.01 -0.07 0.00
Sales Growth -0.07 -0.05 -0.06 0.05 -0.10 -0.06 0.06 0.00 0.01 -0.03 -0.04 -0.02 0.01 -0.03 0.01