HAL Id: halshs-00973926
https://halshs.archives-ouvertes.fr/halshs-00973926
Submitted on 4 Apr 2014HAL is a multi-disciplinary open access archive for the deposit and dissemination of sci-entific research documents, whether they are pub-lished or not. The documents may come from teaching and research institutions in France or abroad, or from public or private research centers.
L’archive ouverte pluridisciplinaire HAL, est destinée au dépôt et à la diffusion de documents scientifiques de niveau recherche, publiés ou non, émanant des établissements d’enseignement et de recherche français ou étrangers, des laboratoires publics ou privés.
The unsolved contradictions of the modernists.
Economic policy expectations and political crisis in
France 1978-2012
Bruno Amable
To cite this version:
Bruno Amable. The unsolved contradictions of the modernists. Economic policy expectations and political crisis in France 1978-2012. 2014. �halshs-00973926�
Documents de Travail du
Centre d’Economie de la Sorbonne
The unsolved contradictions of the modernists. Economic
policy expectations and political crisis in France 1978-2012
Bruno A
MABLEThe unsolved contradictions of the modernists
Economic policy expectations and political crisis in France 1978-2012 Bruno Amable
University of Paris I Panthéon – Sorbonne & Institut universitaire de France March 2014
Abstract:
This paper analyses the French political crisis since the late 1970s by investigating the links between the social structure and the economic policy expectations of the electorate. To this end, data on post-electoral survey are used to estimate structural models of political support to political parties for 1978 and 2012, and the estimation results are used to propose an analysis of the French crisis. The enduring French political crisis is found to be the expression of contradictions between the economic policies implemented by the successive governments and the existence of a dominant social bloc, i.e. a coalition of social groups that would politically support the dominant political strategy. Since 1978, both the right and the left have failed to find a solution to the contradictions between the policies they implemented and the expectations of their social bases, which are themselves inhabited by tensions and contradictions that evolve with the structure of French capitalism. The failure of all governing coalitions so far is a new expression of that of the
ode ists to take i to a ou t the e pe tatio s of the popula lasses. Keywords: France, political crisis, political economy, social base,
Résumé:
Ce papier analyse la crise politique française depuis la fin des années 1970 en étudiant les liens entre la st u tu e so iale et les atte tes de politi ue é o o i ue de l éle to at. A ette fi , les do ées post-électorales sont utilisées pour estimer deux modèles structurels de soutien aux partis politiques pour 1978 et 2012. Les résultats des estimations éclairent les raisons de la crise politique. Celle-ci est l e p essio des o t adi tio s e t e les politi ues sui ies pa les gou e e e ts su essifs et l e iste e d u e ase so iale sta le, d u lo so ial do i a t, une coalition de groupes sociaux qui valideraient politiquement la stratégie politique dominante. Depuis 1978, la droite et la gauche ont é houé da s leu e he he d u e solutio à es o t adi tio s, e t e les politi ues u elles souhaitaient mener et les attentes de leurs bases sociales, qui sont elles-mêmes traversées par des tensions et contradictions qui évoluent avec la structure du capitalisme français. Cet échec est une manifestation du retour des insuffisances de la stratégie des « modernistes » et de leur refus de prendre en compte les attentes des classes populaires.
Mots-clés : France, crise politique, économie politique, base sociale
1. Introduction
At the time of the 1978 legislative elections, France had been governed by a right government coalition for 20 years. Following the first oil shock, GDP growth had slowed down from a 5.4% annual average between 1950 and 1973 to 3% for the 1974-1978 period, and unemployment had risen above 4%. The political and economic leaders were gradually changing their views on the economic situation, which was no longer perceived as a temporary slowdown due to energy price increases, but more as the entry into a new era characterised by increased competition and diminished expectations. The choice offered to the electorate could be summarised as an opposition between two types of economic policy and structural reform programs. On the left, a political alliance (union de la gauche), in spite of having broken up a year before and been awkwardly mended between the first and the second round of the elections, was still the main reference for a possible government coalition. The joint manifesto (programme commun) proposed a series of economic reforms based on the nationalisation of the bulk of manufacturing industry and banks, the development of industrial democracy and social protection, and a macroeconomic policy supporting income and effective demand growth. The ultimate aim was a gradual break-up (rupture) with capitalism (Beaud 1983, 1985). On the right, the main parties (post-Gaullist RPR and UDF) were redefining their economic policy orientations away from the support to effective demand and the search of external competitiveness through devaluations, towards wage austerity and the restoration of fi s profit margins, currency stability the st o g F a poli , the fight against inflation and the decrease in state intervention, opposing the economic and social transformations of the
programme commun. The right parties, in spite of an open rivalry between their respective leaders,
kept their joint participation in a government coalition as a political objective without any credible alternative.
The environment of the presidential and legislative elections of 2012 could be described in very different terms. Since the late 1970s, left and right governments had succeeded one another and the growth trend had kept decreasing (1.8% on average for 1979-2012); the unemployment rate had climbed over 9% since the Great Recession. For the first time since the late 1960s, the main party of the left, the parti socialiste (PS) had entered the electoral competition without any predefined electoral alliance associating other parties on its left.1 Furthermore, it promoted as one of its main
economic policy objectives the return to sound public finance ─ a budget deficit under the 3% mark within one year and a balanced budget after 5 years ─ in order to regain the lost AAA credit rating. The realisation of the modest social part of the program was conditioned on improved macroeconomic performance. The right had become highly heterogeneous. The mainstream government parties RPR and UDF, which had merged to form the UMP, proposed a more or less moderate neoliberal policy orientation, the moderation aspect having been stressed after the Great Recession. But the UMP faced competition for the right electorate coming from: (i) the nationalist right party (Front National, FN), with an economic program blaming austerity imposed by Europe and the financial markets, and advocating the exit from the Euro to save the social protection system; (ii) the centre-right MoDem, which proposed labour market liberalisation and large cuts in public expenditure.
How can this significant change in the economic policy and political landscape be analysed? The change was particularly dramatic for the left. The main options of its economic program in the 1970s, such as nationalisations or the extension of social protection, were no longer present. Public finance orthodoxy and the restoration of i esto s o fide e, traditional themes for the right, had become predominant, and new topics, such as the preservation of the environment, had emerged.
1 The communist party had either participated to previous left governments or supported the PS-led
One could argue that enduring mass unemployment, slow growth and increasing economic integration would impose a pressure to adapt to a new type of capitalism and that the economic policy style and economic institutions inherited from the post-war period would no longer be fitted to a new environment dominated by a rapid technological change and intensified international competition (Sapir 2004). This would make the economic policy expectations carried by the traditional left social base at the end of the 1970s impossible to satisfy, all the more so that this social base would be weakened by deindustrialisation and fragmented by individualisation. One could mention an abundant literature derived from Inglehart (1977, 1990, 1997) that explains such changes by the rise of post-materialist issues, as a consequence of the increase in income and wealth levels in developed countries. These transformations would imply a redefinition of the political competition away from the issues related to the distribution of material resources and class conflict, as well as a decline of the left-right divide based on the economic dimension.
However, the political difficulties experienced by all incumbent governments, the instability of the political party structure or the rejection in 2005 by 55% of the voters ─ 79% of the workers vs. 35% of the high-skilled─2 of a European Constitutional Treaty supported by all mainstream parties,
suggest that the trouble for the political supply to adjust to ote s e pe tatio s is ot the e lusi e of the left, and that one witnesses neither the total disappearance of class voting nor a smooth transition to a new socio-political equilibrium.
A simple explanation would directly relate the political crisis to the economic situation. Indeed, since the 1970s, the growth slowdown, the constraints on public finance and the increase in unemployment have made the definition and the implementation of an economic policy more difficult, particularly since the Great Recession. But the postulate of a direct influence of the macroeconomic performance on political stability is in contradiction for instance with the failure of Lionel Jospin at the 2002 presidential election, after a term characterised by improved public finance and a significant drop in unemployment due to a more rapid growth.3
The basic postulate adopted in what follows is that the problems met by left as well as right government parties for the past three decades are linked to the impossibility to find a dynamic compatibility between on the one hand a stable social base and on the other hand an economic policy and structural reform program. The diversity of expectations among social groups and the constraints of the institutional and economic environment have made it impossible to find a mediation that would be supported by a sufficiently large socio-political coalition, a dominant social bloc (Amable and Palombarini 2009). The existence of contradictions between an economic modernisation strategy and the stability of a certain social structure has been a recurring problem in post-War France. To a large extent, the problems characterising contemporary France are similar to those et the ode ists in the post-War period (Gauron 1983), who failed to solve the contradictions between the consequences of the modernisation of economic structures and their will to limit the political power of the popular classes.
The analysis of the political crisis requires an investigation of the links between social structures and the economic policy expectations of the electorate, and of the influence of these on the potential political support of political parties. To this end, data on post-electoral survey are used to estimate structural models of political support to political parties for 1978 and 2012, and the estimation results are used to propose an analysis of the French crisis.
This paper is organised as follows. Section 2 exposes the main elements of the ongoing French political crisis. Section 3 presents the data and models used in the empirical estimations. Section 4 discusses the results of the estimation. Section 5 analyses the causes of the political crisis in the light of these results. Section 6 considers the attempts of the mainstream parties to deal with the
2
Post-electoral poll, ISPSOS, http://www.ipsos.fr/ipsos-public-affairs/sondages/referendum-29-mai-2005-sondage-sorti-urnes
crisis and find stable social bases, in particular the modernist strategy. Section 7 concludes on the unsolved contradictions of the modernist strategy.
2. The ongoing French political crisis
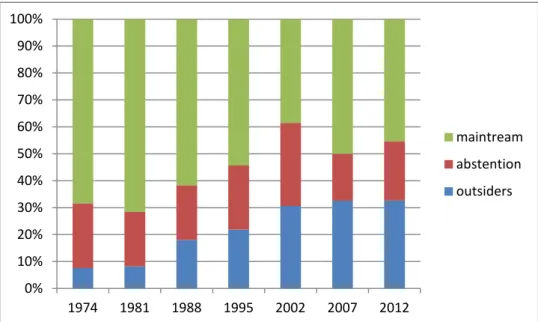
There are many signs of the existence of an enduring French political crisis, defined as the vanishing of the space for mediation between the divergent expectations of the social groups that constitute the dominant social bloc (Amable and Palombarini 2009). All incumbent governments have failed to be re-elected after 1978. The two cases where one right government followed another were the expression of internal divisions and the manifestation of a craving for change: (i) an almost centre-left Chirac protecting the welfare state against the conservative Balladur and his neoliberal policy in 1995; (ii) Ni olas “a koz s p og a of rupture ith the alleged i o ilit of Chi a s presidency in 2007. Also, since 1981, the electoral score at the French presidential election of outside s , defi ed as a didates ith o o ete p ospe t fo e te i g a go e e t oalitio o outside of the left and right mainstream parties,4 has considerably increased. Whereas they jointly obtained the support of 7.5% of the registered voters in 1974 and 8.2% in 1981, their combined score rose from 18% in 1988, to 32.6% both in 2007 and 2012 (Figure 1).5 In 2002, an outsider, Front
Nationals a didate Jea -Marie Le Pen, even reached the second round of the election while the
former Prime Minister Lionel Jospin, candidate for the main party of the left (the PS), failed to do so.
Figure 1. Vote distribution at the first round of the presidential elections in percent of registered voters. Data source: Minist e de l’I t ieu .
The emergence of new parties and the decline of the old ones is not by itself a sign of political crisis. It could be the consequence of structural change taking place in French society: the
4 Until 1988, apart from marginal candidates, such as Bertrand Renouvin, a royalist candidate who obtained
0.17% of the votes in 1974, the bulk of the outsider votes went to the trotskyist and ecologist candidates. After the emergence of the Front National during the 1980s, the scores of Jean-Marie Le Pen dominated the outsider category until 2007. After that date, another category of outsiders became prominent: candidates who quit the respective government parties they belonged to form their own parties and, willingly or not, stayed outside of the mainstream left and ight allia es: F a çois Ba ou s MoDem at the Centre and Jean-Lu Méle ho s
Front de Gauche4 (FdG) on the left for instance. The ecologists evolved in the opposite direction, from the
outsider to the insider category, after their participation to the PS-led government coalition in 1997
5If o e adds a ste tio , the suppo t to ai st ea pa ties a didates has ee u de % of the egiste ed
voters since the early 2000s, reaching a low of 38.5% in 2002. 0% 10% 20% 30% 40% 50% 60% 70% 80% 90% 100% 1974 1981 1988 1995 2002 2007 2012 maintream abstention outsiders
increase in income, wealth or education levels, deindustrialisation and the growth of the service economy, or any other social or economic change that would have for consequence the decline of some political demands and the emergence of new expectations, or the waning of traditional social coalitions either on the left or on the right. But other signs prove the existence of a crisis. Most new parties have been kept outside of the government coalitions. Elected presidents lose popularity at an increasing rate. It took nearly 11 years to Jacques Chirac (1995-2007) to reach a level of confidence of 20%, four years to Sarkozy (2007-2012) and a little over 18 months to Hollande (2012-). Such a low level was never even approached by any of their predecessors.6 All these elements reveal the
difficulty to find a political equilibrium with a defined economic strategy supported by a stable social base. Turning to the main episodes of economic policy choices sheds a light on the difficulties that political supply has had to adjust to political demand.
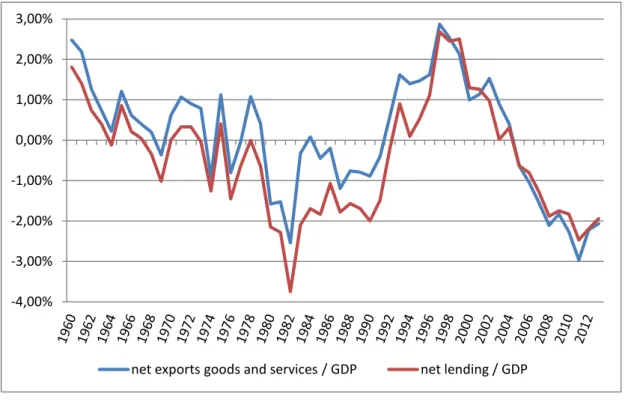
After the 1981 victory, the left coalition government implemented a Keynesian-type economic policy fuelled by real wage7 and social benefits8 increases as well as public expenditure. Taking place at the worst of time, when the US and the other OECD countries implemented recessive policies to fight inflation, the French attempt to sustain economic growth led to a dramatic increase in the external deficit (Figure 2) and failed to curb unemployment (Figure 3). The Franc was devalued in October 1981 and June 1982, and de facto devalued by the re-evaluations of the Deutsche Mark and the Dutch Gulden in March 1983.
Figure 2. External balances. Data source: INSEE
At the sa e ti e, the ai fi s p ofessio al asso iatio , the CNPF, lau hed a a paig for a reorientation of the economic policy, demanding a drop in social contributions and a weakening of the Auroux laws on industrial democracy. The worsening of the economic situation and the will not to antagonise private firms9 in order to foster investment led to a gradual reorientation of
6 Figures from TNS-Sofres, http://www.tns-sofres.com/cotes-de-popularites. 7 The minimum wage was raised by 10% in 1981.
8
Family benefits were increased by 50%.
9
The will of the new PS-led go e e t to fi d a histo i al o p o ise ith p i ate fi s as p o lai ed F a çois Mitte a d i De e e : Pu li autho ities a d fi s’ a age s should ot e oppo e ts ut
partners. We e p. -4,00% -3,00% -2,00% -1,00% 0,00% 1,00% 2,00% 3,00%
economic policy in 1982, and eventually to the U-turn of 1983. The focus shifted to pegging the French Franc to the Deutsche Mark, promoting wage moderation, reducing public deficits and reorienting structural policy towards the creation of a business-friendly environment (Lordon 1997). This U-turn, often presented as an awakening to economic realities (Olivennes 1993) or a consequence of the necessity to implement a supply-side-oriented policy because of the external constraint (Sachs and Wyplosz 1986) was also a defeat inflicted to the economic and social policy of the left (Hoang-Ngoc 2005) that had negative consequences on the social support of left parties and led to the electoral defeat of 1986.10 This line of economic orthodoxy, later presented as a choice in
favour of European integration, was followed with varying degree of strictness by all following left governments (1988-1993 and 1997-2002), with the same electoral consequences.11
Figure3. Unemployment rate. Data source: INSEE
Anothe episode of failed ele to ate s e pe tatio s took pla e ith the right. In the 1995 p eside tial a paig , Ja ue Chi a s ai i al elo ged to the same party and was Prime Minister Edouard Balladur. The latte s economic policy was based on a mix of orthodox macroeconomics and neoliberal structural reforms. Capitalising on social discontent, Chirac adopted as the main theme for his campaign the necessity to fight growing inequalities (the fracture sociale). But whereas the electoral promise was to a s e to the popula disa a that th eate ed the ou t s u it ,12
Jacques Chirac, once elected, promoted the return to sound public finance and the reduction of so ial p ote tio defi its as his go e e t s ai o je ti es. Once again, this U-turn, commonly p ese ted as the e essit to i o po ate i the go e e t s p io ities the e o o i ealities a d the external constraint,13 had negative electoral consequences.
Coming back to power in 1986, the right had radicalised its economic policy stance. Its economic program had already taken a neoliberal turn after 1978, to the point that the theme of the
10 The PCF left the government in 1984 but maintained its support.
11 Although Lionel Jospin considered that the economic and social policy when he was Prime Minister
(1997-2002) represented a break-up with the U-turn of 1983. This is only partly true (Askenazy 2011), and the electorate did not concur.
12 Interview in the Nouvel Observateur, 12-18 January 1995 13
The dominant view was expressed in a report to the Prime minister (Balladur). Every national project must be ealised taki g i to o side atio a o ld that i poses its o h th a d e olutio : same as every other
country, France must adjust Mi , , p. . The sa e idea as e p essed Ja ues Delo s a de ade
before (Alexandre and Delors 1985, chapter 1). 3 4 5 6 7 8 9 10 11
last speech of Vale Gis a d d Estai g fo the p eside tial a paig of as less state (Giscard d Estai g , in opposition not only to the supposedl dirigiste sta e of the post-War French economic policy, ut also the i o-dirigisme practiced during his own mandate.14 The influence of
the o se ati e e olutio i the UK a d the U“ ith Margaret Thatcher and Ronald Reagan was also present. Jacques Chirac had p o ised a athe utal eak-up15 with the economic policy previously implemented and the French economic model in general. Once elected, he launched a series of significant neoliberal reforms (Amable et al. 2012a) such as privatisations and labour market liberalisation. However, the hard line adopted by the right government antagonised so much the majority of the electorate, including a fraction of the social base of the right (Amable et al. 2012b), that the left came back to power after only two years.
The Balladur government also lasted two years (1993-1995) and faced a considerable opposition on the streets when it tried to implement reforms promoting labour market flexibility, in particular for the under-26.16 The following Juppé government also faced at the end of 1995 the most important social protest movement since 1968 when it tried to reform the pension system. In 2007, Ni olas “a koz as ele ted ith a p og a e of rupture that sti ed the e thusias of the supporters of a neoliberal turn in France and abroad.17 But the rupture proved to be more moderate
than promised and by 2008, Ni olas “a koz s a itio as o lo ge to t a sfo the F e h odel in a neoliberal way but to oppose the idea that markets were always right and call for a moralisation of capitalism.18 The most severe economic crisis since the Great Depression had, at least temporarily, made the neoliberal project infeasible (Amable et al. 2012b) and Sarkozy had to build up compromises in order for some of the structural reforms to succeed (Amable and Palombarini 2014).19
The governments of the past four decades have experienced serious difficulties in meeting the expectations of the electorate. The left governments (1981-1986, 1988-1993, 1997-2002) promoted poli ies of age ode atio a d sou d pu li fi a e which failed to satisfy the expectations of their social base for a left economic policy. The right governments have been perceived as too extreme in their attempts to implement neoliberal reforms (1986-1988, 1993-1995), or too tame (2002-2007), leadi g to a usatio s of i o ilit , or successively too adventurous and too cautious (2007-2012). In every case, the governing coalitions of the left and the right did not find how to implement an economic policy and structural reforms that would create their own social support.
In order to analyse the reasons for the lack of support for the different economic policies followed by the successive governments for the past 30 years, it is necessary to turn to the expectations of the electorate and the structure of political demand.
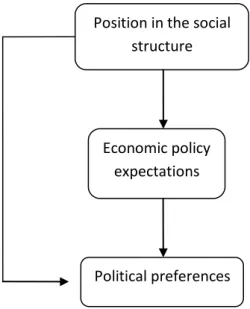
3. From social structure to political preferences
In order to analyse the political demand, the simple theoretical framework represented in Figure 4 will be adopted. An i di idual s position in the social structure is assumed to influence her or
14Ma age s a used the ad i ist atio u de ‘a o d Ba e s go e e t to i te e e i the da -to-day
management decisions of private firms in spite of having reduced macro-level dirigisme. (Weber 1986, pp.252-253)
15 Radio interview, Grand Jury RTL-Le Monde, 5 May 1984.
16 The attempt to introduce a labour contract for the under-26s that would derogate to the protections of the
standard contract and include a wage under the minimum legal level.
17 E.g. The Economist (12 April 2007): F a e s ha e. Afte a ua te -century of drift Nicolas Sarkozy offers
the est hope of efo .
18
Speech in Toulon, 25 Spetember 2008.
19 Sarkozy fended off accusations of immobility by blaming the esista e of i te ediate odies t ade
his expectations with respect to economic policy. These in turn determine the political preferences and the degree of support to the different parties. One can also take into consideration the direct effect of the social position on the political preferences, representing support not mediated by policy expectations. For the purpose of the empirical investigations, the structure represented in Figure 4 defines a recursive model which will be estimated by structural equation modelling techniques.
The data used in the analysis come from two sources: the French post-electoral survey for 1978 (BDSP 1978) and the French electoral study for2012 (Sauger, 2012). The latter is a post-election survey made during the 2012 elections comprising 2014 interviews, representative of the French population registered on the electoral roll. The former is the post-electoral study made in 1978 and has data for 4456 individuals.
Figure 4. From social structure to political preferences
The questionnaires of the two surveys are not identical but possess sufficient common elements to have a comparable structure for 1978 and 2012. The position in the social structure will be mainly determined by six types of variables: sex, age, occupation, income levels, church attendance and the type of living environment. A few additional variables, specific to a survey, will also be taken into consideration.
Men will be the reference category. Five age brackets will be taken into consideration: 18 to 24, 25 to 34, 35 to 44, 45 to 54 (reference category) and over 55. Occupations will be defined with the help of the INSEE classifications in an almost identical way for the two surveys: farmers (reference category), managers, craftsmen and shopkeepers, skill public sector employees, high-skill private sector employees, medium-high-skill public sector employees, medium-high-skill private sector employees, foremen and technicians, public sector clerks, private sector clerks, service workers; skilled (blue collar) workers, unskilled (blue collar) workers, student, unemployed, retired. For the 1978 survey only, two additional categories could be taken into consideration: specialised workers (a category of unskilled worker executing a simple task in conveyor belt factories) and police and security forces. The level of household income is individualised by dividing it by the squared root of the size of the household in order to account for possible intra-household economies of scale. The survey samples are then divided by deciles, and the first income decile is taken as the reference category. The church attendance variable will separate individuals who attend at least twice a month from the others (reference category). The living environment will separate those who live in a rural area from the others (reference category).
Position in the social structure
Economic policy expectations
Some variables of interest were only available in one of the two surveys. For 1978, the size of the firm in which the individual works is considered: small (under 50 employees), medium (50 to 500 employees, the reference category) and large (over 500 employees). Also, a question asked for the opinion on the future of the type of activity the individual was working in: decline, stability (the reference category) or expansion. For 2012, the wealth level could be taken into account. Five wealth brackets are considered: under 7,000 Euros (reference category), between 7,000 and 75,000 Euros, between 75,000 and 150,000 Euros, between 150,000 and 300,000 Euros and over 3000,000 Euros. Respondents to the 2012 electoral survey are asked whether it would be easy or difficult for them or their partner to find another job should they lose the position they have. When the respondent has answered that it would be difficult or very difficult for her/himself of partner to find a othe jo , the a ia le Household s e plo e t isk takes a alue of o e, a d ze o othe ise. A othe uestio o e s the likelihood of a de ease i household s i o e ithi the e t months. If this is considered very likely or likely, the corresponding risk variable takes the value 1.
The questions relevant for the policy expectations are mostly specific to each survey, but relate to general policy matters (taxes, income redistribution, public services, labour market regulation...) which are common to the two elections. The selection of questions for inclusion as variables in the models are thus based on the consideration of two elements: the relevance for the policy debate at the time of the election (e.g. the issue of nationalisations, a central element of the left economic program in 1978) and the presence of the same or a related question in the questionnaire for the other election (e.g. how positive nationalisations are considered in the 2012 survey).
In the 1978, the respondent is asked how favourable he or she would be to a series of policies. Four answers are possible: totally opposed, rather opposed, rather in favour, totally in favour, which will give as many categorical explanatory variables, ith the athe opposed take as the reference category. The policies concerned are the following: suppressing the advantages of many in order to reduce social inequalities; extending the nationalised sector even if this implies limiting the scope of the private sector; increase taxes to provide free public services (health, transports, school, etc.); limit the increase in your standard of living in order to curb inflation; prohibit any firing as long as an alternative job is not guaranteed; the establishment of foreign firms in France. Another question asks whether the suppression of the right to strike would be grave. Four answers are here again possible, according to the degree of gravity. I di iduals fi di g it athe g a e ill e the efe e e ategory.
In 2012, four degrees of appreciation of the nationalisations are considered, from very negative to very positive. Fai l egati e ill e the efe e e atego . For the opposition to the single employment contract,20 four answers from totally favourable to totally opposed are available.
Rathe opposed ill fo the efe e e atego . An important social protection reform of the Sarkozy presidency concerned the pensions. The reform led to a significant union-led contestation in autumn 2010 and one electoral promise of PS candidate François Hollande was to partially reverse it. One question of the survey asked the respondent to appreciate the fairness of the reform, grading it between 0 and 10. For all variables of that type, the grade itself will be the explanatory variable. Two other questions deal with taxation and redistribution. One asks whether the respondent approves or disapproves government intervention to reduce income inequalities. Five answers are possible: totally agree, rather agree, neither agree nor disagree, rather disagree (reference category), totally disagree. Another question asks the degree of approval of an increase in VAT (grading it between 0 and 10). The issue of increasing the VAT in order to finance social protection, allowing for a decrease in social contributions and a drop in the labour cost, had been a debate before and during the
20
The proposition to replace all open-ended and fixed-term contract by a single open-ended contract with diminished protection was made by economists in the early 2000s (Cahuc and Kramarz 2004)and taken up in the respective manifestos for the presidential election of Nicolas Sarkozy (UMP) in 2007 and François Bayrou (MoDem) in 2012.
electoral campaign, opposing Nicolas Sarkozy, who was in favour of it, to the left, opposed to it. Finally three questions ask for the respondent position on strengthening the power of the EU vs. the power of the French state, increasing or decreasing the number of nuclear plants, and increasing or decreasing the number of civil servants. The answers are grades between 0 and 10 for the degree of support to the proposition.
In order to consider possible divides linked to culture and lifestyles, besides those based on economic policy issues, as in the now popular bi-dimensional representation of the political space(Kitschelt, 1993, 1994), variables reflecting social values have been incorporated in the analysis. According to the bi-dimensional view, a new cultural divide, not independent of social structural determinants, opposes authoritarian values and communitarian conceptions of justice to the values of cultural liberalism, internationalism, and gender equality (Bornschier, 2010). This would split the traditional left and right social bases.
In the 1978 survey, a question concerns the possibility for an under-18 girl to take the pill without the consent of her parents. Four answers, from totally opposed to totally favourable were possible. The athe opposed ill e the efe e e atego . Another question asked whether the respondent would prefer to work more in order to earn more money or to work less even if this implies earning less. This question is interesting since the choice to work and earn more will become a very popular presidential campaign slogan for Nicolas Sarkozy in 2007, aimed at the working classes preoccupied with their low purchasing power and taken to appreciate particularly the values of hard work as opposed to laziness. Finally a question asked whether school should give the sense of discipline and effort or form people with an open and critical mind. Categorical variables o espo di g espe ti el the o k o e to ea o e a d fo people ith a ope i d ill be considered.
For 2012, social values are identified with the help of four questions, asking about the approval with the following propositions: homosexual couples have a right to adopt children; in a society, there must be a hierarchy with leaders; the unemployed could find a job if they really wanted to; there are too many immigrants in France. Categorical variables corresponding to approval will be considered.
Political preferences are appreciated with the answer to the question about the degree of sympathy of the respondent for the different political parties. Taking as a dependent variable the degree of sympathy for a party rather than the vote makes it possible to consider the potential support rather than the electoral outcome for a single election. Besides, the response rate to the sympathy question is usually higher than the corresponding rate for questions about the vote. This is particularly true for the 2012 elections where nearly all the respondents (over 97%) have given an answer to the question on the degree of sympathy, whereas only 83% have given an answer on their vote for the first round of the election. The information content of the sympathy question is also higher. Respondents give a grade to all parties whereas the vote goes by definition to one party only. Also, a certain degree of strategic voting for the first round can be expected both on the right and on the left, leading to a certain blurring of the respective social bases of the different parties and a probable underestimation of the potential support of small candidates/parties, the ecologists in 2012 for instance.
Data for the following parties are available for 1978: the parti communiste français (communist party PCF); the parti socialiste unifié (unified socialist party PSU);21 the far left, not a
party but a movement composed mostly of Trotskyite parties; the parti socialiste (socialist party PS); two parties which compose the UDF, the fo atio of P eside t Gis a d d Estai g: the Centre des
21
The PSU represented the so- alled se o d left hose o igi s ould be found in the opposition both to the French colonial wars of the 1950s and to the Soviet Union. It was characterised by an opposition to the u eau atisatio of so iet . Michel Rocard was First Secretary of the PSU between 1967 and 1973, before joining the PS.
democrats sociaux (CDS) and the parti républicain (PR); the rassemblement pour la république
(post-Gaullist party RPR). For 2012, the parties were the Front de Gauche (radical left),22 Europe-Ecologie
les Verts (EELV, ecologists), the PS (mainstream left), the MoDem (Centre), the UMP (mainstream
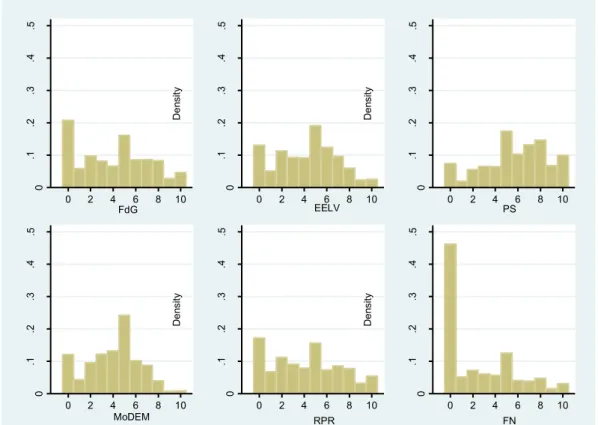
right) and the Front National (FN, radical right). Each party was given a grade between 0 and 6 in 1978 and between 0 and 10 in 2012.
The distributions of grades for each party are featured in Figures 5 and 6. One can notice the o e all good opi io that espo de ts e p ess o the P“ i . O a e age, e t e e pa ties gather more low grades than mainstream parties (e.g. the far left in 1978). This is particularly true for the FN in 2012; nearly half the respondents give the FN a zero grade.
The empirical models for 1978 and 2012 are estimated with the maximum likelihood method, with probit or ordered probit estimations depending on the variable considered. Ordered choices will be taken as categorical variables when they are explanatory variables (e.g. the degree of app o atio of go e e t s i te e tio to edu e i e ualit i the deg ee of s path fo a pa t equations), except when these choices are a grade between 0 and 10. The linearity of the answer scheme makes it acceptable to consider the grade itself and not the grade categories as explanatory variables. Grades will be taken as an ordered choice variable when they enter as dependent variables in the model (e.g. in the equations determining the influence of the social position on the evaluation of the fairness of the pension reform for instance).
The estimation of the model starts with the inclusion of all possible paths, i.e. all possible explanatory variables in every equation. After having estimated the complete models, likelihood ratio tests were performed to check the significance of the various explanatory paths within the model (i.e. the significance of variable coefficients in the model s e uatio s . The successive application of likelihood ratio test led to the rejection at the 5% level of 543 paths for the 1978 model and 588 paths for the 2012 model. This led to more parsimonious and easily interpretable models than the unconstrained models.
22 Strictly speaking not a party but a union of left parties including among others the PCF.
0 .1 .2 .3 .4 .5 0 2 4 6 PCF 0 .1 .2 .3 .4 .5 D e n s it y 0 2 4 6 PSU 0 .1 .2 .3 .4 .5 D e n s it y 0 2 4 6 Far Left 0 .1 .2 .3 .4 .5 0 2 4 6 PS 0 .1 .2 .3 .4 .5 D e n s it y 0 2 4 6 PR 0 .1 .2 .3 .4 .5 D e n s it y 0 2 4 6 CDS 0 .1 .2 .3 .4 .5 0 2 4 6 RPR
Figure 5. Histograms of party grades in 1978.
Figure 6. Histograms of party grades in 2012. 4. Estimation results
Estimation results for the restricted models are presented in Tables 1 to 3 for 1978 and Tables 4 to 6 for 2012. Starting with the sympathy towards political parties in 1978 (Table 1), one notices the existence of a strong divide on economic issues along the traditional left-right opposition: nationalisations, industrial relations and social conflict (the right to strike), income inequalities, austerity and the fight against inflation as well as employment protection. Left positions on these issues were mostly defended by the young, the low and middle incomes, the working classes and public sector employees (Tables 2 and 3). On the other side, one found the support of high incomes, seniors, churchgoers, managers and shopkeepers, high-skill private sector employees and inhabitants of rural areas for right economic policy options. These findings confirm the existence of a traditional class-based support for left and right economic policies respectively. One may also note that the answers to the question on taxes and free public services, although a classical problem in the political economy of public goods,23 very imperfectly reflected this classical opposition. Not only was the
matter hardly relevant to differentiate the support to the different parties, but also the social base for this type of policy was particularly difficult to identify or interpret according to income inequalities (table2).
23 See for instance Bergstrom and Goodman (1973) or Persson and Tabellini (2000), chapter 3.
0 .1 .2 .3 .4 .5 0 2 4 6 8 10 FdG 0 .1 .2 .3 .4 .5 D e n s it y 0 2 4 6 8 10 EELV 0 .1 .2 .3 .4 .5 D e n s it y 0 2 4 6 8 10 PS 0 .1 .2 .3 .4 .5 0 2 4 6 8 10 MoDEM 0 .1 .2 .3 .4 .5 D e n s it y 0 2 4 6 8 10 RPR 0 .1 .2 .3 .4 .5 D e n s it y 0 2 4 6 8 10 FN
PCF PSU Far left PS PR CDS RPR Suppress the advantages of many to reduce social inequalities
Totally in favour 0.167*** (0.048) 0.140*** (0.048) -0.145*** (0.049) -0.152*** (0.050) Broaden and develop the nationalised sector
Totally against -0.166*** (0.064) -0.141** (0.065) -0.431*** (0.059) 0.200*** (0.064) 0.319*** (0.066) Rather in favour 0.446*** (0.061) 0.347*** (0.060) 0.394*** (0.057) 0.414*** (0.055) -0.608*** (0.054) -0.427*** (0.061) -0.532*** (0.062) Totally in favour 0.989*** (0.076) 0.425*** (0.072) 0.713*** (0.068) -0.953*** (0.069) -0.661*** (0.076) -0.758*** (0.077) Raise taxes for free public services
Rather in favour -0.109** (0.054) Totally in favour -0.175** (0.080) Limit your standard of living to curb inflation
Totally against 0.252*** (0.052) 0.169*** (0.050) -0.218*** (0.051) Rather in favour -0.168*** (0.052) 0.201*** (0.050) Totally in favour 0.216*** (0.073) Forbid layoffs until a new job is found
Totally against -0.204** (0.081) -0.213** (0.089) 0.251*** (0.085) Rather in favour -0.286*** (0.065) Totally in favour 0.188*** (0.050) 0.138*** (0.049) -0.241*** (0.049) -0.440*** (0.063) The establishment of foreign firms
Totally against 0.187*** (0.053) Rather in favour -0.164*** (0.056) Suppress the right to strike
Very grave 0.426*** (0.051) 0.371*** (0.055) 0.215*** (0.053) 0.312*** (0.053) -0.396*** (0.050) -0.436*** (0.049) -0.460*** (0.055)
Rather not
grave -0.236*** (0.077) -0.279*** (0.078) 0.310*** (0.080)
Not grave at
all -0.248** (0.105) -0.257** (0.105) -0.390*** (0.104) 0.238** (0.100) 0.272** (0.106) A minor girl could take the pill
Rather agree 0.170*** (0.053) Totally agree 0.116** (0.049) Work more to earn more -0.194*** (0.047) -0.155*** (0.050) 0.248*** (0.048) School should ope people s mind 0.175*** (0.050) 0.282*** (0.049) 0.187*** (0.054) -0.112** (0.051) -0.146*** (0.050) -0.302*** (0.051) Age 18 to 24 0.196*** (0.068) 0.476*** (0.072) -0.138** (0.066) -0.440*** (0.073) -0.259*** (0.071) -0.181*** (0.070) 25 to 34 0.234*** (0.057) -0.216*** (0.058) 35 to 44 0.188*** (0.057) -0.173*** (0.063) Over 55 0.272*** (0.055) Lives in a rural area -0.216*** (0.070) Churchgoer -0.395*** (0.067) -0.144** (0.064) -0.215*** (0.072) -0.399*** (0.065) 0.294*** (0.064) 0.459*** (0.064) 0.346*** (0.066) Income 6th decile -0.295*** (0.084) 7th decile -0.309*** (0.083) 8th decile -0.302*** (0.086) 9th decile -0.354*** (0.083) 10th decile -0.228*** (0.081) -0.284*** (0.072) Occupation Craftsman, shopkeeper -0.203** (0.096) Private sector intellectual profession -0.473** (0.201) Public sector intellectual profession 0.448*** (0.095) 0.193** (0.098)
Public sector clerk 0.284*** (0.076) 0.173** (0.079) -0.203*** (0.076) technicians -0.321*** (0.105) 0.222** (0.097) Skilled workers 0.400*** (0.082) -0.228*** (0.078) specialised workers 0.351*** (0.084) 0.223*** (0.086) -0.258*** (0.082) -0.247*** (0.085) workers 0.363*** (0.099) 0.265*** (0.100) -0.222** (0.096) -0.212** (0.095) -0.238** (0.099) Police or church -0.586** (0.233) 0.416** (0.193) student 0.474*** (0.159) Works in a declining industry 0.171*** (0.065) 0.201*** (0.065) -0.144** (0.064) -0.217*** (0.066) Table 1. Support to political parties in 1978. Significance levels: *** 1%, ** 5%, * 10%.
As expected, ultu al divides reflected only in part the economic policy oppositions. The school issue split the electorate along traditional left-right lines although, when one turns to the social support for this question, one notices a skill- and income-based divide cross-cutting the usual partition of the left and right social bases. This is also true, but to a lesser extent, for the o k o e to ea o e uestion. Other cultural issues mattered less for the left-right opposition: the pill question for instance. Partisans and opponents on this issue were divided mostly according to age and income levels, the young and more affluent respondents being more liberal than the others.
Also, the literature stressing the emergence of a cultural divide has insisted on the consequences it would have for the left (Lipset, 1981; Kitschelt, 1988) splitti g the old left , focused on economic issue and with a social base consisting of traditional working class groups, from a e left , with a social base composed of more educated and better off individuals, more concerned with post-materialist values. The results of Tables 1 to 3 show that societal issues produced a rift within the traditional base of the right as well, based on skills and income levels. The better-off and more skilled fraction of the right social base, high-skill private sector employees and high income individuals, sided with the better-off and more skilled fraction of the left base on these cultural issues against a fraction of the traditional base of the right (shopkeepers, churchgoers, seniors...). This proximity was limited to cultural issues and did not extend to economic policy matters.
Suppress the advantages of many Broaden and develop the nationalised sector
Raise taxes for free public services Limit your standard of living to curb inflation Forbid layoffs until a new job is found woman -0.120*** (0.037) age 18 to 24 0.201*** (0.060) 0.144** (0.058) -0.132** (0.060) 0.208*** (0.064) 25 to 34 0.113** (0.044) -0.156*** (0.046) Over 55 -0.186*** (0.045) Lives in a rural area -0.294*** (0.057) retired -0.146*** (0.052) -0.172*** (0.053) Churchgoer -0.201*** (0.051) -0.555*** (0.056) 0.332*** (0.051) -0.343*** (0.053) income 4th decile 0.169*** (0.065) 5th decile 0.210*** (0.064) 6th decile 0.272*** (0.068) 7th decile -0.131** (0.064) 0.249*** (0.069) -0.155** (0.069) 8th decile -0.166** (0.067) 0.325*** (0.069) -0.191*** (0.071) 9th decile 0.245*** (0.070) 10th decile -0.152** (0.062) -0.258*** (0.065) 0.503*** (0.067) occupation Manager -0.529*** (0.143) -0.842*** (0.139) Craftsman, shopkeeper -0.319*** (0.090) -0.263*** (0.082) -0.461*** (0.086) Public sector intellectual profession 0.285*** (0.086) 0.183** (0.088) Private sector high-skilled -0.299*** (0.096) -0.350*** (0.095) Public sector clerk 0.238*** (0.071) technicians 0.211**
(0.088) Skilled workers 0.144** (0.066) 0.355*** (0.071) -0.234*** (0.065) 0.355*** (0.074) specialised workers 0.281*** (0.073) -0.157** (0.065) -0.290*** (0.066) 0.252*** (0.074) workers 0.469*** (0.084) 0.161* (0.082) Service workers 0.314*** (0.086) 0.306*** (0.086) Police or church 0.334** (0.163) Student 0.309** (0.150) Works in a small firm -0.188*** (0.046) -0.093** (0.041) -0.173*** (0.046) Works in a declining industry 0.136** (0.055) 0.266*** (0.056) -0.134** (0.054) 0.124** (0.060) Table 2. Policy expectations in 1978 (a). Significance levels: *** 1%, ** 5%, * 10%.
The direct influence of social structural characteristics on party support was also strong. Church attendance and age did not only strongly influence policy preferences or cultural values, they also directly influenced the degree of sympathy towards one or the other party. Churchgoers were strong supporters of the right, and the young were broadly favourable to the left. The working classes were strongly supporting the left, mostly the communist party and the far left. The level of income played a more moderate role, influencing only the degree of sympathy towards the far left, which was strongly decreasing with affluence. The causes for the strength of this direct influence may be either the inability of the questions on economic policy and cultural values to adequately reflect the expectations of the electorate, or the strong links between social structure and party sympathies independently of specific economic or cultural issues.
Establishment of foreign firms Suppression of the right to strike
Pill for minor girl Work more to earn more School should favour critical sense woman 0.295*** (0.043) -0.125*** (0.040) -0.133*** (0.045) -0.115** (0.049) age 18 to 24 0.331*** (0.060) 0.836*** (0.071) 0.285*** (0.071) 0.917*** (0.080) 25 to 34 0.244*** (0.047) 0.631*** (0.053) 0.527*** (0.063) 35 to 44 0.333*** (0.052) 0.232*** (0.057) 0.178*** (0.069) Lives in a rural area -0.108** (0.054) 0.244*** (0.055) -0.149*** (0.056) 0.140** (0.062) -0.172** (0.069) Unemployed -0.192** (0.093) 0.300*** (0.092) -0.206** (0.099) 0.374*** (0.102) retired 0.173*** (0.051) -0.125** (0.059) 0.300*** (0.058) -0.220*** (0.073) Churchgoer 0.284*** (0.052) 0.341*** (0.052) -0.585*** (0.054) -0.145** (0.059) -0.243*** (0.066) Income 6th decile 0.150** (0.067) 7th decile 0.270*** (0.068) 0.221*** (0.077) 8th decile 0.376*** (0.070) -0.278*** (0.076) 9th decile -0.177** (0.072) 0.274*** (0.072) -0.201** (0.078) 0.280*** (0.082) 10th decile 0.152** (0.062) 0.462*** (0.069) -0.244*** (0.073) 0.411*** (0.078) occupation Manager 0.432*** (0.130) Private sector intellectual profession -0.546*** (0.187) 0.444** (0.178) -0.722*** (0.207) 0.994*** (0.209) Public sector intellectual profession -0.970*** (0.098) 0.373*** (0.086) -1.060*** (0.106) 1.073*** (0.103) Private sector high-skilled 0.365*** (0.091) 0.234** (0.096) 0.389*** (0.112) Public sector high-skilled -0.380*** (0.125) 0.379*** (0.138) Private sector -0.251*** 0.183*** 0.215***
clerk (0.061) (0.057) (0.070)
Public sector clerk -0.375***
(0.074) -0.242*** (0.075) 0.346*** (0.082) technicians -0.527*** (0.102) -0.219** (0.098) 0.317*** (0.106) Skilled workers -0.377*** (0.077) specialised workers -0.157** (0.073) 0.176** (0.080) workers -0.243*** (0.080) Student -1.223*** (0.191) 0.606*** (0.169) -0.862*** (0.171) 1.432*** (0.242) Works in a large firm -0.197*** (0.060) -0.200*** (0.061) 0.165*** (0.064) Works in a small firm 0.211*** (0.045) Works in a declining industry -0.139** (0.054) -0.119** (0.059) -0.209*** (0.064) Table3. Policy expectations in 1978 (b). Significance levels: *** 1%, ** 5%, * 10%.
Results for 2012 (Table 4 to 6) also show strong economic policy-based divides between the left and the right. Somewhat surprisingly considering the evolution of the past decades, the issue of nationalisations, central to the economic policy debate of the late 1970s, still represent a source of opposition between the left and the right. One must however bear in mind that the financial crisis of 2008 has given rise to a renewed interest for the question of the nationalisation of the banking sector for instance. The difference with respect to 1978 is that the support to nationalisations is less clearly identifiable in terms of social structural characteristics. In 1978, nationalisations were favoured by the traditional social base of the left (working classes, public servants) and strongly disliked by the traditional social base of the right (churchgoers, seniors, high incomes). In 2012, fewer
groups emerge as clear opponents or supporters of nationalisations. These are still strongly
supported by public servants and opposed by high-income individuals, but the specific support of the working classes for instance seems to be less strong. This is not the consequence of a general lack of interest or support however. Remarkably, a majority of respondents express positive opinions on that topic, which was not the case in 1978.24 The lack of specific support of the working classes for nationalisations is therefore the consequence of other categories becoming on average more favourable to them rather than the result of a declining inclination of workers for that policy option.
Other issues reflect the classical left-right economic policy divide: the appreciation of the pension reform, the opposition to state intervention for reducing inequalities or the extent of the public sector (increasing the number of civil servants). The social structural divides on such issues are also as expected: opposing high- income individuals to the bulk of the wage-earners. New themes, such as the opposition to nuclear energy, are also integrated in this divide. As can be seen in Table 4, this supposedly post-materialist issue divides the electorate along very traditional left-right lines. Fu the o e, o e a ot ead a oppositio et ee the e a d the old left a o di g to expectations derived from the literature on this topic that states the existence for left parties of a trade-off et ee t aditio al left e o o i poli optio s a d e ultu al o e i o e tal
themes.25 The nuclear energy issue is without surprise an important determinant of the sympathy
towards the ecologist party (EELV). But if one considers the Front de Gauche, which includes the communist party, as the pa ago of the old left, e ause of its positio s o the t aditio al economic policy divide, one sees that opposition to nuclear energy mattered more for its support tha it did fo the so ialist pa t , e tai l less fo ussed o allegedl old left e o o i poli si e the U-turn of 1983. Some societal values issues do not cross-cut the left-right divide either: the appreciation of the will of the unemployed to find a job and the sentiment on immigration. The link with the economic policy cleavage is much weaker in the case of the question on the adoption right of homosexual couples, but one sees nevertheless that a favourable position of this issue brings more sympathy towards the Front de Gauche. This suggests that old a d e left politi s are not as substitute to one another as one may think.26
Contrary to what could have been expected on the basis of the new themes included in Ma i e Le Pe s a ifesto, the suppo t fo the FN appea s to e ased o e t aditio al ight economic policy p efe e es ─ egati e opi io of atio alisatio s of state i te e tio agai st i o e i e ualities, suppo t of the u lea p og a ─ a d autho ita ia so ietal alues the u e plo ed ould fi d a jo , the e a e too a i ig a ts ─ Ta le . The latte is not surprising, but the former questions the importance of the U-turn made by the FN on its economic policy stance (Shields 2013). The FN had promoted an opposition to public intervention in the economy since its foundation in the 1970s and adopted an ultraliberal position on issues such as taxation and redistribution, advocating a flat income tax and a limitation of the public expenditure to 25% of the GDP, all this coupled with a nationalist attitude with respect to foreign trade and labour immigration. Only in the mid-2000s did the economic discourse of the FN change, adopting some themes of the left critique of neoliberalism such as the negative consequences of European integration for the ability to implement a pro-active budget policy, and the impact on growth and employment, or for the possibility to keep a generous social protection system. The results documented in Table 4 point out that this change has had little consequences on the pattern of support for the FN. 27
A few issues lead to a profile of sympathy towards the different parties which departs from the traditional left-right opposition. The first one is European integration. Support for an increase in the power of the EU against the power of the national state is likely to bring support to EELV, the PS and the MoDem. Opposition to such an evolution brings strong support to the FN. The FdG is in an intermediate position in this respect. The VAT increase is another topic that breaks the traditional political alliances. Supporters of this policy measure are more likely to feel sympathy for EELV, MoDem and UMP. Finally, the importance for society to have a hierarchy with leaders, an issue which should be representative of the cultural divide (Kriesi 2010), does not lead to a support for a priori autho ita ia pa ties su h as the FN o e e supposed i a atio s of old politi s su h as the FdG, but to mainstream left, right and Centre parties UMP, PS and MoDem.
25 For instance, analysing media content on the political supply, Bornschier (2010) found that mainstream social
democratic parties had undergone a New left transformation.
26
See also Rohrschneider (1993) on this point.
27 Mayer (2013) also finds that Ma i e Le Pe s suppo ts a e ideologi all a d so iall e si ila to he
Front de gauche Europe Ecologie – Les Verts Parti
socialiste MoDem UMP
Front National No adoption for homosexual couples -0.164** (0.065) The unemployed
cannot find work 0.214*** (0.066) 0.127** (0.064) 0.252*** (0.063) 0.209*** (0.062) -0.366*** -0.304*** (0.064) (0.067) No need for a hierarchy
with leaders in society
-0.230** -0.213** -0.398*** (0.103) (0.106) (0.108) Immigrants are not too
many in France
0.490*** 0.437*** 0.325*** -0.401*** -1.078***
(0.072) (0.069) (0.069) (0.069) (0.081)
Single employment contract
Strongly in favour 0.228**
(0.106) Strongly against 0.147**
(0.072) “a koz s pe sio
reform was fair
-0.103*** -0.071*** 0.033*** 0.165***
(0.011) (0.010) (0.010) (0.011)
government's intervention to reduce income inequalities
Strongly approve 0.142** 0.300*** 0.171*** -0.203*** -0.229*** (0.066) (0.062) (0.064) (0.062) (0.067) Rather disapprove -0.513*** -0.380*** (0.133) (0.126) Strongly disapprove -0.393*** -0.249** -0.355*** (0.128) (0.118) (0.118) Increase VAT 0.032** 0.075*** 0.043*** (0.016) (0.016) (0.016)
Increase the power of the EU 0.060*** 0.053*** 0.045*** -0.084*** (0.011) (0.011) (0.011) (0.012) Keep on building nuclear plants -0.043*** -0.110*** -0.029** 0.047*** 0.039*** (0.012) (0.012) (0.012) (0.012) (0.012)
Increase the number of civil servants 0.065*** 0.056*** 0.061*** -0.073*** (0.015) (0.014) (0.014) (0.014) Wealth: over 300 000 Euros -0.286*** -0.170** (0.083) (0.078) Income: 3rd decile 0.262** (0.105) Occupation
High-skill public service -0.365**
(0.147)
High-skill private sector -0.319**
(0.146)
Public sector clerk 0.201**
(0.094)
Unemployed -0.271**
(0.113)
Risk of income loss -0.188*** -0.126** -0.223*** 0.149**
(0.064) (0.062) (0.061) (0.067)
women 0.166*** 0.173***
Age 18 to 24 -0.323*** (0.116) 25 to 34 0.240*** (0.091) 35 to 44 0.167** (0.075) over 55 -0.280*** (0.067) Churchgoer -0.302** (0.123)
Lives in a rural area -0.120*
(0.062)
Table 4. Support to political parties in 2012. Significance levels: *** 1%, ** 5%, * 10%.
A notable difference with the 1978 situation is the weak direct importance of some social structural characteristics on party support. Individuals with high wealth levels are still more likely to dislike left parties (FdG); respondents between 25 and 45 are more favourable to the MoDem than others; high-skill individuals dislike the FN. The support of the working classes and the young to the left is no longer observable independently of the economic policy preferences and societal values. This may be the result of a better design of the questions on economic policy or cultural values in the 2012 survey, which would have a better explanatory power of the sympathies towards parties than in 1978, or a consequence of the so-called de-alignment or de-structuring of the traditional relationship between social structural determinants and political preferences.28
Turning to the support to the economic policy options, the cleavages, splitting the working classes and the public servants apart from the managers, shopkeepers and private sector high- and medium-skill employees, are more or less unchanged on a certain number of key economic policy issues: pension reform, state intervention against income inequality or the increase in VAT. The working classes appear somewhat less supportive of nationalisations or the extension of the public service than public sector employees, and they are not particularly sensitive to the nuclear energy issue. They do not particularly disapprove the need for hierarchy in society, unlike public servants, or anti-immigration positions. Furthermore, they express negative opinions on the job search effort of the unemployed, similarly to shopkeepers. The same configuration is found on the question about the extension of the power of the EU, shopkeepers and the working classes are opposed to it; managers and high- and medium-skill employees are in favour of it.
The core social base of the right, more limited than that of the left in 1978, appears relatively stable, composed of churchgoers, managers, craftsmen and shopkeepers, high skill private sector employees and individuals with high incomes or wealth levels. They express unsurprising policy preferences: against nationalisations and the extension of the public sector, in favour of the pension efo a d a VAT ise, disapp o i g state s i tervention against inequalities; they have negative opinions of the job search effort of the unemployed and consider positively the existence of a hierarchy in society.
Opposed to the single employment contract Pension reform Against state s interventio n on inequality Increase VAT Increase the power of the EU Nuclear energy Wealth Over 300,000 Euros -0.207*** 0.169** 0.279*** 0.216*** 0.316*** (0.077) (0.074) (0.078) (0.069) (0.081) 150,000 to 300,000 Euros 0.152** 0.150** 0.233*** (0.064) (0.063) (0.069) 75,000 to 150,000 Euros 0.176** (0.088) 7,000 to 75,000 Euros 0.155** (0.072) Income 4th decile -0.153** (0.077) 5th decile -0.348*** 0.363*** (0.107) (0.107) 6th decile 0.181** 0.191** 0.151** (0.076) (0.079) (0.075) 7th decile 0.000 0.378*** 0.000 (0.000) (0.108) (0.000) 8th decile 0.192** 0.286*** 0.000 (0.082) (0.083) (0.000) 9th decile 0.304*** 0.295*** 0.251*** (0.086) (0.088) (0.085) 10th decile -0.241** 0.459*** 0.395*** 0.340*** 0.285*** (0.102) (0.102) (0.098) (0.104) (0.098) Occupation Craftsman, shopkeeper 0.274** 0.000 (0.118) (0.000) Manager 0.660*** 0.577** 0.650*** 0.608*** (0.220) (0.227) (0.216) (0.227) High-skill public service 0.000 0.425*** -0.400*** (0.000) (0.098) (0.100) High-skill private sector 0.378*** 0.433*** 0.345*** 0.458*** 0.000 (0.109) (0.113) (0.111) (0.105) (0.000) Medium-skill public 0.377*** 0.000 0.391*** -0.565*** (0.093) (0.000) (0.086) (0.086) Medium skill private 0.283** 0.265** (0.125) (0.120)
Private sector clerk
Service workers -0.371*** 0.000
Unskilled worker 0.234** 0.000 (0.107) (0.000) student 0.394*** 0.493*** (0.147) (0.151) Unemployed -0.299*** (0.103) Former unemployed -0.106* -0.131** 0.000 -0.213*** (0.054) (0.056) (0.000) (0.053) Retired 0.186*** 0.144*** 0.241*** (0.053) (0.051) (0.054)
Risk of income loss -0.299***
(0.053) -0.203*** -0.162*** (0.052) (0.052) Employment risk Woman -0.206*** (0.051) Age 18 to 24 0.490*** (0.109) 25 to 34 0.328*** (0.082) 35 to 44 0.309*** (0.070) over 55 -0.390*** 0.144*** (0.055) (0.051) Churchgoer -0.264*** 0.410*** 0.252*** (0.099) (0.089) (0.089)
Lives in a rural area -0.112**
(0.052) Table 5. Policy expectations in 2012 (a). Significance levels: *** 1%, ** 5%, * 10%.
Natonalisa tions Increase the number of civil servants Homosexua ls adoptio rights Unemployed could find a job No need for hierarchy in society Not too many immigrants Income 2nd decile -0.344*** (0.093) 4th decile 0.000 (0.000) 5th decile -0.235** -0.438*** (0.095) (0.155) 6th decile -0.178** -0.418*** (0.082) (0.135) 9th decile -0.207** -0.234** (0.092) (0.095) 10th decile -0.438*** -0.405*** (0.101) (0.091) Occupation Craftsman, shopkeeper -0.277** -0.328** (0.117) (0.145) High-skill public service 0.302*** 0.433*** -0.788*** 0.814*** 0.595*** 1.008*** (0.113) (0.101) (0.132) (0.140) (0.143) (0.125) High-skill private sector 0.000 -0.486*** 0.000 0.000 0.796*** (0.000) (0.136) (0.000) (0.000) (0.132) Medium-skill public 0.385*** 0.421*** -0.705*** 0.509*** 0.453*** 1.050*** (0.097) (0.087) (0.117) (0.112) (0.128) (0.108) Medium skill private -0.312** 0.000 0.000 (0.154) (0.000) (0.000) Foreman, technician 0.000 0.000 0.532*** (0.000) (0.000) (0.131) Public sector clerk -0.200* 0.000 (0.104) (0.000) Private sector clerk -0.259** 0.000 (0.107) (0.000) Service workers -0.371*** (0.137) Skilled worker -0.252** (0.098) Unskilled worker -0.271** (0.120) student 0.574*** (0.185) Unemployed 0.338*** (0.127) Former unemployed 0.127** 0.171*** 0.247*** 0.236*** (0.057) (0.051) (0.067) (0.085) Retired 0.354*** -0.220*** (0.080) (0.084) Risk of income -0.120** -0.139*** 0.237*** -0.149**