HAL Id: hal-03003047
https://hal.archives-ouvertes.fr/hal-03003047
Submitted on 8 Feb 2021
HAL is a multi-disciplinary open access
archive for the deposit and dissemination of
sci-entific research documents, whether they are
pub-lished or not. The documents may come from
teaching and research institutions in France or
abroad, or from public or private research centers.
L’archive ouverte pluridisciplinaire HAL, est
destinée au dépôt et à la diffusion de documents
scientifiques de niveau recherche, publiés ou non,
émanant des établissements d’enseignement et de
recherche français ou étrangers, des laboratoires
publics ou privés.
Latitudinal control of astronomical forcing parameters
on the high-resolution clay Mineral distribution in the
45°-60° N range in the North Atlantic Ocean during the
past 300,000 years
Viviane Bout‑roumazeilles, Pierre Debrabant, Laurent Labeyrie, Hervé
Chamley, Elsa Cortijo
To cite this version:
Viviane Bout‑roumazeilles, Pierre Debrabant, Laurent Labeyrie, Hervé Chamley, Elsa Cortijo.
Lati-tudinal control of astronomical forcing parameters on the high-resolution clay Mineral distribution in
the 45°-60° N range in the North Atlantic Ocean during the past 300,000 years. Paleoceanography,
American Geophysical Union, 1997, 12 (5), pp.671-686. �10.1029/97PA00118�. �hal-03003047�
PALEOCEANOGRAPHY, VOL. 12, NO. 5, PAGES 671-686, OCTOBER 1997
Latitudinal control of astronomical forcing parameters on the
high-resolution clay mineral distribution in the 450-60 ø N range
in the North Atlantic Ocean during the past 300,000 years
Viviane
Bout-Roumazeilles,
• Pierre
Debrabant,
• Laurent
Labeyrie,
2'3
Herv6
Chamley,
• and
Elsa
Cortijo
2
Abstract. The clay mineralogy of four 5.5- to 13.5-m-long cores sampled between 45 ø and 60øN in the North Atlantic
Ocean has been investigated at high latitudes within a well-constrained chronostratigraphic scale. Cross-correlationspectral
analyses
have
been
performed
on both
clay mineral
and/5•80
planktonic
records.
Detrital
clay minerals
display
strong
signals
which
are coherent
with the/5•aO
record,
within
the three
main
Milankovitch
frequency
bands
(eccentricity,
obliquity, and precession).
The climatic control on clay mineral sedimentation
largely depends
on the latitudinal location
of the sediment cores. The 100,000-year signal occurs as a uniformly acting factor, whereas the 41,000-year signal
dominates
clay sedimentation
at high latitudes and the 23,000-year signal dominates
at midlatitudes.
We suggest
that the
latitudinal variations
of the orbital forcing on the detrital clay mineral distribution
in the North Atlantic Ocean not only
result from climatic control of the intensity of physical and chemical weathering,
but also from latitudinal control on the
detrital clay supply linked to influences of the high-latitude wind-driven and midlatitude ocean-driven
transportation
processes,
respectively.
Introduction
The North Atlantic Ocean is strongly influenced by long-term
climatic variations between 40 ø and 65øN, where the largest temperatures changes in the world ocean develop due to the vicinity of large continental ice -sheets [Ruddiman and Mcintyre, 198!a,b]. The circulation of large volumes of deep and intermediate water originating in the Norwegian and Greenland
Seas
is modified
by glacial-interglacial
cycles.
The/5•3C
records
indicate that the vertical and hydrological structures and
circulations of the deep North Atlantic were different. The
penetration depth of the ventilated North Atlantic Deep Water
decreased, whereas poorly -ventilated water originating in the
southern hemisphere invaded the deep oceanic basins [Duplessy
et al., 1988' Oppo and Fairbanks, 1990].
The North Atlantic Ocean is surrounded by large, high-latitude
continental masses (Figure 1). The deep-sea clay sedimentation in this ocean is mainly controlled by detrital supply from the American and European continents [Biscaye, 1965; Griffin et al., 1968' Rateev et al., 1969; Lisitzin, 1972]. The variations of the
terrigenous input during the Quaternary depended on the size of
• Laboratoire
de
S6dimentologie
et G60dynamique,
Universit6
de
Lille
1, Villeneuve d'Ascq, France.
2 Centre
des
Faibles
Radioactivit6s,
Laboratoire
Mixte
CNRS-CEA,
Gif-sur-Yvette, France. •3 Also
at D6partementdes
Sciences
de la Terre,
Universit6
de Paris
Sud, Orsay, France. •
Copyright by the American Geophysical Union.
Paper
number
97PA00118.
0883-8305/97/97PA-00118512.00
671
continental ice -sheets and on sea -level changes, both of which
modified coastline and continental erosion areas. During glacial
periods, the extensive high -latitude continental areas surrounding the North Atlantic Ocean allowed the growth of large continental ice -sheets which strongly affected the detrital clay input [Chamley, 1989]. Previous works have shown the relationships existing between the variations of clay composition and the long- term climatic evolution in Atlantic Ocean sediments [Chamley, 1979; Robert and Maillot, 1983; Thidbault et al., 1989]. More
recent works have demonstrated that the Quaternary terrigenous
clay input was controlled by the size of the continental ice -sheets
and by the intensity of the physical weathering of the surrounded
continental masses in both the South Atlantic Ocean [Petschick et
al., 1996] and the Norwegian Sea [Froget et al., 1989].
Previous studies performed in the Arabian Sea and the Indian
Ocean have proved that clay sedimentation was orbitally forced
during the last 1.5 m.y. [Fagel et al., 1992; Fage• 1994]. The
present study focuses on high -resolution clay sedimentation in
the North Atlantic Ocean and its dependence on short-time
climatic evolution during the last 300,000 years. We used the spectral analysis techniques on high -resolution clay records (time
spacing of 200 to 2000 years), in the frame of a well-constrained
chronostratigraphic scale defined by accelerator mass
spectrometry
•4C
dating
for the
last
35 kyr [Cortijo
et al., 1997;
Vidal et al., 1997] and by correlation with the SPECMAP stacked
/5•80
signal
for older
periods
[Martinson
et al., 1987].
Materials and Methods
Materials
Four sediment cores from the 1990 Paleocinat I cruise were
672 BOUT-ROUMAZEILLES ET AL.' LATITUDINAL CONTROL OF CLAY MINERALS
60øN
50øN
40øN
Figure 1. Study area and core locations.
eastern Atlantic basin: the southernmost core SU 90-08, situated near the Azores on the western flank of the mid-oceanic ridge, and the core SU 90-12, situated near the mouth of the Labrador Sea, on a seamount at 1000 m above the seafloor. The two other cores are located in the western basin: the core SU 90-38, situated near the Rockall Plateau, and the Northernmost core SU 90-33, located on the southern margin of Iceland (Figure 1).
Chronostratigraphy
For each site the timescale is based on the comparison
between
the benthic
and/or
planktonic
5•80 records
and the
spectral mapping SPECMAP stack [Martinson et al., 1987] using
the Analyseries software [Paillard et al., 1996]. The age-depth relations are given in Table 2 and drawn in Figure 2. A linear interpolation was applied between the stratigraphic levels
identified, assuming that the sedimentation rate was constant
between
these
levels.
The 5•80
isotopic
analysis
of foraminifera
was measured on an automatic carbonate preparation line coupled
to a Finnigan MAT 251 mass spectrometer (Centre des Faibles
Radioactivit6s, Gif-sur-Yvette, France). Isotopic stages and stage boundaries were deduced from isotopic curves, magnetic susceptibility, and grey-level reflectance [Grousset et al., 1993; Cortijo et al., 1995]. Isotopic stages 7, 5, 3 and 1, are considered as interglacial periods, and isotopic stages 8, 6, 4, and 2 are considered as glacial periods.
Cores SU 90-08 and SU 90-12 were sampled every 2-10 cm, corresponding to a sampling interval ranging from 0.2 to 2 kyr for SU 90-08 and from 0.5 to 2.5 kyr for SU 90-12. Samples were
taken every 5 cm along the core SU 90-33, corresponding to a
sampling interval of about 1 kyr. The core SU 90-38 was sampled
every 5-10 cm, pointing to a sampling interval of 1-2 kyr (Table 1).
Table 1. Core Characteristics
Core Latitude Longitude Depth, m Length, m
SU 90-08 43ø31'2 N 30ø24'5 W 3080 12.27 SU 90-12 51052'6 N 39ø47'4W 2950 5.47 SU 90-38 54ø05'4N 21004'9 W 2900 11.42 SU 90-33 60ø34'4N 22ø05'1 W 2400 13.53
Age of Bottom Sample Sample Spacing Sediment
Sediments, kyr Number by Age, kyr Rate, cm/ka '•
285.5 246 0.2-2.0 4.2
188 76 0.5-2.5 2.9
228 147 1-2 5.0
BOUT-ROUMAZEILLES ET AL.: LATITUDINAL CONTROL OF CLAY MINERALS 673
Table 2. Age-Depth Relation for the Studied Cores
SU 90-08 SU 90-12 SU 90-33 SU 90-38
,
Depth, cm Age, ky Depth, cm Age, ky Depth, cm Age, ky Depth, cm Age, ky
0 0.0 29.5 11.4 3 10.4 302 54.8 104 33.2 36 13.5 320 57.6 109 35.6 68 18.6 352 64.1 220.5 73.2 145 22.5 383 71.1 258.5 90.9 231 34.1 497 90.1 319.5 107.5 240 36.2 526 96.4 380 122.2 336 45.0 569.5 107.6 398.5 126.6 439 59.5 589.5 115.9 448 162.8 444 60.0 620 125.0 547.5 188.3 455 66.6 633.5 131.1 609 89.4 644.5 136.6 795 110.3 653 139.0 900 127.0 667 141.3 963 131.1 685 149.3 994 139.2 698.5 152.1 999 140.3 699 152.6 1054.5 152.3 759 183.4 1090.5 168.5 1019 225.2 1144.5 183.4 1071 240.2 1209 204.3 1130 267.5 1240.5 225.2 1210 288.5 1254 230.9 1326 267.5 1348.5 272.7 0 4.1 750 150.4 76O 152.3 860 183.4 920 191.4 1100 225.2 1130 228.3 Clay Minerals
About 840 samples were submitted to X -ray diffraction
analysis (XRD) on a Philips PW1710 X -ray diffractometer from
2.49 ø to 32.5ø20 using a copper k(x radiation. The method was
conducted as follows. All samples were first decalcified with a
0.2 N chlorhydric acid. The excess acid was removed by repeated centrifuging. The clay-size fraction less than 2 gm was isolated by settling and then oriented on glass slides. Three tests were performed on the oriented mounts : (1) natural sample, (2)
age in kyr 300 250 20O 150 100 --' SU90-08 • su90-12 50 -• SU90-38 0 0 200 400 600 800 1000 1200 depth in cm
Figure 2. Age-depth relation for the sudied cores.
glycolated sample, and (3) sample heated at 490øC for 2 hours [Holtzapffel, 1985]. The clay minerals were identified by their basal reflections [Brindley and Brown, 1980].
The peak height, which is the parameter used for the spectral analysis, is obtained by measuring directly on XRD diagrams the
height of one characteristic peak for each relevant clay mineral,
on the glycolated sample after subtraction of the background
noise
(12/• for 10-14v
mixed
-layer,
10/• for illite, 3.57/• for
kaolinite,
and 3.53/• for chlorite).
The reproducibility
of the
technical work and measurements was tested : five oriented
amounts, prepared from the same sample, were submitted three
times to XRD. The relative margin of error is _10%.
General Data and Clay Mineral Results
The foraminiferal
'•O/'60
isotopic
ratios
(expressed
as 15'•O
versus Pee Dee belemnite (PDB)) have been measured on an automated carbonate preparation line coupled to a Finnigan MAT
251 mass spectrometer. The mean external reproducibility of
powdered carbonate standards is _+0.05%ø. Data are reported using
as reference
NBS 19 15'•O
of-2.20%•
versus
PDB [Coplen,
1988].
Both planktonic foraminiferal species Neogloboquadrina pachyderma (left coiling), shell sizes 200-250 gm, and
Globorotalia bulloides (shell sizes 250-315 gm), were analyzed,
depending
on the
latitude
of the
core.
The 15'•O
planktonic
records
were plotted on the same timescale as clay mineralogy in regard
with illire, chlorite, and kaolinire peak heights (Figures 3-6).
Core SU 90-08
The clay mineral fraction is mainly composed (Table 3) of
674
BOUT-ROUMAZEILLES
ET AL.: LATITUDINAL CONTROL OF CLAY MINERALS
,,,
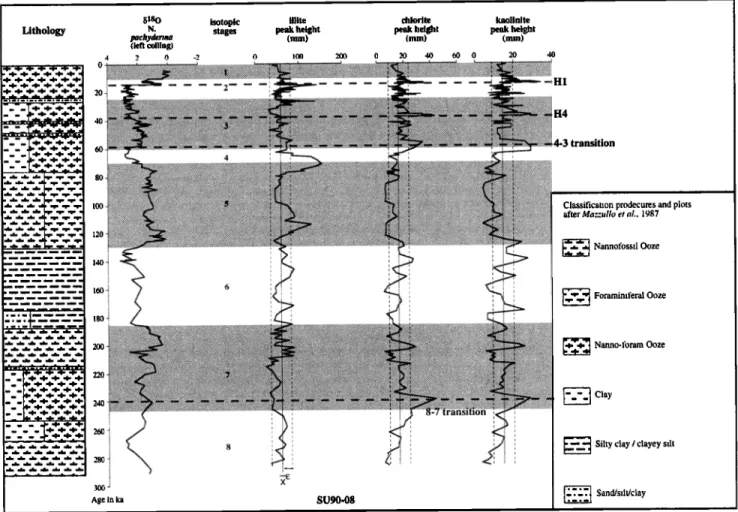
$180 isotopic i!!ite chlorite kaolinire Lithology N. stages peak height peak height peak height
pachyderma (mm) (mm) (mm) (left coiling) 0 100 200 0 20 40 60 0 20 40 4 2 0 -2 ....
..+•.•.•.•..+..
o-
.•.--.
•[••••
'_ .'-z_. •_ .--_ .':. _-: z:-. _: ...40
.:.:•
...
,..:•i6..:•.,-:-..:•-.-..,...•...•...:.•i
-,-.---,-...-..-:,•.:,...-...-:•?...--.-:
...•ii:;•.::..--.•;•!•..•..•
•'.-."•õi-'.•.•..,...:,•.:.•::::
...
...•..•
.•••••:.:.-/•.::-.::...•:47.,:.,.::.,...•..../.::./.•....•....•ii::•:•?•:•::•is•;:
_:..-..•.•...•.•.:,...;.,,•.,..•...:...•:.•
H
'.7.'_---_•-' t .•¾.•-i--.•-•'.•¾. i!•.•:•::'.-'".•..:."•:q.."iC •..:v.:...`....•...•}i•...•...`•..:::...•.•:•..;.•...`...::•U *'•'""'""•'"'"'"'••••••:•ii ... ... `•..••••i....::`•....•`:•...;•:•.!•m:i..•.•!i•!!....•.•.•}...`..!:•iii•!i•:•.: ' '••:... "•;•. :i•!.:.•!$i:!•:::::4:.•ii•i:½!!i!!•i:-.:•.>.•!!•'•.:ii "'•'•' """ - -,.--.--.-'-•*-"..-'•.'.-:•:?.-•""i4.:Di-:.:'•".'•*[*
60q
...
.`.•.:•:••••••••.`...`...`•.••:.•.:.:.•J...`...•.•..:..•:•ii!i:.•::.:•.i.•i:.:..•:•!•.:.:•!:::•....::....•..:•...•!•:.:.:.::!:•.:...•.:...:•i.-•:•::..:.•...:
...
'•
:':'"'"•}i•.'
:'":"::l
...
4-3
transition
:
' ' - - •.4.'•.*.•
4
: ! .
'
..2
...
'. _._ _._ '.-•' + • 'I 80 • ::::::::::::::::::::::::::::::::: :::•.:•.•::..'.:,•...'.:::.-.:•, :•:.:....:•...•.•>*::.:.:.:....•:..:.:.:....:.:.:.:.:....:.:.x.:.;•.x:....:.%.::::(•.•.%.x*:•..:...•:.:....:*:•. ': ... :....:.:`•.`.::::....:•::::::•:•:•:.:..`.::::..•:.:.:.:``...•:.:.•.•*`...•...:•..`.:.:•: :. :.x..- c.;...-:.:.:.:-:-:-•.:::•-'.•-:.x• -.-•..-:-:-..:.-:::.-.?.:.?;•:::::::.'.-:::;:.:.: .... ..--:. •:-:.:.:.:-.-•:..-..q..'-•:.:.-.-•::.-:.-:
...
, 100•
'"'"'"'"'•"'"'•
'•'••••••i•i• ":••i"-'"'"':•'"q:'::•;•}:•i'""'
""'"•
:•J{
•"'"
:•I:'•
...
...
•
':'•"
'"
Classification
prodecures
and
plots
120 - •.:.:.:...'.ii![.-•:•:.•i:•?;-.:2;[:...i•:;•i?•.5!½ .... .::.•..'...-'.s'..',•::;•.•:.,..--•---...-:...--.-...•i:-.q:.'s.--..•.: :::.•:.-..'s.-.'::.-'.:.'.-.'.-'...,::.'::.-'.:::.::::s:::•:5,'..:
•
!•
•I
•-'• Foraminit•ral
Ooze
20o-'-'
'•••'""•:•---':•••::•••:••••ii---..
......
••,.v'
.. ...,.... • •.. .•...,.---•-.-..----•,.•_•-,,••...•••••.,•••••,---•.-.-•...•,
...•2•.!•5•55,AA:.:..:....-5•5•..-.:.g;....•
.-'•:.•.•-:.i:•..:.:•,•...-.:•::•.•:•:.5:•?,•:•,i{{•!5..?..,..•;i::•.•::..$-,--•..-.:,•i•:.,:.::m
• ... ..•, .•.•••••:•_•.• ::.::...,..• ... :•••• •.•,•••••..,..:•,.'•--'-:•.•:..•:•..,..,..•d•,•...-.-•.•i•:,,.----•-,.•..
'.-.
'-.•:••.5i.,,•5•.::•..
•"'"'•"'"":':'•':•5•.
...-:••..-":.•i
..•...:.•.•••:.•]•
Nanno-foram
Ooze
_ ..., -I- ,4- •- •- •-! ]:...:•...:..'..::•%:'x'•' .-'..•...::.•:m*i.'.-'$'.-'.'..'•:: ... •... •-..'S(.•i•s.-.':::.•..':•!r:•i:•:::::-:¾.•....?.':.-'::;i•::s:::::::.'.:*j.>..:.'.::'•(•..--"...•...'•!•:• "' .:: :::•[•::..`.!:•.:•:::.•.:...:.•!•;*•..`•.:•:.::•:i:i•.•:J•i•g`..•::•..*...:•:::•:•:i•!•.`.`*:: .'•.: ':'..'::z:•..,•,m,:.:.•,.•:•,-'....'.•,•,m::..':.,:..'•'.•:•a*•- ';."-.,.'.'.-'.5.'•.'•'.•:•:..'...•.•'•?'•'..:•:•:•..'...'.:'..'_ _.-.. • • • • ':'--'-;•:*'•'•'"*•-'.:-':::'- m.:::•"'::'-':•'"'"•.•:•}•":•'e...-'::.:'•'2•'c*-"'""z•! .'".r'""*•.•'•":• i•i.•'•;'•.•'"';::.:.'.:.c:•:.'::::' '"•-.•..•:i:•" :..:..-•:'.•.• •:i:!a .•.'.'•:;i:::' •.':-.'<.•..:::-'::. .:.:::•..•:.'::.- ... :::*:•.
_ . . t-e--e--e--• 260
280-
•
8
• Silty
clay
/ clayey
silt
Age
in
ka
SU90-08
.-'• Sand/silt/clay
, ,.Figure
3. Core
SU 90-08.
The
•180
of Neogloboquadrina
pachyderma
(left
coiling)
and
peak
heights
(in millimeters)
of illite,
chlorite and kaolinire (interpolated data) plotted versus time and isotopic stages. Letter X denotes average (solid line) and letter œdenotes standard deviation (dashed line). Interglacial and glacial periods are outlined by shaded areas. HI and H4 are Heinrich
events I and 4 [Heinrich, 1988].
abundant, with 14% and 11% of the clay fraction, respectively.
Illite-smectite random mixed-layer minerals (10-14s) constitute
5% of clay minerals [Bout-Roumazeilles, 1995].
The illite peak height values vary slightly from one sample to ß another. They remain inside the confidence interval except at the beginning of stage 5, at the 5-4 transition, at the 3-2 transition, and during stage 2 where the highest values are registered (Figure
3). The latter interval refers to specific sediments located between
40 ø and 55øN in the North Atlantic Ocean which contain a series of layers rich in detrital ice-rafted material, unusually poor in
foraminifera and called "Heinrich layers" [Heinrich, 1988].
Isotopic stages 8 and 5 exhibit the lowest peak heights of chlorite and to a lesser extent of kaolinite, whereas stages 7 and 6 are characterized by higher values for these mineral species. A few discrete high values are situated at the 8-7 transition, at the 4-3 transition and within stages 3-2 (Figure 3). Two of the four more recent peaks correspond to Heinrich events H 1 and H4. Core SU 90-12
The clay mineral fraction is dominated by average values of
34% illite (Table 3) and 21% chlorite. The illite-vermiculite
mixed-layer minerals represent 18% of the clay mineral fraction.
Smectite (15%) and kaolinite (12%) are less abundant [Bout-
Roumazeilles, 1995].
The variations of illite, chlorite, and to a lesser extent of
kaolinite,
are very similar.
The illite, chlorite,
and kaolinite
peak
height
values
fluctuate
inside
the confidence
interval
from one
sample
to another,
except
at the 4-3 and 6-5 stage
transitions,
which are marked by illite values higher than the standarddeviation (Figure 4).
The illite-vermiculite mixed-layer (10-14v) peak height values
vary slightly,
with a higher
range
in the upper
part of the core
during
stages
3 and 2, in relation
with Heinrich
deposits
(H2, H4,
and H5). Two low values occur within stages 6 and 5 and at the 6-5 stage transition (Figure 4).Core SU 90-38
The clay mineral
fraction
is mainly composed
of illite (39%)
and smectite (35%). chlorite (14%) and kaolinite (12%) are lessabundant, whereas the illite-smectite random mixed -layers occur
as trace amounts (Table 3).
Once again the illite, chlorite, and kaolinite peak height
variations are very similar and roughly parallel the successiveisotopic
stages
(Figure 5). The values
display very short-time
BOUT-ROUMAZEILLES
ET AL.: LATITUDINAL
CONTROL
OF CLAY MINERALS
675
15180
isotopic i!!ite
10-14v
mixed-layer chlorite
kaolinite
Lithology
N. pachydertna
stages peak
height
(mm)
peak
height
(mm) peak
height
(mm)
peak
height
(mm)
(left coiling) 5,5 4,5 3,5 2,5 1,5 0 50 100 150 0 20 4(! ½! 50 1½)0 ½! 50o
•!
... '•'•i::•:...-.
•:"•'•'-•'""•-••••:•
...
'•• ...
•*:•*'"-'"':•
... ! •' !' ,
,,
...
i
',
,
....
,-,
...
.:...,,•.,•..•.;..-•-•
... •.:•.•½...•....'•.•..•
... '"'"•'•,•'"
.,.. .••,,.••
.•..
'.-?....-•
..•••:,:-..
....
...
-••,..,•
.._,
$!.
.... .,...-....-•-.:•....,•:.,...:•..•.•...,.,•:
'"-
•$'.'i•.::t•-x':.
•':•".i."-•::::::-':::::J:.•.':½'•'•:.:,.:-:-?
.
... .•. :•.i•:..'• ... • . .: ... '•' '" •'•"' ' "•'' '•' •••••! *-'' '•'" •" '"' i' '.•. "'"• •- • ... ,'• ... '"' •' '•'" •'" '""••":••,••••••••• :•;c-':"-•' -'•'"'"•"'••'' '•••-'..•;• "ø'"' ' • .-..3....t r...a..n..si...t!..0...n.k
4 7'"
: :
...
•,,
, ,
, ::.,.:.:'•
...
=======================================================================
... ,,., ;.•.• • :.•j. •:.:..• .• •.,.•: i.•'•;.. ß •- ,•: • ... • :--•-.--x--•--.•.c,. ••x• •,• • •. • •?•. .•::':.]½.: :•...-:; •..-..c.- :-:-: :-:-:- .'-.'• -.:• • :.-.-:.(•'.. :- •. :-.f• - -'- :$•1.?-•:•.•!:•:s•,s•.•,e•:.-:::::•:'•:::::•:.-'.::.•'..".'4t•$$'.' ', ... ,---.--,--,--, ! ii i ! ! "1 !:.-_.-.
:.-:::::.-:::::
: :
:
:
:
:,,
Age in ka SU90-12 ...Figure
4. Core
SU 90-12.
The $•s0
of Neogloboquadrina
pachyderma
(left coiling)
and
peak
heights
(in millimeters)
of illite,
illite-vermiculite (10-14v) random mixed -layers, and chlorite and kaolinite (interpolated data) plotted versus time and isotopic
stages. Letter X denotes average (solid line) and letter • denotes standard deviation (dashed line). Interglacial and glacial periods
are outlined by shaded areas. H2, H4, and H5 are Heinrich events 2, 4 and 5 [Heinrich, 1988].
modifications less apparent than in the two previous cores, with distinct periods of high and low values. Glacial stages 6, 4, and 2 are characterized by the highest values, whereas interglacial stages 7, 5, and 1 show the lowest values. Local variations occur, especially expressed by a strong decrease of all clay mineral peak heights during stage 5.5 (a warmer episode inserted in an interglacial period) and by a characteristic increase of all peak heights during the cold stage 6.2.
Core SU 90-33
Smectite constitutes as an average 59% of the clay mineral
fraction. The other minerals are less abundant ' Illite represents
20% of the clay mineral fraction, whereas the percentages of
chlorite, of kaolinite, and of illite-smectite random mixed -layers represent 10% or less (Table 3).
The illite peak height
variations
parallel
those
of chlorite
and
kaolinite
(Figure 6). The beginning
of isotopic
stages
7 and 3
corresponds
to the highest
positive
deviations
from the mean
value.
Except
for a level situated
within
stage
6, the whole
core is
characterized
by a low range
of peak
height
variations,
the values
being situated very close to the average value.Spectral
Analysis
Methods and Results
MethodsThe data have
been
processed
by spectral
analysis,
in order
to
examine
the response
of the clay sedimentology
to climate
in the
676 BOUT-ROUMAZEILLES ET AL.: LATITUDINAL CONTROL OF CLAY MINERALS
Lithology
G.
bulloides stages
•518
O
isotopic
peak
height
illite
(mm)
peak
chlorite
height
peak
kaolinite
height
(mm) (mm)
4 2 0 0 100 200 0 50 100 0 50 100
... 0 ~ ß ...•...•:.:...•:.:..:•...m?;•r....•.``...•.``....:...•••. ...;••••...•...:..•...:...:•::.""""""".•.•..•.`..•i!:•.•....:•4ii•iii::::•i::...• - :::::::::::::::::::::::::::::::::
,?.•_-_-_-_-_-_-_-,
20-
-'.-':::::.:•::3::•::•::':!.'•:• .;::.::•:?.?.?..:•::!:!::...:•3.•.•:i::.>;::.:•..•::.::.::....::.::.::.:....•!•:•.:•...•....:•:•...•!:!:!:.•.:.•!:5..::•$:•:•::•:•::•:::•:•:•:•:•:•:•.
....•:.::!:5.•i...`•...?•...•:•:•:•:!:::.:.::•:•:•:[:.•:.:::.::.8.•:::.:.•..:..9.%....:•:•:•:•:•:•:•..:...:.:5:•:•:5:•:•3•:•:5:•:•:.*.:B•:58•::e ' :-:-.'-:.:-" :::::::::::::::::::::::::::::::::::::::::::::::::::::::::::::::::::::::::::::::::::::::::::: •::' ==========================================================================:i"'•-'•'?...: i!'""•': .'.::.:.'i!i•s.::::. i:•:i!:!• :?..•!•i!•!!5:!•!!:i•[..:.:i.:.::.:.i:4•:ig!:i....::.:.:.`.:i.:•:i:...:i::i:.•..•.•:...:...::•?j.:•:•:.*...•.:...:...;..•[:•:•....:..:::.:•:i..`.•::::::iii::ii:•:•:•:•:!:...`•.J![:...`..•:....i:i:•:%•...ii•:::: ... ""%Si•:Jiiii :i:i::•:•:•-5'.-':•::•:?•½•:•*• ... ?.!:!*•:•:•:•::•:•:?.:.:-::•:•:i:!:•:i:•:!:•:::!::-'..?4:!:!:! ... '""':;!*:.::: •i:i:i:•:i:i:i:•i:•:i:i:i:!:i:•:i:•:•:•:i:i*•:•:i:!:::i:...:•i•i•i:•i:•:i:F:i..:.:i:i:[:[:i:i:[:[:!:!:!:i:i:!:•:i ... '"%'.::i ::::::::::::::::::::::::::::::::::::::::::::::::::::::::::::::::::::::::::::
_
_
_
'i
... -i-,:
...
•o- 6
:-
:- :- :- :.
%*.,.%*.,..t.
;.-
;- .;.-
:- .;:
...
":-"'
I,, ,4- ,4- ,4- -4- ... ili•illllllllillllli•:..:!•-•;.!•i•!iil.".:iii•!;.!ilili::
i:•:M:[:!:!:g i:!:'2•-5i!½ ::':'"' [ ! .-.-.-:.:.::::.':::•::..'".-'•:•:•:•:•:•:.":•. ½J•-";"-";'-":•:•:•:-":"-•:•:-•:•:'::g •:[:!:•:•:i'-'.'-'.::.:-'•:'.'-'•:• • B :'-"--:2:"2/•.•i[i[ •!•i• i !:!½ii:;:.:..-':.[:'..•ii!• !!!• •!!!!:'"'"'"' ""•:•' ß ' ' .."•:.'•::iiiiiii.'2i::.:.:... ).'•':'-'"":':'"" ::!i[!:/ii!•i!i$ •:.:.?-i2."i:.:'.".-•i!."•:i:i[M:•:•:•:•:•:•:•:•:•!•:B i:•:.::•:•:.::•:•:•½[½•:::•:•-".-:.'-:•:•g •:•!i:•:•:!:!:'.-• :k..[..." ..:.:•&::!:•.:•:!:•!:i:•:!:!:!:i:!:•:[:•:•:•:•:•:•:•:.:..•:•:•::.:•:•:[:!:•...:•:•:•:•:•:!:•:•:•:•:...:...:•:!:•t! :i:•:-'.:•:-'.:i: ::i:i½i:i.'.'. ! ' '":::•:K-:M:[:[:!:!:!:•:[:i:i:E:!:i:!:i:[:M:i:3i:i::4:•:[•:
Age in ka SU90-38
Figure
5. Core
SU 90-38.
The õ•80
of Globigerina
bulloides
and
peak
heights
(in millimeters)
of illite,
chlorite,
and
kaolinite
(interpolated data) plotted versus time and isotopic stages. Letter X denotes average (solid line) and letter • denotes standard
deviation (dashed line). Interglacial periods are outlined by shaded areas.
main
frequency
bands
of the orbital
forcing,
about
1/23 kyr
-•
(precession),
1/54 kyr
4 and 1/41 kyr
4 (obliquity),
and
of ice-
volume
variations
(about
1/100
kyr4).
The
spectral
analyses
were
performed on the following terrigenous clay minerals: chlorite,
illite, kaolinite, and illite-vermiculite mixed -layers. The data on
smectite were not processed by spectral analysis because smectite could be either continent-derived or volcanic-islands-derived.
The 1/23
kyr
4 frequency
represents
the
precession
forcing
for
which the insolation is modulated by the relative position of the
perihelion
and
of the
summer
solstice.
The 1/41
kyr
4 frequency
is
the obliquity forcing band. It results from the distribution of solar energy between high and low latitudes. In Quaternary sediments,
the 1/100 kyr
'• frequency
is now considered
as an internal
oscillation of the coupled ice-atmosphere-ocean system linked to
the long-time constant of the ice sheet response to the orbital
forcing [Imbrie et al., 1992, 1993]. Notice that the temporal windows considered in the present work (176.5-281 kyr) are too short for fully reliable results in that frequency range and will be
discussed only for general trends.
Spectral analysis was done by the Blackman and Tuckey,
[1958] method (hereinafter referred as Blackman-Tuckey) with a
Bartlett-type window providing a 80% confidence interval
[Jenkins and Watts, 1968; Bringham, 1974]. The Analyseries
package [Paillard et al., 1996] was used. It includes the ARAN software for Blackman-Tuckey spectral analysis developed at Brown University for the SPECMAP program and communicated
by W. Prell.
Owing to the fact that sedimentation rates are not constant, the time spacing between the samples is not regular. In order to obtain a regular time sampling, all data were linearly interpolated
BOUT-ROUMAZEILLES ET AL.' LATITUDINAL CONTROL OF CLAY MINERALS 677
•5180
•5180
isotopic i!!ite
chlorite
kaolinite
Lithology
N.
pachydertna
bulloides stages
peak
height
(mm)
peak
height
peak
height
(mm)
(left coiling) (turn)
5 4 ... • ... 3 2 I . ... 4 .,_ ... 2 ! ... I ... 0 0 • 50 • 100 0 ! ... i 20 i 40 I? i .. -i '0 40 ...
5,iE,
_.-•_••_•. 0• •,•,,,
::: .•'.-:.'..::g:: :•: :::::s::::::::::::::::::::::
E•.• :::::::::: -'.':::::...
:i:i: •:i:i::.::: :?- E.'.'e:::.,:,..
...
:g: :.-'::,:,
...
:..': :-.': .•!: [• :!:::[:5 :'•?. :!•:ex':':':':E: :-•. '?'•." :.2.•-.'-'::::::: ::: :!::8 E:..•..:.:•:•:•.,.`.,.•.`:•*•.:..`...•:•.•:*•::•..•::•:•:•:•:•:•:•:•.?•
:.": :!:::BB?.: {"..-:.'!:'"-.•i•:!:5:.::!: ?-'::!:i::: :g:8: :•.4..?.% ?.-•:.: •.: $g: ';:.•[:• &.':...
:.• 8!:!:[:'-::•: :?. :::::::::i:i::s::, ,,:,_...
...
?.: -5 ½.:-.";.'.'!i:•[:•...
i•E[i.'!i...
>;'[-' .' •:-.'•:ii•-'[ &' &>-•: t ½-'• &:8 B !-'!.'."::"-!-9-'!:!-' K<'-? - -'E:-%!-'::!.":: ?. g ?-? •-' :-•::.'.x:-!:-'?.g!>.':!:•:•::.,
...
>.'E Et -'!-"%'-' '.3 : -' -' -' -' -' : -'.:'. .' -' -' -' -' '.!:;-
20 ...,...,...,•:...:•
,..•,._
2
:
,- ,
:
... ::::::::::::::::::::: •.::::::::::::::::::•[:.::i:i•:.:•.•3B•&::•:•:}•:?..:...•:•:•:•...:i:!:!:•:•::.:[:...`3..::;::..:•:...•:•!:!:!::::..::: :::.?.•&::...:•:•:!:•$,..:•:i:i:J:[:i:i:g!:i:k...i:•J•?.:.:B:.:i..:.:i::...::::i:i::...i:i:•...,:•.5:i:i:i:i:i•:•:i:g•::•.•:?,..:i:i:::....•.•:•:•:•:i:•gi..:...:...:.:i:• :-'.:•:' `.•.•`>...,...•&...•.:•...•:..•...3•..•..[&....:...>%?...:...::....?....•:•...:..::i..iE$.i..i:i..• ' •...ji.5...?...[:!.•E...::J..3.i.?•:i:[:[:.:..•:...:•E:...(..•..•E..[E...:..•..•...%?!..!...•..•..•:•..: ....
...
......
,o 4 ";'""%"q, :•, •..,.•,,..,...,..•.,..*•:.*:*•:•...•.*:...:•:..•..•.,..*•*.•.,..*?.•*•*:•*•*•`J•=.?.•.*•:•?•..•..*.•:•..:...•.,..**....•*•..•*•*?.•*•:•.•.?•...:*•:•:•:
::•::i::i{•i•i}:iB.:.•iiiiiii..:::iiiii}•::::!i::....:.1:::::::•::!:•iii?;•P•i:• ... •::ij..J•i ' ...,,,
....• i.'-:::"•ii½'.-:.'½::i::½iB:'.:::::::..-i::::i•i½ii½•i½i•i ' F::..::giiii::½i:: •ii:::: i; :,p: ',,?.!.:.;.,.:%
...
i' -.-.80- ;iiii{iiiii•½}•i:½}½iiiiiiiii:":'""'""'"'":•ii'":•-' :;-;•;"JJii:;i{ii{4!;!iii;;[;}..-.-" ½?'":'"':•2' :.'-'}! ::'"'s'-'"•:...-'•4!i ;!!];i ii•.--"J:. •]"½i ;!•;j]i-';i;
... :"..-':...-i{{.'•:.-{.-'!{!?:..:iiiiiii!•}.'-.:{!•i.:..'??:.. '/'..'.::{E<.i{.?,.:ii:.:,:3•iii{! E:' • :..>•::::•:{;.;...::.[{iiE!i•i•i..{•i{!i?:.{E•:::::...:..:•:.i•i•::{{•3•::{•.}}}i•.}:•! 'f•:::'.
-
,
t-.•
4
....
..,...,.
-•
, ,
,
.• ,
:-:-:-:-:-:-:-:-
. %
,,
::,..,.{.{,"-r-
i
::::::::
;>
,,½
,
• • • • -I-
• -I-
•
½::::::::::::;:.'.-.'.,...•e8•s:::•:::•:E:•::::•:•:•:•:•E:•:•:•:•:•:•:•:•:•:•::•$:::•{•(41•E:•:::::•:ig•,•(•:•::•::::::•::::•;g•:•:•E•::•1:•E•:•::::H:•:•::•:::•:(•8•;):•:::::::::•::::::::•:::
:.•
===============================================================================================
q' q' q' q' q' q' q' q' 220 ...
...
.
½,
' ,
.***•-
_•o-
:
:•:
R
/ :
280 ~ ' ' ' • ' '
Age in ka SU90-33 _œ x
Figure
6. Core
SU 90-33.
The/5•80
of Neogloboquadrina
pachyderma
(left coiling),
of Globigerinabulloides
(dashed
line)
for
interglacial periods, and peak heights (in millimeters) of illite, chlorite, and kaolinite (interpolated data) plotted versus time and
isotopic stages. Letter X denotes average (solid line) and letter • denotes standard deviation (dashed line). Interglacial periods are
outlined by shaded areas.
at a 0.5-kyr interval. The spectral analysis was performed on the
largest
period
where
both clay minerals
and
•5180
have
been
analyzed' between 4.5 and 285.5 ka for SU90-08, between 11.5 and 188 ka for SU 90-12, between 5 and 228 ka for SU 90-38,
and between 14.5 and 272 ka for SU 90-33.
The
studied
frequencies
range
from
0 to 0.2 kyr
4 with
a step
of
0.003
kyr
4. The
bandwidth
is 0.01 kyr
4 for SU 90-08,
0.015
kyi l
for SU 90-12,
0.013
kyi • for SU 90-38,
and
0.011
kyr
4 for SU
90-33. Results of the spectral analysis are presented as variance
powers. The variance powers of both clay peak heigths and
Table 3. Mean Mineralogical Composition of Studied Cores Based on 246 Samples for SU 90-08, on 76 Samples for SU 90-12,
on 268 Samples for SU 90-33 and on 147 Samples for SU 90-38
Chlorite Illite 10-14v 10-14s Smectite Kaolinite
Core Average s.d. Average s.d. Average s.d. Average s.d. Average s.d. Average s.d.
SU 90-08 14% +3 37% +7 0% - 5% +2 33% +11 11% +3
SU 90-12 21% +4 34% +4 18% +8 0% - 15% +8 12% +_2
SU 90-38 14% +3 39% +7 0% - 0% - 35% +11 12% +_2
SU 90-33 10% +4 20% +_5 0% - 4% +2 59% +11 7% +_2
,
678 BOUT-ROUMAZEILLES ET AL.: LATITUDINAL CONTROL OF CLAY MINERALS
foraminiferal isotope data were normalized by the integrated
variance which corresponds to the sum of all the variance powers
between
0 and
0.2 kyr
4. Each
frequency
band
is reported
taking
as center the observed maximum variance for specific band, not
the orbital frequency. Differences between these two values are within the errors and are attributed to uncertainties in the
timescale and to analytical noise. The mean Blackman-Tuckey
coherency and phase were calculated by cross-spectral analysis
between
the
clay
mineral
peak
heights
and
the/5•80
signal
in the
three major frequency
bands
: 1/100 kyr
'•, 1/41 ky•:•,and
1/23
kyr
4 [Imbrie
et al., 1992;
Imbrie
et al., 1993;
Labeyrie
et al.,
1996]. Coherency is considered significant (at the 80% level) if larger than 0.52. Phases are reported and discussed only for the more significant bands (highest variance and significant
coherency),
therefore
mostly
within the 1/100 kyr
'• band,
considered as the "ice sheet climatic forcing" band. The phase origin is taken at the minimum ice volume (minimum
foraminiferal
$•SO)
and
reported
as
leads
(negative
phases)
of the
clay minerals relative abundance when compared to the ice -sheet volume changes. We calculated also the phase relative to the insolation change for discussion of the large precessional response of the clay minerals in the northwestern core SU 90-12. Following lmbrie et al. [1992], calculations were done for June 15 insolation at 65øN (origin for June 15 at perihelion) using the Berger [ 1978] algorithm as available in the Analyseries package.
Phases in radians may be converted to degrees or kiloyears (one
period=360 ø=2•c tad) for each of the frequency bands.
Results
Core SU 90-08. The core located at 44øN on the western side
of the Mid-Atlantic
Ridge
reveals
a •5•80
record
of planktonic
foraminifera
marked
by three
major
frequencies
(Figure
7), with
variance
power
maxima
around
1/115
kyr
'• (the
1/100
kyr ice -
sheet
forcing),
1/38
kyr
'• (the
1/41
kyr obliquity),
and
1/23
kyr
4
(precession) (Table 4).
The
illite
spectrum
shows
two
main
signals
around
1/115
kyr
4
with
25%
of the
integrated
variance
and
around
1/23
kyr
'• with
18% of the integrated variance (Figure 7, Table 4). The
coherencies
between
illite and
•5•SO
records
are slightly
higher
(0.57< Cov< 0.62) than the confidence level for the two main
frequency
bands
(0ø52
for a 80% confidence
interval)
[Jenkins
and Watts, 1968]. An additional frequency is observed around1/12
kyr
4 on the
illite
record
but
also
on
the
chlorite
and
kaolinite
records.
It represents
less than 7% of the total variance
but has
already been observed in previous studies on rock-magneticproperties
[Robinson
et al., 1995] as well as from grain-size
parameters
on core SU 90-33 [Revel et aL, 1996]. The latter
authors have attributed this frequency to either ice-rafted events [Robinson et al., 1995] or changes in the intensity of the bottomcirculation.
The chlorite and the kaolinite records are mainly controlled by
the 1/115
kyr
'• and
1/23
kyr
4 frequencies
(Table
4, Figure
7). The
coherency
between
the
chlorite
and
the/5•80
records
ranges
from
0.56 to 0.65 and is therefore slightly superior to the confidence level of 0.52, whereas the consistency between the kaolinite and
•5•aO
records
is significant
in the
two
main
frequency
bands
(Cov
=0.65).
Changes in all three minerals lead the ice volume changes
(b'•O)
quite
considerably
(about
2-2.5
tad,
i.e. about
30 kyr) in
the 1/100
kyr
'• band.
Errors
are
large.
Thus
the
similarity
in the
early response of illire, chlorite, and kaolinite to the ice -sheet evolution, when compared to the marine paleoclimate proxies
(which
respond
approximatly
in phase
with ice volume
[Imbrie
et
aL, 1992, 1993]), does indicate that the accumulation of these
minerals in the core is not controlled directly by the ice volume,
but by the growth or decay of the ice -sheets ß The clay mineral relative abundance is larger during periods of ice -sheet decay and smaller during periods of ice -sheet growth.
SU90.08 , N. pachyderma 0.012 (left coiling) 0.004 0 0 0.05 0.1 0.15 frequency in kyr-I
• i•O.01
ky
4
bandwidth
0.012 i II . ': N. paclo'derma 0.004 0 0 0.05 0.1 0.15 frequency in kyr '1 0.0120.068
0.004 0 •018 N. pacl.n'derma (left coiling)•
kaolinite
0 0.05 O. 1 O. i 5 frequency in kyr IFigure 7. Core SU 90-08. Blackman-Tuckey [1958] spectral analysis
cross
correlations
of $•O Neogloboquadrina
pachyderma
(left
coiling)
with clay mineral
peak
height
(interpolated
data)
with a 0.01 kyr
'•
BOUT-ROUMAZEILLES ET AL.: LATITUDINAL CONTROL OF CLAY MINERALS 679
Table
4. Blackman-Tuckey
Spectral
Analysis
Cross
Correlations
of õ•80
of Neogloboquadrina
pachyderma
(Left
Coiling) With Clay Minerals for Core SU 90-08
1 / Frequency, kyr Variance Power
Clay
Mineral*
õ•0 pachyderma Clay
Mineral*
õ•0 pachyderma
Covariance, Confidence Level = 0.52 115 104 32 38 illite - 27 illite 23 23 15 25 0.57 18 0.62 115 101 32 38 chlorite - 27 chlorite 23 23 15 36 0.56 - 10 0.65 115 98 32 38 kaolinite 37 27 kaolinite 23 23 15 26 0.65 15 0.65*Peak height is in millimeters.
To summarize, the widely consistent response in the 1/100
kyr"
frequency
band
(0.57<
Cov<
0.62)
of the
chlorite,
illite,
and
to a lesser extent kaolinite results from the variations of the northern continental ice-volume which dominated all climaticrecords in the North Atlantic Ocean during the last 500 kyr
[Ruddiman and Mcintyre, 1984; Imbrie et al. , 1992].
The illite, kaolinite, and chlorite records also express in a
significant
way
the
precession
forcing
in the 1/23
kyr
4 frequency
band,
which
is consistent
with
the
fi•SO
planktonic
record
(Cov=
0.65). It reveals the dominant precessional forcing at midlatitudes (44øN) on the detrital clay sedimentation during the last 300 kyr. The phase response in the precession band corresponds for the
three clay minerals (illite, chlorite, and kaolinite) to a lead of
about -1.2 tad (3 kyr) when compared to ice volume, or a lag of 0.4 tad (1 kyr) when compared to insolation; the clay minerals follow therefore the "early response group" of lmbrie et al. [ 1992, 1993], in a way similar to some of the parameters linked with surface-deep ocean exchanges and southern hemisphere sea surface temperature.
Core SU 90-12.. The core situated at 52øN near the entrance
of the
Labrador
Sea
displays
a õ•O record
characterized
by three
main frequencies, with power variance maxima around
1/128
kyr
4 (46%
of integrated
variance),
1/42
kyr
4 (26%),
and
1/23
kyr
4 (12%).
The
temporal
windows
(176.5
kyr) are
too
short
for reliable
results
in the 1/100
kyr
4 frequency
range
and
will be
discussed only for general trends.
The illite record shows three main frequencies around 1/128
kyr
'•, 1/42 kyr
'•, and 1/23 kyr
'• (Table
5, Figure
8). The
precession forcing dominates the illite record with 18% of the
integrated
variance.
The
coherency
between
the
planktonic
õ•O
and the i!lite records is highly significant in the 1/128 frequency
band
(Cov=
0.85)
and
less
significant
in the
1/23
kyr
4 band
(Cov
= 0.55)
(Table
5). The additional
1/35
kyr
4 frequency
probably
represents a harmonic of studied time -interval (176.5 kyr / 5),
but we notice
that
a nearby
frequency
(1/31
kyr
4) has
already
been reported in previous works and attributed to polar ice
fluctuations [Ruddiman et al., 1984; Pisias and Rea, 1988; Revel
et al., 1996]. The phase response of the illite, when compared to
Table
5. Blackman-Tuckey
Spectral
Analysis
Cross
Correlations
of õ•80
of Neogloboquadrina
pachyderrna
(Left
Coiling) With Clay Minerals for Core $U 90-12
ii i i i i i i i
1/Frequency, kyr
õ•0 pachyderrna Clay
Mineral*
IlL Ill I I I
Variance Power
•J•aO
pachyderma
Clay
Mineral*
128 128 42 illite 35 23 25 46 26 12 illite 128 83 42 is 10-14v - 23 24 46 26 12 is 10-14v 128 98 46 42 chlorite - 26 23 25 12 chlorite 128 111 42 kaolinRe 33 23 - 46 26 12 kaolinite i i i Covariance, Confidence Level = 0.52 31 0.84 17 - 18 0.55 15 0.63 - 24 0.54 48 0.88 .. 10 0.58 30 0.84 17 - ..
680 BOUT-ROUMAZEILLES ET AL.' LATITUDINAL CONTROL OF CLAY MINERALS SU90-12 0.012 •.. 0.oo8 0.004 128
80
0.012
/•[ 42
illite
•.. 0.008
0.004. 0 0.05 0.1 0.15 frequency in kyr I•5180
illite-vermiculite
J mixed-layer
0.05 O. 1 O. 15 frequency in kyr '1 0.0120.008
0.004 0 98• Or•Ol•ka'bandw,dth
'
•5180
•
0.012
•
•5180
[Jtl
NileP•tCch•'iC•enn;ja
0'008
_•
I I •
_
kaolinite
0 0.05 0.1 0.15 0 0.05 0.1 0.15frequency in kyr I frequency in kyr '1
Figure 8. Core SU 90-12. Blackman-Tuckey [1958] spectral analysis cross correlations of •lSo Neogloboquadrina pachyderma
(left
coiling)
with
clay
mineral
peak
height
(interpolated
data)
with
a 0.015
kyr
'• bandwidth.
minimum ice volume, is similar to core SU 90-08 (a lead of about
2.5 rad) in the ice response band and corresponds to a lead of
about 0.7 rad (2 kyr) in the precession band. This is, if confirmed, a little smaller than for core SU 90-08 and would indicate a larger influence of the ice -sheet at that latitude in the precession band.
The chlorite
record
is dominated
by the 1/128
kyr
'• and 1/23
kyr
'• frequencies
(Figure
8, Table
5). The coherencies
between
the chlorite
and the fi•80 records
are significant
in the main
frequency bands (0.57< Cov< 0.88).
The kaolinire record displays three main frequencies with
variance
maximum
around
1/128
kyr
'• (30% of the variance),
1/33
kyr
'•, and
1/16.5
kyr
'•. The
coherency
between
kaolinire
and
the fi•80
records
is highly
reliable
in the 1/128
kyr
-• frequency
band
(Cov= 0.89). The additional
frequency
at 1/33 kyr
'• has
already been observed in the illire record and is attributed to polar ice fluctuations; it is associated with its harmonic at 16.5 kyr (33 kyr / 2). However its integrated variance is greater than the 33- kyr peak. It probably means that this peak is a harmonic or a nonlinear combination of orbital frequencies. The phase responses of both chlorite and kaolinire are similar to illire, as in
core SU 90-08.
The illite-vermiculite mixed-layer record is mainly controlled
by the 1/23
kyr
'• frequency
related
to the precession.
It reaches
24% of the integrated
variance,
whereas
the 15•80
record
represents only 12% of the variance in the same frequency band.
The
coherency
between
the
15•80
and
the
illite-vermiculite
mixed-
layer records is barely significant (0.54) but is much higher when cross -correlation is done directly with insolation (0.78). The phase in the precession band corresponds to a lead of the illite- vermiculite mixed -layer by about 2.5 rad (80 ø, or about 9 kyr) to maximum northern summer insolation. Taking in account the errors involved (at least 0.3 rad or 1 kyr), this means that the maximum illite-vermiculite mixed-layer fluxes in that core are in
phase with the minimum northern summer insolation or
maximum
northern
winter
insolation.
The 1/83
kyr
'• frequency
revealed by the spectral analysis is tentatively attributed to a harmonic of studied time -interval (176.5 kyr/2), taking into
account that the eccentricity band cannot be expressed for that
time series.
To summarize, the illire, chlorite, and especially illite-
vermiculite. mixed-layer temporal distributions are controlled by
the 1/23 kyr
'• precession
frequency
and are coherent
with the
isotopic record in this frequency band. The illire, chlorite, and
kaolinire
are
also
controlled
by the
frequencies
near
to 1/100
kyr
'•
linked to the dynamic of the northern continental ice -sheet
[Ruddiman and Mcintyre, 1984; Imbrie et al., 1992]. The isotopic
and detrital clay mineral signals are significantly consistent within this frequency band (Table 5). The obliquity-driven 1/42
kyr
'• frequency
which
is recorded
by the fi•80 signal
does
not
appear in the clay records at the 52øN latitude where core SU 90-
12 has been drilled.
Core SU 90-38. The core located at 54øN in the eastern basin
near
Rockall
plateau
displays
a foraminifera
fi•80
record
which
expresses again the three main climatic frequencies. The variance
maxima
are situated
around
1/111
kyr
'• (40% of the variance),
1/43
kyr
'• (21%),
and
1/23
kyr
'• (12%)
(Figure
9, Table
6). The
temporal window (176.5 kyr) is too short for reliable results in
the 1/100
kyr
'• frequency
range
and
will be discussed
only
as far
as general trends are concerned.
The illire record shows a well-marked signal (Figure 9)
associated
with the 1/111 kyr
'• frequency
and parallels
the
isotopic record in this frequency band (cov.= 0.83). It also reveals a poorly -defined frequency with a variance maximum


![Figure 7. Core SU 90-08. Blackman-Tuckey [1958] spectral analysis cross correlations of $•O Neogloboquadrina pachyderma (left coiling) with clay mineral peak height (interpolated data) with a 0.01 kyr '•](https://thumb-eu.123doks.com/thumbv2/123doknet/13040129.382357/9.901.224.668.712.1107/figure-blackman-spectral-analysis-correlations-neogloboquadrina-pachyderma-interpolated.webp)

![Figure 8. Core SU 90-12. Blackman-Tuckey [1958] spectral analysis cross correlations of •lSo Neogloboquadrina pachyderma (left coiling) with clay mineral peak height (interpolated data) with a 0.015 kyr '• bandwidth](https://thumb-eu.123doks.com/thumbv2/123doknet/13040129.382357/11.897.238.663.121.487/blackman-spectral-analysis-correlations-neogloboquadrina-pachyderma-interpolated-bandwidth.webp)

