The
socio-economic
evaluation of
flood prevention
projects
in France
JUNE 2019
In France, the average annual cost of the damage caused by floods (and insured under the Natural Disasters programme) reaches 520 million Euros. To reduce this damage, the State subsidises the flood prevention projects conducted by local authorities. In order to benefit from the subsidies, local authorities must carry out a socio-economic evaluation of their project. The French General Commission for Sustainable Development is steering the development of the baseline assessment method so that projects may be compared to a common baseline. In March 2018, it published an update of the method.
In mainland France, nearly 17 million people are at risk of floods created by overflowing waterways according to the State's preliminary flood risk assessment in 2011. Faced with this risk, the Action Programmes for Flood Prevention (Programmes d’actions de prévention des inondations - PAPI, cf. Box 1) are aimed at ensuring the safety of people and property, improving regional resilience and protecting the environment and cultural heritage. They constitute one of the main operational tools for implementing the National Strategy for Flood Risk Management (Stratégie Nationale de Gestion des Risques d’Inondation - SNGRI) at the regional level. They are subsidised by the major natural risk prevention fund (called
the Barnier fund) following a call for projects launched by the State.
Over the 2011-2018 period, 95 complete PAPIs have been approved. Their cost has reached around 1.7 billion Euros, including a state subsidy of 690 million Euros (40%). More than 80% of this finances structural measures (e.g. a dike, see themes 6 and 7 of the PAPIs in Box 1).
Box 1 - Action Programmes for Flood Prevention (Programmes d’actions de prévention des inondations - PAPI)
Conducted by local authorities, PAPIs cover all the flood risk management themes, namely:
Theme 1: Improved knowledge and awareness of risk (e.g. organisation of feedback)
Theme 2: The monitoring and forecasting of rising water levels and floods (e.g. new hydrometry stations) Theme 3: Alerts and crisis management (e.g. municipal backup plans)
Theme 4: Taking flood risk into account in urban planning (e.g. updating planning documents)
Theme 5: Actions to reduce the vulnerability of people and property (e.g. work on housing)
Theme 6: Run-off management (e.g. water retention upstream)
Theme 7: Management of hydraulic protection works (e.g. work on damming systems)
COMPULSORY SOCIO-ECONOMIC EVALUATION... To benefit from State subsidies, programmes with structural measures (themes 6 and 7 of the PAPIs) costing in excess of 2 million Euros, excluding taxes, must be subject to socio-economic evaluation.
This evaluation makes it possible to judge the socio-economic relevance of projects by comparing their costs and benefits with regard to the key objectives of the National Flood Prevention Policy. Costs include direct financial costs and the costs of negative project
Commissariat général au développement durable
impacts. The benefits correspond to the damage avoided thanks to the project being done. They are calculated in relation to a baseline case over a defined time frame (usually 50 years). The baseline case corresponds to the area’s foreseeable evolution in the absence of the project to be evaluated.
Socio-economic evaluation, carried out by the project promoters, is attached to the file examined by the National Flood Commission (Commission Mixte Inondation -CMI) which makes the decision on the approval of the PAPI.
... BASED ON A NATIONAL REFERENCE METHOD... In order to be able to justify the choices made between projects over a common baseline, the Ministry in charge of natural risk prevention has developed, at the national level, a baseline method of socio-economic evaluation. Its content is described in a methodological guide published by the French General Commission for Sustainable Development (Commissariat Général au Développement Durable, CGDD) in 2014 then in 2018 [1]. This method was developed by a working group, created in 2008. Led by the CGDD, it is composed of experts from the CGDD, the General Directorate for Risk Prevention at the Ministry, the National Research Institute of Science and Technology for the Environment and Agriculture (IRSTEA), the French Centre for Studies and Expertise on Risks, Environment, Mobility, and Planning (CEREMA), the European Centre for Flood Risk Prevention (CEPRI), the Central Reinsurance Fund (CCR) and the Natural Hazards Mission (MRN).
This working group develops tools, monitors their use and compares them with the experiences of foreign countries, and provides rigorous, scientific, methodological recommendations in accordance with the principle of proportionality (i.e. the complexity of the studies must be proportionate to the challenge that the project represents (its geographical scope, its political context, its cost, etc.)). It makes sure that the cost of implementing the method is kept to a minimum for the project promoters.
... PROPORTIONATE TO THE COST OF THE PROJECTS
For groups of structural operations that are hydraulically interdependent with a cost of between 2 and 5 million Euros excluding taxes, the mandatory socio-economic evaluation is a standard cost-benefit analysis (CBA). It is based on a comparison of the costs on the one hand and monetary benefits (or damages avoided) on the other (cf. Figure 1).
For groups of operations over 5 million Euros excluding taxes, the national reference method has been a multi-criteria analysis (MCA) or “extended cost-benefit analysis” since 2018. In the MCA, the cost-benefits taken into account cover the impacts avoided that can be monetised (mainly material damage), as well as the relevant impacts for justifying projects that cannot, at current levels of knowledge and work, be integrated into the standard CBA in monetary form. These include, for example, the benefits of protecting heritage buildings or sites of note. In the benefits, then, damage avoided (monetarised impacts found in the CBA) and protected assets (non-monetary impacts) thanks to the project can be distinguished one from the other (cf. Figure 1).
Figure 1: The reasoning behind PAPIs’ CBAs and MCAs
Source: CGDD
EVALUATION OF THE DAMAGE AVOIDED...
Monetary damages are calculated using damage functions (cf. Box 2). They establish a quantified relationship between hazard parameters (most often this means water levels and submersion time) and the cost of the damage expressed in Euros. The latter is estimated using a model that takes into account the characteristics of the exposed assets and recommendations from insurance experts after a disaster (in terms of, for example, cleaning, repair or replacement for buildings or loss of added value for farmed plots). Filled in for the baseline case and project case, the monetary damage indicators reflect the benefits of definite removal from water (by building a dike for example) or likely removal from water (for example with the reinforcement of a structure lessening the probability of overflows) and those relating to a decrease in level of water to which the asset is exposed.
Box 2 - The flood MCA guide tools [1] - Monetary damage functions [2]:
There are direct damage functions for dwellings, economic activities, public facilities and farmed plots and an indirect damage function for road transportation networks.
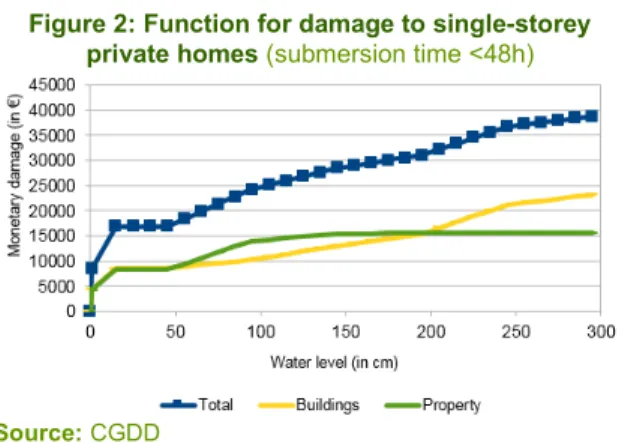
For housing, businesses and public facilities, the functions are built first for each core component of the concern (building, furnishings, equipment, stock, etc.) and then aggregated at model scale. A model describes the core components for a sub-category of asset (e.g. a single-storey private home (cf. Figure 2), a school, etc.). They are designed to be used from free localisation databases for assets that are available throughout France.
Figure 2: Function for damage to single-storey private homes (submersion time <48h)
Source: CGDD
- “Indicator documents” [3]:
For each asset exposition indicator, a document describes the data to be identified and the available databases (TOPO database, Sirene database, MAJIC database, etc.) and the scope and calculation method for the indicator. Using a fictitious case, an example of a cartographic representation is also submitted (cf. Figure 3).
Figure 3: Example of a cartographic representation
Source: CGDD
… AND OF THE ASSETS PROTECTED…
Non-monetary indicators are proposed for some assets for which it is currently difficult either to quantify the link between the flood characteristics and the impact on the asset (e.g. the connection between water level and deaths), or to assign a monetary value to the impact of the flood on the asset (e.g. value of the damage to a work of art). The use of these indicators can be temporary as it depends on improvements to knowledge and methods. These indicators are quantified. The variation of each of the indicators between the baseline case and project case is calculated and gives a non-monetary assessment of the project’s effectiveness. These are benefits related to a definite or likely removal from water. The impact of a decrease in water level on areas that remain flooded is not reflected by these indicators.
For each asset exposition indicator, an “indicator document” describes the data to be collected and the methods of calculation (cf. Box 2).
… USING MULTI- OR SINGLE-SCENARIO ANALYSIS A multi-scenario analysis to compare projects and choose the ones that are most effective
The range of different intensity flood events that can affect an area each year is infinite. Insofar as the damage and the exposed assets vary with the intensity of the event (measured by the water level, cf. Figure 2,
submersion time, etc.), it should take into account all possible floods in a given year in order to properly reflect the potential damage and the exposed assets within a region, and to think in terms of average annual damage or average annual number of exposed assets.
In the analysis, at least four flood events have to be considered (application of the principle of proportionality). From the most frequent to the least frequent, this is the scenario of the initial damage hazard (i.e. the most intense event – in terms of water level for example – not causing damage, cf. (A) and possibly (A') on Figure 4), the design scenario (i.e. the most intense flood scenario for which the structure is designed to totally protect the target area, (B)), a hazard scenario in which the structure suffers limited hydraulic impact (C) and an extreme hazard scenario with a return period of at least 1,000 years (D). In line with those recommended in the Floods Directive, these scenarios have been selected so as to minimise the risk of damage under- or over-estimation connected with not taking all events into consideration.
The damage associated with each flood event (or scenario) is then weighted based on the frequency of the event to give the Average Annual Damage (AAD, cf. Figure 4).
Figure 4: Damage distribution curves and graphic representation of Annual Average Damage (AAD) and
Average Annual Damage Avoided (AADA)
Source: CGDD
The difference between the AAD without a project and the AAD with a project corresponds to the Average Annual Damage Avoided (AADA). It corresponds to the annual monetary benefits accumulated in a region thanks to the project, taking into account all the flood events that can occur there.
Symmetrically, the Annual Average Number Avoided (AANA) for assets (inhabitants, jobs, etc.) corresponds to the non-monetary benefits accumulated in a region because of the project, taking all possible flooding into account.
For the CBA, only the indicators for monetary damage avoided (cf. Figure 8 M-indicators) are filled in. They make it possible to calculate two effectiveness indicators (the AADA and the percentage of damage avoided by the project) and two efficiency indicators (the net present value and the monetary benefit/cost ratio) (cf. Figure 5). For the MCA, two asset exposition indicators (inhabitants and jobs) are also filled in. They enable new effectiveness indicators (percentage of inhabitants leaving the flood zone, for example) and cost-effectiveness indicators (cost per inhabitant or job saved) to be constructed (cf. Figure 5). Depending on the specific vulnerability of the area and its assets, other performance indicators can also be calculated in the form of annual average indicators for protected assets (AANA).
Figure 5: Indicators for PAPIs’ CBA and MCA multi-scenario analysis
Source: CGDD
In order to calculate these indicators it is necessary to resort to data (hazard parameters, land use, etc.) that may have significant margins of error. The confidence interval makes it possible to estimate the cumulative impact of these margins of error on the indicators. IRSTEA has developed a simplified tool to analyse the sensitivity of the multi-scenario analysis efficiency indicators to the data used to calculate them [4].
Taking into account several possible flood events, the annual average indicators can compare projects that protect against different flood events (a 30-year flood, a 100-year flood, etc.).
An analysis of the design scenario in order to have a more exhaustive idea of the costs and benefits of projects and their distribution between assets, municipalities, etc.
To characterise the impact of the project and its benefits (monetary or not) more precisely as well as their distribution between assets, between municipalities, etc, it is recommended only that the project design scenario is looked into more deeply.
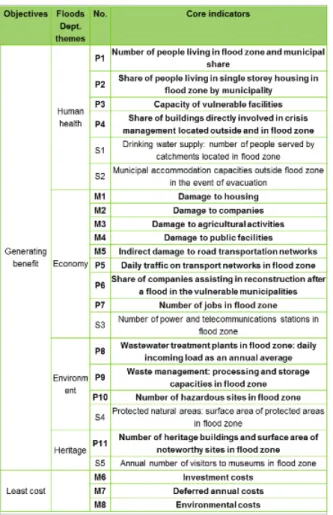
In the MCA, the analysis of the design scenario is based on sixteen non-monetary indicators for assets that are exposed (e.g. the number of heritage buildings), five monetary indicators for damage (e.g. monetary damage to housing) and three monetary cost indicators (e.g. investment cost) (cf. Figure 8).
They fall under the Flood Directive’s four themes: human health, economy, environment and heritage, and reflect the objectives of the SNGRI: making vulnerable populations safer, short term stabilisation and medium-term reduction of the cost of damage of flooding and greatly speeding up the return to normal of the regions affected.
Box 3 - Illustration of the multi-scenario analysis
A project is designed to protect a region, predominantly residential, against a 30-year flood (frequency = 1/30). This region is damaged whenever a 5-year flood hits (frequency = 1/5).
- The CBA and MCA effectiveness and efficiency indicators:
The total cost of the project (C) over 50 years amounts to €10.7M (investment cost, deferred annual costs, environmental costs).
Thanks to the project, 74% of the damages generated on average each year by the floods are avoided (AADA/AADbaseline = 0.74), i.e. an annual benefit (AADA) of
€0.68M (we have AADbaseline = €0.91M, cf. Figure 6 ). The
total benefit over 50 years (B) reaches €19.2M.
Over 50 years this project saves €8.5M in damage to society (net present value = €8.5M). Thus, for every euro invested in the project, €1.78 of damage is saved (B/C = 1.78).
Figure 6: Baseline AAD and AADA
- The MCA effectiveness and cost-effectiveness indicators:
The project protects an average of 54 inhabitants every year (AANAinhabitants, cf. Figure 7). In other words, thanks to the project, 79% of the inhabitants exposed to flood risk in the baseline case are no longer flooded, (we have AANinhabbaseline = 68, cf. Figure 7).
Achieving this objective of protecting the inhabitants costs €6,800 per inhabitant protected (Caverage/AANAinhab = 6,800).
The project also generates a co-benefit in terms of jobs saved. In fact, on average the project saves 16 jobs each year (AANAjobs).
Source: CGDD
Figure 8: The single-scenario analysis indicators for the PAPIs’ MCA
P: key indicator, S: secondary indicator
Source: CGDD
Source: CGDD
AN EVOLUTIONARY METHOD
This method of socio-economic evaluation of the PAPIs, which serves as a national level benchmark, is further enhanced by the progress made by the working group in charge of its development.
Recently, the work has allowed for the widening of: - the range of costs under consideration (e.g. environmental costs linked to infrastructure);
- the scope of the method for other types of projects (e.g. structure reinforcements).
Work underway aims at four objectives:
- the improvement of damage functions, for example by cross-referencing the resulting data with observed data;
- the introduction of new assets into the avoided monetary damage indicators (cf. Figure 1) (e.g. psychological damage, direct damage to roads); - the critical analysis and adaptation of tools and methods for other phenomena (torrential floods, coastal flooding, etc.) while taking into account their specific attributes;
- the development of methods and tools for the evaluation of other PAPI themes (e.g. evaluation of the measures for reducing building vulnerability, cf. Box 1).
Service de l’économie, de l’évaluation et de l’intégration du
développement durable
Sous-direction de l’Économie des Risques Naturels et des Risques
Tour Séquoia
92055 La Défense cedex
Courriel : ernr.seei.cgdd@developpement-durable.gouv.fr
www.ecologique-solidaire.gouv.fr
Commissariat général au développement durable
Resources :[1] Analyse multicritère des projets de prévention des inondations. Guide méthodologique 2018. CGDD
[2] The damage functions are available at this address: https://www.ecologique-solidaire.gouv.fr/levaluation-economique-des-projets-gestion-des-risques-naturels#e4
[3] The indicator documents are available in the technical annexes of the 2018 methodological guide. [4] This tool can be requested via: experts.amc@developpement-durable.gouv.fr
Copyright : June 2019 ISSN : 2555-7564