APPLICABILITY OF A TWO DIMENSIONAL,
DIGITALLY INTEGRATING, SILICON VIDICON SYSTEM IN THE DETECTION OF NATURAL RESOURCES
by
GREGORY BYRON PAVLIN B.S., Ohio University
1972
SUBMITTED IN PARTIAL FULFILLMENT OF THE REQUIREMENTS FOR THE DEGREE OF MASTER OF SCIENCE
at the
MASSACHUSETTS INSTITUTE OF TECHNOLOGY
September,1973 ,1
Signature of Author... .. .. 0-.- **I ev..m. io r..i.... i0*
Departm,t
,4f'
Earth nd Planetary Science,August 13,1973
Certified by.. ...
Thesis Supervisor Accepted by...
Chairman, Departmental Committee on Graduate Students
Lindgren
A
U 7"
RS(
1-03
2
APPLICABILITY OF A TWO DIMENSIONAL,
DIGITALLY INTEGRATING, SILICON VIDICON SYSTEM IN THE DETECTION OF NATURAL RESOURCES
By
Gregory Byron Pavlin Submitted to the
Department of Earth and Planetary Sciences August,1973
in partial fulfillment of the requirements for the degree of Master of Science
ABSTRACT
The feasibility of using a two-dimensional, digitally integrating silicon vidicon system (McCord and Westphal, 1972) to differentiate terrestrial rock structure and mineralization was explored.
The potential usefulness of the vidicon system for the detection of natural resources is based on its ability to pho-tometrically detect the spectral signature of terrestrial miner-als in the spectral range 400oo. to 1100.0 nanometers and pro-duce two-dimensional imagery. Interpretation of the imagery is based on developing libraries of recorded reflection spectra of geologic materials and the semiquantitative explanation of spec-tral features by Crystal Field Theory.
The instrumentation was tested for its ability to: dif-ferentiate minerals; resolve detailed mineralized rock structure; enhance imagery of rock structure and/or mineralized features using computer software techniques; identify mineralogy without prior ground truth; distinguish altered from unaltered rock units associated with porphyry copper deposits; perform as a practical
geophysical tool in the field.
It is concluded that the vidicon system is a potentially powerful geophysical tool that should be applied to geological problems by using remote-sensing techniques. However, its po-tential use will be realized only if the recommendations that developed fTom this study are acted upon.
Thesis Supervisor: Thomas B. McCord Title: Professor of Planetary Physics
DEDICATION
This work is dedicated in appreciation of my parents, Mr. Carl T. Pavlin Sr. and Mrs. Glennie L. Pavlin (nee, Clark), for their role in molding me into the person that I am.
ACKNOWLEDGEMENTS
To thank the many people who have 'assisted me in the plan-ning, experimentation, and processing of the data for the pur-poses of helping me produce a relevant thesis is an obligation that will take more than two pages of acknowledgements to satis-fy. To express my thanks through an acknowledgement page, is a cold means of expression; however, the following people's acknow-ledgement seems to be institutionally and financially the correct means of thanks at this time.
I am especially grateful to Bill Ezell of MITPAL who assist-ed me in all experimentation-- which at times was very dull work; and conversely, at times the work was very intense and exhausting. Lenny Vanderhave was an invaluable assistant in the rerun of the last experiment; his trouble shooting capabilities permitted the winning of respectable data.
Paul Kinnucan was my coach in the manipulation of the data with the LNS Computer. My gratitude is due Carlie Pieters, Law-rence Bass, and Jean Harrison for their advice, data processing, and picture processing respectively.
In addition to the advice and good will of my thesis advisor Dr. Thomas B. McCord, I was also fortunate to snare the advice of Dr. T. McGetchin, Dr. R. Burns, Dr. H. Fairbairn, Dr. R. Huguenin, Dr. J. Southard, and Dr. R. Naylor. The latter people are
respon-sible for keeping me on the right track when I left those tracks which were considered to be the best route in producing a relevant
thesis. Special thanks should be conferred on Tom McCord for his advice and concern for the problems that accompany graduate stu-dents.
To some readers, the following may seem to be nit-picking thanks; however, I consider it important to thank those unusual people who helped me with some logistical problems; that is, get-ting the right equipment to the right place at the right time. My gratitude is due some personnel of the M.I.T. Central Utili-ties Plant: George F. Gibney, George S. Reid, John Stowe, and Harold Browning. They assisted in the acquisition of electric generators, typewriters, tables and the time to work on my thesis
(while I was working to pay for my thesis).
In yet a different category, George Panoussis assisted me in a marathon geologic expedition through New England to determine a feasible site for a vidicon experiment. Miss Suzanne Sayer
generously discussed and enumerated the mineralogy of an outcrop that. was used in this study. The outcrop was the subject of Miss Sayer's thesis which discusses the outcrop in terms of genesis, absolute age and geochemical aspects.
There were others like Alan Goldberg and Bill Mixon who took time to advise and assist in the various aspects of prepara-tion for an experiment; they are menprepara-tioned here to emphasize the degree of help I had in performing this study. This lengthy and detailed acknowledgement was presented to illustrate hbw depend-ent a graduate studdepend-ent has to be in developing his thesis. I am not apologizing for the dependence upon these people, because in each case, I would have missed something during my stay at M.I.T.
6
INTRODUCTIONGeology is a science of observation that employs the visible portion of the electromagnetic spectrum. A field geolo-gist's purpose is to determine lithology on the basis of miner-alogy, petrology, structure, time relationships and genesis.
Understanding the geochemistry, depositional chronology, and spa-tial relationships(both surface and subsurface), permits the ge--ologist to predict the location of potential mineable mineral concentrations. Geophysics is an earth science that employs physics to expand the criteria of a geologist's predictions be-yond that of mere surficial observations.
This report describes a study of the feasibility of using an integrating vidicon system as a geophysical tool for the re-mote detection of terrestrial natural resources. Prior to this study, the vidicon system was used to map the compositional fea-tures of some planets. This report also records the procedures by which an instrument is tested for its usefulness in geophysi-cal exploration; consequently, the format of this manuscript will follow the order of experimentation rather closely.
Following a brief review of the instrumentation, a pres-entation of theory is given to prepare the reader for the discus-sion of the experiment's results. The experiments were designed test the instrumentation's ability to: differentiate mineralogy; resolve detailed mineralized rock structure; enhance imagery of rock structure and/or mineralized features using computer soft-ware techniques; identify mineralogy without prior ground truth; distinguish altered versus unaltered rock units associated with porphyry copper deposits; perform as a practical geophysical
7
tool in the field. After reviewing conclusions concerning the experimentation, this presentation terminates with a discussion of recommendations for refining this prototype instrument into a hardened, remote-sensing tool for geophysical exploration.
8 TABLE OF CONTENTS SUBJECT Abstract... Dedication... e Acknowledgements... Introduction... Table of Contents... Table of Figures... Table of Tables... Instrumentation... Theory... ... ***
Testing Ability to Differentia Background... Discussion... Conclusions...0 ... 000000000000 00000000*0*0 ... 0 ... 0 Mineralogy ... 0 ... 0
Testing Ability to Differentiate Mineralogy and Structure of Large Rock Samples
Background...0000 0000 0
Discussion...0
Testing Ability to Identify Mineralogy Without Ground Truth
Backgroundoo...ooo **oooo...
Discussion... A Controlled Linearity Test of the Vidicon System
Background...ooo...
Discussion...0
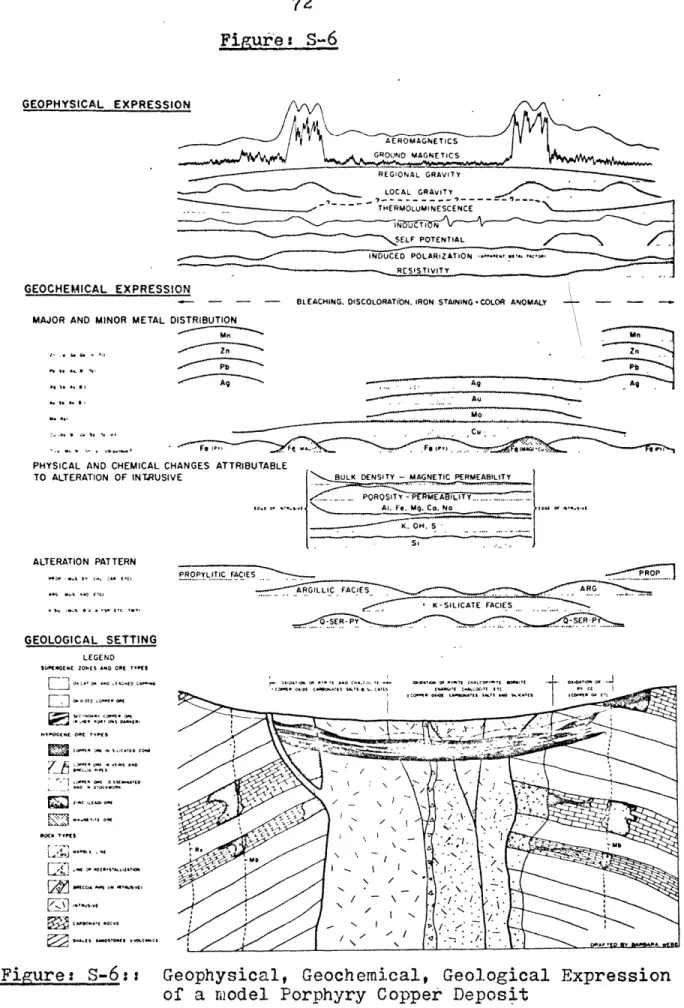
Vidicon Applications in Detection of Porphyry Copper De-posits Background...* .... *... * 66 PAGE
3
4
6
8 10 11 12 14 24 27 2934
36
5155
60
62
TABLE OF CONTENTS(continued)
SUBJECT PAGE
Discussion...o 82
The Vidicon System in the Field
Description of the Vidicon Survey Experiment(s). 102
Recommendations.o...*s.o..o...o... *ooo . . 109
Conclusions. . ... s.... * . . . . ... 112
Appendix I...115
Figure Co G- 1 G-2 G-3
S-1
S-2 G-4 G-5 P-1 P-2 P-3 S-3 P-4 P-5 P-6 P-7 P-8 P-9 P-10 P-11 S-4 P-12 P-13 P-14 P-15G-6
G-7 G-8 G-9 S-5 P-16s-6
S-10 S-11 S-12S-7
S-8
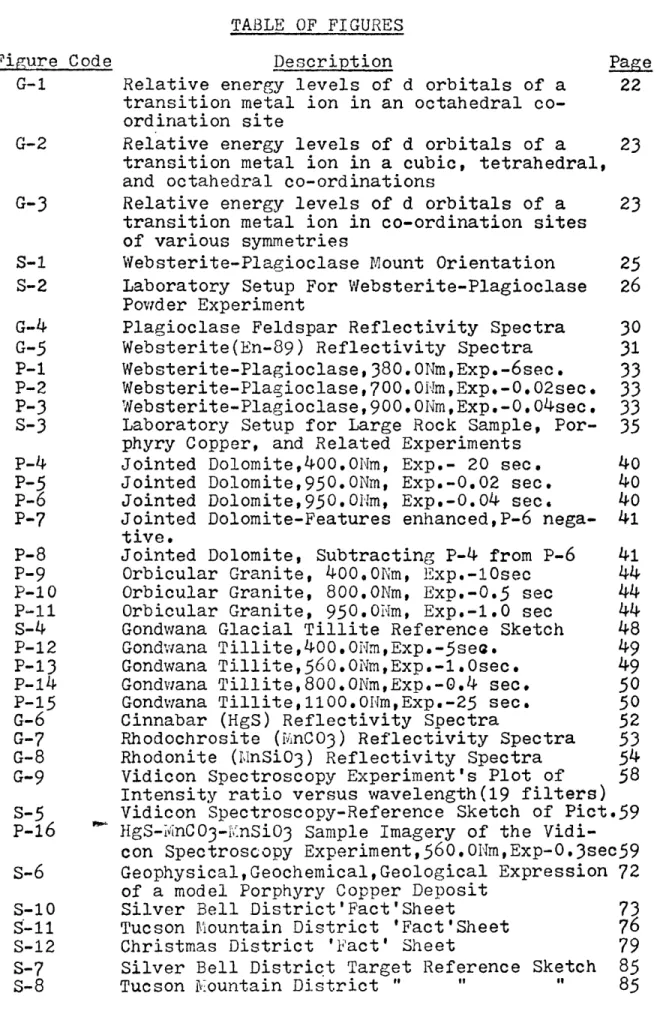
TABLE OF FIGURES de Description PageRelative energy levels of d orbitals of a 22 transition metal ion in an octahedral
co-ordination site
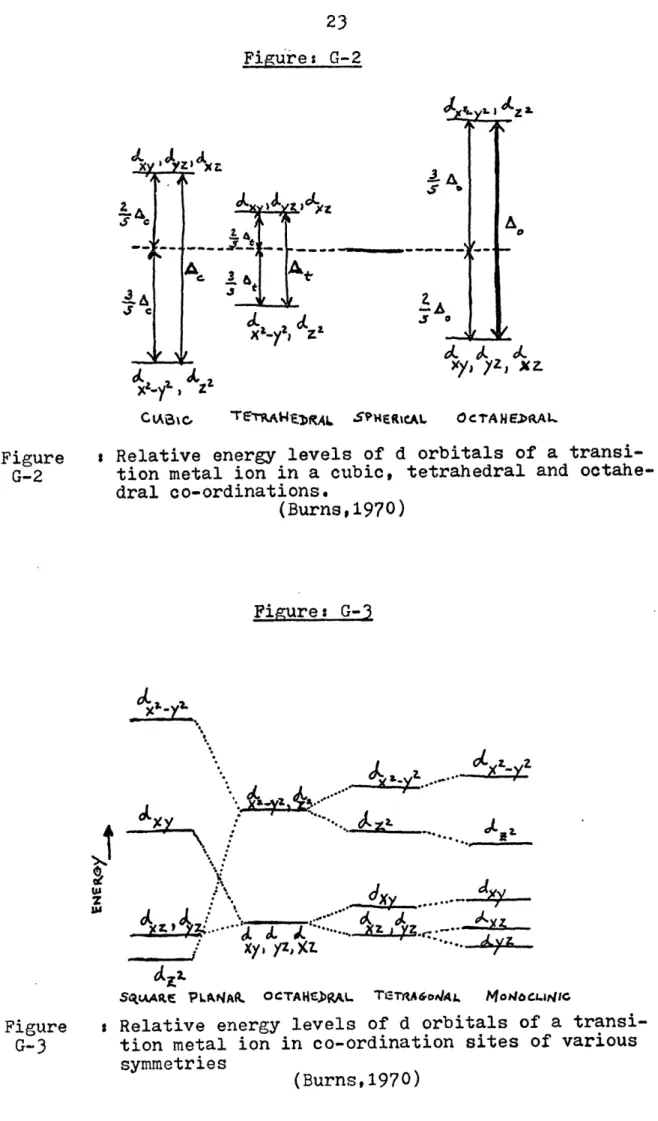
Relative energy levels of d orbitals of a 23 transition metal ion in a cubic, tetrahedral, and octahedral co-ordinations
Relative energy levels of d orbitals of a 23 transition metal ion in co-ordination sites
of various symmetries
Websterite-Plagioclase Mount Orientation 25 Laboratory Setup For Websterite-Plagioclase 26 Powder Experiment
Plagioclase Feldspar Reflectivity Spectra 30 Websterite(En-89) Reflectivity Spectra 31
Websterite-Plagioclase,380.ONm,Exp.-6sec. 33 Websterite-Plagioclase,700.0Nim,Exp.-0.02sec. 33 Websterite-Plagioclase,900.ONm,Exp.-O.O4sec.
33
Laboratory Setup for Large Rock Sample, Por- 35 phyry Copper, and Related ExperimentsJointed Dolomite,400.ONm, Exp.- 20 sec. 40 Jointed Dolomite,950.ONm, Exp.-0.02 sec. 40 Jointed Dolomite,950.0Nm, Exp.-0.04 sec. 40 Jointed Dolomite-Features enhanced,P-6 nega- 41 tive.
Jointed Dolomite, Subtracting P-4 from P-6 41 Orbicular Granite, 400.0Nm, Exp.-10sec 44
Orbicular Granite, 800.0Nm, Exp.-0.5 sec 44
Orbicular Granite, 950.0N'm, Exp.-1.0 sec 44
Gondwana Glacial Tillite Reference Sketch 48 Gondwaana Tillite,400.0NmExp.-5see. 49
Gondwana Tillite,560.ONmExp.-1.Osec. 49
Gondwana Tillite,800.ONm,Exp.-0.4 sec. 50
Gondwana Tillite,1100.0Nlm,Exp.-25 sec. 50 Cinnabar (HgS) Reflectivity Spectra 52
Rhodochrosite (inCO3) Reflectivity Spectra 53
Rhodonite (MnSiO3) Reflectivity Spectra 54 Vidicon Spectroscopy Experiment's Plot of 58 Intensity ratio versus wavelength(19 filters) Vidicon Spectroscopy-Reference Sketch of Pict.59 HgS-iMnC03--nSi03 Sample Imagery of the
Vidi-con Spectroscopy Experiment,560.O~lm,Exp-0.3sec59 Geophysical,Geochemical,Geological Expression 72 of a model Porphyry Copper Deposit
Silver Bell District'Fact'Sheet 73 Tucson Mountain District 'Fact'Sheet 76 Christmas District 'Fact' Sheet 79
Silver Bell District Target Reference Sketch 85
Figure Code P-17 P-18 P-19 P-20 P-21 P-22 P-23 P-24 P-25 P-26 P-27 P-28 P-29 P-30 S-9 P-31 P-32 P-33 P-34 P-35
P-36
P-37 S-13s-14
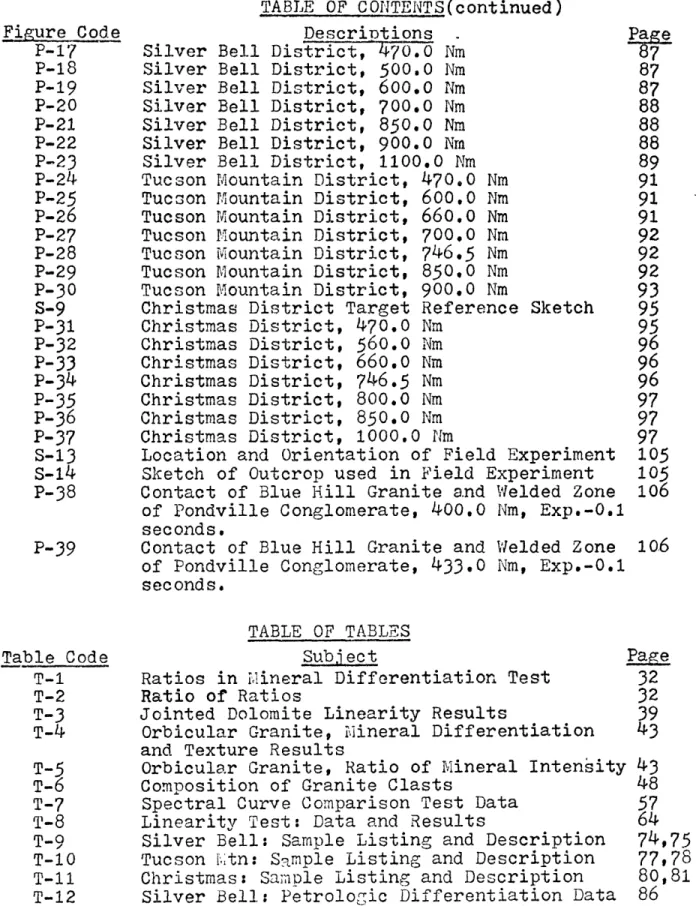
P-38 P-39 Table Code T-1 T-2 T-3 T-4 T-5 T-6 T-7 T-8 T-9 T-10 T-11 T-12 T-13 T-14 T-15 TABLE OF CONTENTS(continued) Descriptions -Silver Bell District, 470.0 NmSilver Bell District, 500.0 Nm 87 Silver Bell District, 600.0 Nm 87 Silver Bell District, 700.0 Nm 88 Silver Bell District, 850.0 Nm 88 Silver Bell District, 900.0 Nm 88 Silver Bell District, 1100.0 Nm 89 Tucson Mountain District, 470,0 Nm 91 Tucson Mountain District, 600.0 Nm
91
Tucson Mountain District, 660.0 Nm 91 Tucson Mountain District, 700.0 Nm 92 Tucson Mountain District, 746.5 Nm 92 Tucson Mountain District, 850.0 Nm 92 Tucson Mountain District, 900.0 Nm
93
Christmas District Target Reference Sketch
95
Christmas District, 470.0 Nm
95
Christmas District, 560.0 Nim96
Christmas District, 660.0
Nm96
Christmas District,
746.5
Nm
96
Christmas District, 800.0 Nm97
Christmas District, 850.0 Nm
97
Christmas District, 1000.0 Nm97
Location and Orientation of Field Experiment 105 Sketch of Outcrop used in F~ield Experiment 105
Contact of Blue Hill Granite and Welded Zone 106 of Pondville Conglomerate, 400.0 Nm, Exp.-0.1
seconds.
Contact of Blue Hill Granite and Welded Zone 10.6 of Pondville Conglomerate, 433.0 Nm, Exp.-0.1
seconds.
TABLE OF TABLES Subject
Ratios in Mineral Differentiation Test Ratio of Ratios
Jointed Dolomite Linearity Results
Orbicular Granite, Mineral Differentiation and Texture Results
Orbicular Granite, Ratio of Mineral Intensity Composition of Granite Clasts
Spectral Curve Comparison Test Data Linearity Test: Data and Results
Silver Bell: Sample Listing and Description Tucson btn: Sample Listing and Description Christmas: Sample Listing and Description Silver Bell: Petrologic Differentiation Data Tucson Mtn: Petrologic Differentiation Data Christmas: Petrologic Differentiation Data Guide to Common Absorption Bands in Reflec-tivity Spectra of Minerals
Page
32
3239
4343
4857
64
74,75
77,78 80,81 86 9094
113,114INSTRUMENTATION
The evaluated instrument is a two-dimensional, digit-ally integrating, silicon vidicon system. This system's
impor-tance is founded'on its proven ability to detect and provide two-dimensional imagery for the spectral range of 400.0 Nm to 1100.0 Nm(Nm-nanometer)(McCord and Westphal, 1972). This ability per-mits the operator to extend his observations of a subject from the visible to the near-infrared portion of the electromagnetic spectrum.
The general mechanics of the vidicon system are as
fol-lows: visible and near-infrared radiation from a target is fo-cused by an optical system on to the detector of the vidicon tube; the incident photon energy is converted to electrons which are integrated at each picture element for the given exposure time: the resultant record of intensity is transcribed on to a magnetic tape. The data tape may then be manipulated by using several functions of the computer library to obtains printout of intensi-ties (0 to 255 scale); SC4020 pictures and plots; polaroid film imagery. Computer library functions that enhance different as-pects of the imagery(if used properly) do exist (Kunin, 1972).
The optics of the vidicon system were designed with mod-erate cost and simplicity in mind. The lens is a converted 80 mm Xerox lens with a focal length of 13.5 cm and a diaphragm that adjusts the f-stop from f-2 to f-8. This was ideal for
labora-tory studies that required a field of view of 8 to 30 cm; however it proved to be inadequate for field work requiring large fields of view(tens of meters). This lens also exhibited defocusing
13
when light with longer wavelengths (800.0 Nm to 1100.0 Nm) was used to examine various subjects.
Besides the optics, the vidicon system includes: a man-ual filter wheel which holds preselected interference filters for the particular experiment; electric shutter; vidicon tube contained within a coldbox cooled by solid C02 ; electronics rack
with vidicon monitor and controls; oscilloscope; cable; and mag-netic tape recorder. The system is described in detail by McCord and Westphal(1972) and Kunin(1972). The softwa're used in the data processing is thoroughly explained by Kunin (1972). The additional instrumentation used to perform this study's various
experiments are described in the respective experiment's discus-sion section.
14 THEORY
The scientific principles which support the usefulness of the vidicon system for geophysical applications incorporate geometrical optics, quantum mechanics, structural geology,
geo-chemistry, petrology, mineralogy and geomorphology. If the spec-tral character of light incident upon and reflected from a mater-ial is known, then the observed spectral differences may be ac-counted for by applying quantum mechanical models(crystal field theory). Spectral differences incorporate absorption bands and the bands respective characteristics: eg. width, position in the spectrum, etc. By the interpretation of these spectral differ-ences, the mineralogy and lithology of rock material may be iden-tified. The vidicon system is capable of detecting the spectral signatures of minerals. The latter feature, complemented by ap-plying spectral interpretation theory to the vidicon imagery, in-fers that the vidicon system would be potentially useful in the compositional mapping of mineralized terrestrial structure. The following discussion of the theoretical aspects of the vidicon system will permit an appreciation of the system's usefulness. Incident light upon a nonopaque dielectric material is both specularly and diffusely reflected. Specular reflection
occurs at the first interface between light transmitting media and is described by Fresnel's equations(Born and Wolf, 1970). Diffuse reflection occurs when incident light is transmitted through the target medium and diffusely radiated away from the target upon being reflected from an adjacent particle of the tar-get material(Fowles,196 8; Pieter-s, 1972). Photons of the
dif-fusely reflected component have experienced selective absorp-tion by the transmitting medium. Such absorpabsorp-tion is explained quantitatively by quantum mechanics and qualitatively by crystal. field theory (Burns, 1970). It is the diffusely reflected com-ponent that primarily accounts for the spectral signature of min-erals (Hunt and Salisbury, 1970; Burns, 1970).
To avoid redundancy, a discussion of specular reflection in terms of Fresnel's equations is omitted; however, a thorough discussion of this subject may be found in Born and Wolf(1970), Jenkins and White(1957), etc. So that the discussions of experi-ments may be understandable, the remainder of this section will discuss the concepts of diffuse reflection and crystal field theory.
To reiterate, the diffuse component of reflection from a dielectric material arises from the reflection of light from a crystalline material's surficial particles after the light has been previously transmitted by adjacent particles. During the transmission, the electromagnetic wave experiences absorption to a degree dependent upon the associated photon energies. The ab-sorption results from interaction of the photons with the elec-tronic structure of the crystalline medium. Photon absorption is a function of the mean optical path length that the light trav-elled throgh the absorbing medium. Size of the particulate ma-terial, the porosity of the mama-terial, and the phase of the irra-diance effect the mean optical path length(Pieters, 1972).
Crystal field theory is a semiquantitative theory that employs quantum mechanics, electrostatics, and physical
mineral-16
ogy concepts to explain the absorption bands of both the trans-mission and reflection spectra of minerals containing either
transition or lanthanide elements (Burns, 1970; Gaffey, 1973). This theory serves to explain the spectral reflectance absorption bands of various minerals and permits the determination of an unknown mineral's chemistry through the application of the theory to spectral interpretation(Burns,1970; Adams and Filice,1967;
Mc-Cord and Adams, 1970).
Transition elements are characterized by the partly
fill-ing of their 'd' and 'f' shells (Quagliano, 1963). The elements
of the first transition series are: Sc, Ti, V, Cr, Mn, Fe, Co, Ni, Cu and the adjacent series ions of K, Ca, Zn, Ga, and Ge. Each of these element's ions, when located in an isolated state, has its 'd' orbitals at an equal energy state and are "degenerate"
(Burns, 1970; Gaffey, 1973). When these ions within a crystal-line material interact electrostatically in the crystal field, the transition element's orbitals are distorted from their de-generate state. This distortion is due to the electrostatic
forces imposed by the coordination (cations surrounded by anions) of those ions in the crystal. The distortion of the orbitals forces the transition element electrons to seek nondegenerate energy levels (Gaffey, 1973; Burns, 1970; Pieters, 1972). The redistribution of energy may result from the coordination of ions. or ligands (dipolar group with an assigned charge)(Burns, 1970). The change in the orbital's energy levels, or the energy differ-ential, corresponds directly to the energy of the photons ab-sorbed by the mineral. The abab-sorbed photon energy permits the
electrons to make the transition from the degenerate to the nondegenerate states (Castellan, 1971; Pieters, 1972; Gaffey,
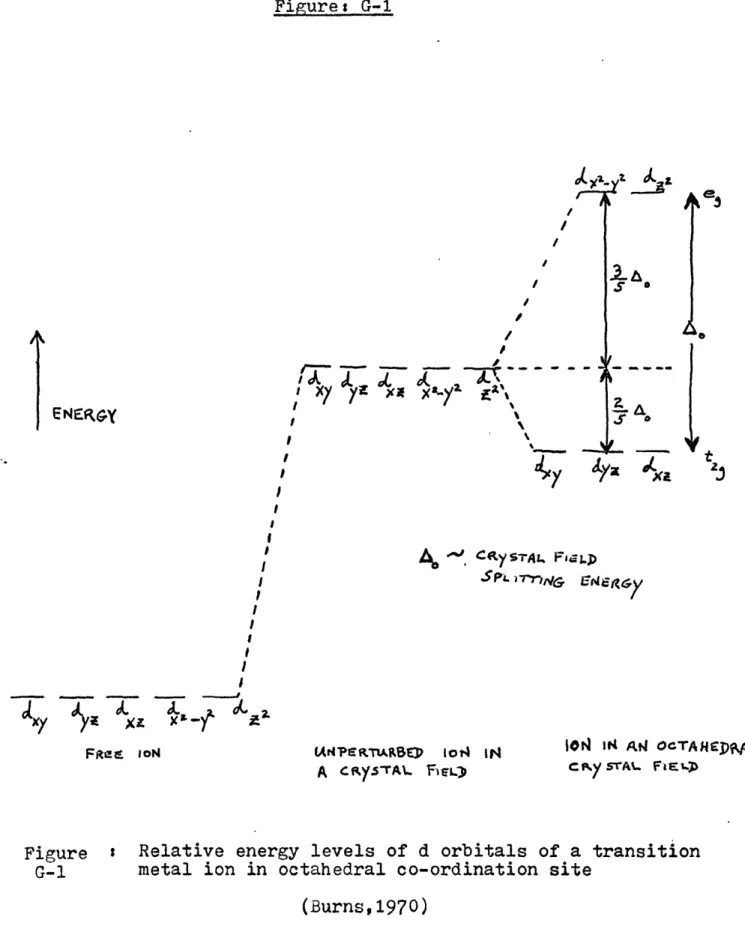
1973). Figures G-1, G-2, G-3 illustrate the discussed concepts; ies effects of crystal coordination on the orbitals' energy
states; variation of energy levels as a function of the coord-ination site symmetries. The magnitude of the energy differen-tial and the respective energy of the absorbed photon is a func-tion of the crystal coordinafunc-tion state(Mason and Berry, 1968), the transition ion itself, and the distances between the adjacent interacting ions. These effects are enhanced by more differenti-ation of energy levels when the symmetry of the crystal site is distorted (Burns, 1970).
Absorption bands are also caused by charge transfer.
Charge transfer occurs when electrons migrate between neighboring ions - anions, cations, ligands. This process is attributed to photochemical oxidation-reduction of a mineral by photons of the ultraviolet and visible regions of the electromagnetic spectrum. Cinnabar and other sulphides illustrate this process (See Figure G-6, Cinnabar)(Burns,1970; Hunt and Salisbury, 1970).
The diffuse reflection spectral absorption bands, pro-duced by the selective absorption of photons by the mineral, are variable in width. This feature corresponds to the thermal
vibra-tions of the crystal lattice where the mean of the band correlates to the mean cation-anion distances(Burns, 1970).
The previous discussion accounts for absorption bands in the reflection spectrum of dielectric material; however there are other effects that alter the spectral features. These effects
18
of particle size, illumination angle (angle between the light source, target, and detector), packing of particulate material and compositional mixing of particles have been investigated by Adams and Filice(1967) and Gaffey(1973). These effects will be reviewed to assist in the interpretation of reflectivity spectra.
Spectra interpretation is applicable to the vidicon system's
ability to map, differentiate, and identify terrestrial minerals. The albedo of a particulate material is a function of the particle size and the rock type(Adams and Filice, 1967). Gener-ally(there are exceptions) the albedo increases as the particle size decreases. This is because the ability of a particle to
transmit light and contribute to the diffuse reflection component increases with the decrease in particle size (Gaffey, 1973).
Packing a particulate material results in a slight in-crease of albedo in the visible spectral range and a dein-crease in the infrared portion of the spectrum. Adams and Filice(1967) concluded that the effects of packing had a negligible effect in the interpretation of reflectivity spectra.
The work of Adams and Filice(1967) examined the relation-ship of albedo to the angle of illumination(light source to tar-get to detector angle). Ratios of the reflected intensities in the red portion of the spectrum to the blue portion show an in-crease in albedo as the illumination angle inin-creases to thirty degrees. The intensity ratios decrease for illumination angles greater than thirty degrees. This effect may be relevant to
lab-oratory studies and some practical applications; eg., in remote detection of geologic materials illuminated by direct
sunlight--there may be an optimum illumination angle that may assist in the survey(complicated by shadow problems).
Gaffey (1973) gives an excellent discussion of the ef-fect of compositional mixing upon a reflection spectra. This effect arises when the material whose reflectivity is being re-corded consists of a variety of mineral phases. It would be hoped that the absorption band features might correspond to the relative abundances of the compositional minerals in a simple relationship. However, though relative abundances play a role
in determining the significance of an absorption band, the re-lationship is not a simple one. Gaffey resolves the following theorem: "The relative strength of an absorption feature is a function of the mean optical path length of a photon passing through the crystalline medium in relation to the variation of the optical density of the transmitting medium over the whole wavelength range under consideration." To paraphrase, if the optical mean path length is large with respect to the particle size and the optical density(ability of the material to absorb a photon) of the material outside the absorption bands is low, then the material will be characterized by a low albedo over the range of wavelengths used in the study. Similarly, if the opti-cal path length is long relative to the optiopti-cal density of the material at.-the absorption wavelengths, but short relative to
other wavelengths, then the absorption bands will contrast sig-nificantly with the continuum. Finally, if the optical path length is short relative to both the optical density at the ab-sorbing and nonabab-sorbing wavelengths, then the absorption bands
will appear weak and the reflection spectrum will appear
bright with no significant absorption anomalies(Gaffey, 1973). Gaffey concludes that reflectivity spectra and their absorption features are als.o functions of the number of mineral phases in the material, the nature of these phases(dielectric versus metal-lic), and the ratio of the optical density to particle size(these are causes that supplement those explained by crystal field
theory).
The effects of metallic impurities in dielectric samples and the reflectivity spectra of various opaque minerals have been studied by Hunt and Salisbury(1970-1971). Opaque minerals have featureless spectra with low albedo. The metallic impurities were found to decrease the overall reflectivity of dielectric
mineral samples.
Crystal field theory accounts for absorption bands' posi-tions as a function of the crystallographic optical axis along which the light was transmitted and absorbed. However, in rela-tion to the reflectivity spectra of powders, etc., the material usually consists of various sizes of particles with crystal axis randomly oriented. This random orientation results in absorp-tion features that are basically the summaabsorp-tion of the features characterizing the spectra obtained from each orientation of the crystal. Saffey(1973) observes that there is no simple relation-ship; that is a simple linear summation of spectral features
from each axis of the subject crystal. Gaffey finds that a re-flectivity spectra is the sum of the components of electronic transitions along all crystal axis of the medium multiplied by
the number of transitions for each given energy. This relation-ship may seem reasonable; however considerable trouble may be anticipated when quantitative probability is applied to determine the amount of absorption as a function of the degree of random crystal orientation.
It was not originally intended to paraphrase the litera-ture on theory related to absorption spectra of crystalline ma-terials in the ultraviolet through near-infrared spectral range. However, besides presenting both the complex and simple aspects
of the theory, this review will make the discussions and inter-pretations of various spectral features referred to in this study more understandable. It might be noted that though various physi-cal parameters effecting reflectivity spectra were discussed(eg., packing, emphasis on powdered samples, etc.),the samples used in this study were selected on the basis that their physical features were typical of geologic outcrops. Never-the-less, the studies
of powders, packing, particle size, etc., are all useful in the determination of information from reflectivity spectra and fil-tered two-dimensional vidicon imagery of rocks in situ.
22 Figure: G-1 I Xf f Exx Xa. Y I I y s -) s, 5k 3 . C66 rp YSTAL Fjj-p S PL -TnNC-r 6(4z6&
(Ar4?KTP~ARSrp jot4 IN ION It4 AW OcTANIpML A CRKSTA\.. F1L) CNY STAI.. FiE1.)
Figure : Relative energy levels of d orbitals of a transition G-1 metal ion in octahedral co-ordination site
(Burns,1970) ENERGY
xY a x
23 Figure: G-2
xy
dc
A
) X Z
CABiC, 'TEMA1RAL SPHERICAL OCTAN ERAI.
Figure : Relative energy levels of d orbitals of a transi-G-2 tion metal ion in a cubic, tetrahedral and
octahe-dral co-ordinations.
(Burns,1970)
Figure: G-3
su o... x
7 X
5SqzAAPgI PLANAk~ OCTANS.DRAL TC-RrA60AIA). MMOC48cit0
Figure
G-3
i Relative energy levels of d orbitals of a transi-tion metal ion in co-ordinatransi-tion sites of various
symmetries
(Burns,1970)
s5
-x( . 4zk
24
TESTING ABILITY TO DIFFERENTIATE MINERALOGY Background
-An experiment was performed in a laboratory environ-ment in which the ability of the vidicon system to differentiate mineralogy was tested. For this experiment, powdered samples of two distinct minerals were obtained. In order that the powders could be viewed by the vidicon system, a simple device involving a mirror mounted at forty-five degrees to the plane on which the samples would rest was constructed. This device is illustrated
in Figure S-2 along with the basic vidicon system equipment set
up for this experiment. The illustration shows only one light source, a 300 watt tungsten bulb with a reflector hood; this was replaced with symmetrically placed light sources( two-150 watt tungsten bulbs with reflector hoods).
The two mineral samples studied were plagioclase
feld-spar and a pyroxenite - websterite. The feldspar is a single
mineral having the formula NaAlSi308. Websterite is a pyroxenite, (Mg,Fe)2Si2O6, which in this sample's case would be termed 'En8 9' of the enstatite-ferrosillite solid solution series(Pieters,19?2). Pyroxenites are generally a coarse grained ultramafic consisting of hypersthene and some subordinate diopside(text description of the pyroxenite, websterite). Pyroxenites may have accessory
min-erals of biotite, hornblende and olivine. The plagioclase feld-spar sample was determined to be albite-the sodic member of the plagioclase solid solution series.
Both mineral samples were ground to a powder in a nonmetal-lic mortar and- sieved. The two samples were sieved to particles
25
less than 125 microns in diameter(the effects of particle size on the reflected light intensities relative to a MgO standard were not a concern in any of the experiments; however these ef-fects are known.- Hunt and Salisbury, 1970-1971). The mineral samples were placedA3/4" square, pale green glassine paper. The paper and the powder samples were then carefully placed on a 3" square glass slide which had been coated with the highly reflec-tive MgO a few minutes before the experiment was performed. The samples-MgO-glass stage mount was placed beneath the mirror of the horizontal viewing assembly. Both the pictures and respec-tive dark fields(Kunin,1972) were taken by the vidicon system.
Fiure: S-I
?ROX. /MOc.CV
Comments:- Light Source: 150 Watt Tungsten Bulb
- Vidicon Cold Box(Dewar) cooled with CO2 ice
- Most efficient laboratory procedure was to have (i) technician operating the vidicon while the other technician manipulated the rock samples, filter wheel, and made a log of the experiment(for the purposes of data processing)
- The only means of illumination was the light source; room was masked and dark; the filter wheel mount, dewar, and auxillary power supply unit was hooded to prevent saturation of the vidicon tube
LABORATORY SETUP FOR WEBSTERITE-PLAGIOCLASE POWDER EXPERIMENT
27 DISCUSSION
Experimental data was routinely processed; ies obtain SC4020 pictures, obtain print-out of intensities(for both pic-tures and dark fields), subtract dark fields from picpic-tures, per-form desired intensity ratios with computer, and obtain the final Polaroid pictures (Kunin, 1972). The final pictures are displayed in Figures P-1, P-2, and P-3. The numeric results are summarized in Figure T-1. The table presents the vidicon system's capabili-ties in terms of intensity ratios. For each picture taken over a narrow spectral range, the average 60 point intensity matrix of the websterite is divided by the average 60 point matrix of the feldspar. This is similar to a ratio of ratios technique
(McCord, 1968); except that the additional bother of ratioing the respective minerals average intensities to that of a given 60 element matrix of MIgO is neglected. This step is omitted because the NgO intensity denominators cancel out upon ratioing the ra-tios.
Table T-1 illustrates that for all wavelengths(380.ONm, 700.0 Nm, 900.ONm), the websterite was less reflective than the plagioclase feldspar. The table infers that the degree of ab-sorption is dependent upon wavelength. The diffuse reflection spectrum of websterite, made on a Cary 17 spectrometer, shows distinct absorption at 910.0 Nm(See Figure: G-4)(Pieters,1972). Crystal fied theory explains the band as due to the spin al-lowed absorption band for Fe2+(Pieters, 1972). Table T-1 shows that the vidicon system was able to resolve the absorption at 900.0 Nm for websterite as a result of this cation effect. To be sure that this absorption is.centered at 910.0 Nm, vidicon
28
pictures must be taken at wavelengths surrounding the absorption band. The resultant intensity ratios should increase for wave-lengths at plus and minus the 910.0 Nm band. This proof is dem-onstrated in a later experiment(experiment to identify mineralogy without ground truth) using other minerals.
Reflectivity spectra have been recorded for feldspars, including albite(Figure: G-4). In general, these spectra are flat with absorption increasing toward the blue end of the spec-trum and are highly reflective with respect to MgO(Hunt and Sal-isbury, 1970). These characteristics assist in the differentia-tion of websterite from feldspar. There is a wavelength where the reflectivity of the two minerals is identical with respect to Mg0. It is this unique wavelength that is used in some of the later experiments to act as a normalization base. Vidicon pictures are ratioed to the pictures taken at this unique wave-length so that enhancement of subtle absorption features may be accomplished. In this experiment, the normalization wavelength was closely satisfied at 380.0 Nm. Ratios of websterite to
plag-ioclase feldspar at 700.0 Nm and 900.0 Nm are ratioed to the ra-tios made at 380.0 Nm. Though the information provided does not add to the first set of ratios' results, the discussion and tech-nique is mentioned here for later reference.
The information provided by Table T-2 serves as warning with respect to the linearity of the vidicon system. A linear system is characterized by a consistency of intensity ratios for two areas of vidicon imagery as a function of exposure time, with-out changing filters, light source, or target areas. For the
29
pictures taken at 900.0 Nm and exposures of 0.02 and 0.04 sec-onds, the ratios of websterite to plagioclase intensities vary by approximately fifteen percent -- suggesting the possibilities
of a nonlinear vidicon system or high electric noise levels with-in the system. A nonlwith-inear vidicon system would be limited with-in its usefulness to the remote detection of mineralogy, photometry, and the mapping of composition. The possibility of nonlinearity
or high noise levels will be investigated more carefully in a later experiment. Past work with the vidicon system has cited excellent linearity of the system(McCord and Westphal,19?2), (McCord and Bosel, 1973).
CONCLUSIONS
In this first experiment, the vidicon system quite ade-quately differentiated the minerals websterite and plagioclase feldspar by using the absorption bands of these minerals as pre-dicted and explained by crystal field theory.
PLAGIOCLASE,VAR. ALBITE 668 AMELIA, VA.,
0 0 W10 0 -J Li cr 0R50
z LI0 -74pi
100
0 0 05LU
LU74-2
5011(
w
LUz
0.4 0.5 0.6 0.7
CC
W-AVELENGTH
a
IN
-MICRONS
1.0
1.5
WAVELENGTH IN MICRONS
Figure: G-450
0
2.0
.2.5
I
.7 .8
.3
1.0
WAVE L E NGTH my cos
I
I
l.E
1.3
1.4
1 4
1.5
1.6
I
)XFRASE REFL.ToN
SpecTPA
of Ell ---WE65T-RITE
, ?AVTctC .31KK LESS THAN I2, mracKoSFigure: G-5 Pj rETES ) I'v2..
6o
Q40
J-40
Figures T-1: Ratios in Mineral Differentiation Test*
Wavelength Mineral Ratio Ratio Result
380.ONm W 700.0Nm W 900.ONm W (Exposure-0.02sec) 900.ONm W (Exposure-0.04sec) ebsterite/Plagioclase ebsterite/Plagioclase ebsterite/Plagioclase ebsterite/Plagioclase
Fie: T-2: Ratio of Ratios**
(Websterite/Plagioclase,700Nm)//(Websterite/Plagioclase,380Nm) Result: 87.7% (Websterite/Plagioclase,900Nm)//(Websterite/Plagioclase,380Nm) Exp.-O.0O2sec Result: 65.5% (Websterite/Plagioclase,900Nm)//(Websterite/Plagioclase,38ONm) Exp.-0.04sec Result: 45.6%
*NOTE: These ratios are based on average of mineral target matrix elements; sixty for the websterite and sixty for the plag-ioclase feldspar.
**NOTE: These ratios obtained from dividing the results in the preceeding table.
74.24%
65.02%
48.82%
33
,Figure: P-1 Websterite-Plagioclase 380.0 Nm Exp. -6 .0 sec. Figure: P-2 Websterite-Plagioclase 700.0 Nm Exp.-O.02 sec. Figure: P-3 Websterite--Plagioclase 900.0 Nm Exp.-0.04 sec,TESTING ABILITY TO DIFFERENTIATE
MINERALOGY AND STRUCTURE OF LARGE ROCK SAMPLES Bac kground
Applying the theory and the results from the previous experiment, an experiment was performed to illustrate the vidi-con system's ability to differentiate both mineralogy and struc-ture of large rock samples under laboratory conditions. The lab-oratory environment is illustrated in Figure S-3. The rock sam-ples varied from 20 to 60 centimeters along their greatest
dimen-sion. An area of approximately 30 centimeters 'in diameter could be adequately resolved by the vidicon system at a distance of
ap-proximately 3.15 meters(target to detector). The rocks were il-luminated by a 150 watt tungsten bulb because its spectral char-acteristics are similar to that of the sun(except that it is shifted toward the infrared region of the spectrum due to the coolness of the bulb). The means of evenly illuminating the tar-get were constructed with available materials; however pains to insure uniform illumination were not taken, because in nonlabora-tory applications, a uniform illumination could not be depended upon(due to shadows, random clouds, etc.).
-The rock samples were selected on the basis of mineralo-gy, structure, and their abilities to best illustrate the capa-bilities of the vidicon system. Five rocks were chosen from the collections of the geology department of the Massachusetts In-stitute of Technology: Jointed Dolomite, Orbicular Granite, Gla-cial Tillite, Folded Narble, and an Olivine Basalt. Each of these will be discussed separately with regard to their physical nature and experimental results.
Comments:- Light Source: 150 Watt Tungsten Bulb
- Vidicon Cold Box(Dewar) Cooled with CO2 ice
- Most efficient laboratory procedure was to have 1 technician operating the vidicon system while the other technician manipulated the rock samples, filter wheel, and made a log of the experiment(for the purposes of data processing)
- The only means of illumination was the light source; room was masked and dark; the
filter wheel mount, dewar, and auxillary power supply,unit was masked and hooded to
prevent saturation of the vidicon tube
- Initial focusing was performed by using the test pattern box,replacing the test pattern with surface of the rock or target being "photographed" by the vidicon
system, and then fine focusing by observing the vidicon monitor.
LABORATORY SETUP FOR LARGE ROCK SAMPLE, PORPHYRY COPPERAND RELATED EXPERIMENTS
DISCUSSION
Probably the most interesting rock sample used in this experiment, because of its nature of illustrating the potential of the vidicon system in differentiating mineralogy and mapping structure, was a jointed dolomite(Figures P-4,P-5, and P-6).
This jointed dolomite(general formula:(Ca,Mg)C03) had a red-brown matrix coloration due to the presence of an oxidized iron cation,
Fe3t This sample had undergone tensional stress which formed a joint network in the rock matrix. These joints'were gradually mineralized by dolomite containing reduced iron(Fe2+) impurity. The Fe2+ cation and the mineral it was contained in are the cause
for the joints to appear green to the eye(Billings,1954IBurns,1970). Vidicon pictures were taken at 400.0 Nm and 950.0 Nm. Af-ter the dark fields had been subtracted(Kunin,1972), the images were enhanced by simply adding or subtracting picture intensities
(eg.:picture at 400.014m subtracted from the 950.0 Nm picture yields Figure P-8). Before discussing the various computer techniques
found to assist in enhancing imagery, a comparison of the two original pictures must be made(Figures P-4,5-,6). The filters used in these photographs were selected on the basis of the re-flectivity spectra of pure dolomites(Hunt and Salisbury,1970). According to those spectra, the dolomite should appear brighter
relative to"the MgO standard(located at the bottom right corner of
the pictures) at 950.0 Nm than at 400.0 Nm. Though this seems to be the case in the pictures, it cannot be known for sure until the pictures are scaled. Separate pictures are scaled by equalizing the intensity of the MgO for the-two pictures. A scaling factor
37
could be employed by the computer to adjust the intensities of the entire picture(whichever is chosen), so that the two pictures are comparable. This scaling technique assumes that the system is
linear in its response to reflected light intensity as a function of time.
Linearity of the system was checked by taking ratios of regional reflected intensities of the dolomite and comparing them
to those obtained from pictures taken at differzent exposure times (filter and light source constant). The results are listed in Fig-ure T-3. Clearly there is a variation of ratios with exposFig-ure of 6 to 10fo. This infers that the vidicon system is either nonlinear or has excessive noise problems. These results emphasized the need for a controlled linearity test to be performed.
By using the 950.0 Nm filter, the absorption band due to Fe2+ is illustrated by the low albedo of the joint. At 400.0 Nm, the joint pattern appears brighter than the matrix because Fe3+ ion, in its coordination with the dolomite, has caused absorption; while the Fe2+ ion of the joints has no absorption features. In
the practical world, these pictures illustrate the vidicon system's potential in mapping structure and identifying which ions are
causing the coloration of the target with the help of ground truth (knowledge of a target's characteristics prior to its formal ex-ploration).-P
If the 400.ONm and 950.0Nm pictures are not suitable for distinguishing structure, various computer techniques may be em-ployed to enhance the imagery. For example, Figure P-8 results from subtracting the 400.ONm pic.ture from the 950.0 Nm picture.
38
The process involved no theory but enhancement of joint pattern is obvious. Printing the negative image of Figure P-6 clearly enhances the contrast between the joint pattern and the matrix (Figure P-7). Using the SC4020 plotting routines(Kunin,1972), produced a contour enhancement of intensities of the joint-matrix regions and illustratednumeric anomalies in regions assumed to have uniform absorbing properties(this enhancement technique is
not illustrated in figure format due to difficulties in reproduction). In order to obtain the relative albedo 'of the dolomite
at the two wavelengths, either a ratio technique that compares the regions of the dolomite to the MgO standard or a ratio pro-cess that compares two regions of the dolomite at each wavelength would have to be employed. This would show whether the joint and matrix pattern are brighter at 950.0 Nm or 400.0 Nm. Using more filters, it would be possible to determine if the material is a dolomite or a sandstone(by plotting ratios versus wavelength) (See Figure G-9 and discussion on page 51).
Tentative conclusions from this experiment are that the vidicon system can determine the ions causing the absorptions
de-spite the uniformity of the sample's general composition. The vidicon's ability to enhance imagery features was illustrated and discussed. In actual geophysical surveys, points common to both vidicon pictures and a topographic map might be known. If the two are superimposed, the structure could be mapped onto the to-pographic map. This concept is applied to aerial photography and is a great tool in mineral exploration.
Figures _T-:JOINTED DOLOMITE LINEARITY RESULTS REGION
Coordinites
#Intensity Elements Exposure Intensit
Average Fe2+ Fe3+
(65-68,165-171)
(81-84,170-176) 28 28[Ratio: Fe2+/Fe3+
=
2._871
Fe2+
(65-68,165-171)
Fe3+
(81-84 170-176)
2828 4244/28 4834/28 1290/28 1600/28Ratio: Fe2+/Fe3+
=
0.80
Ratio Variation: 7_0f Fe2+ Fe3+ Fe2+ . Fe3+ (81-85,103-107) 25 (90-94,130-134) 25 Ratio: Fe2+/Fe3+ = (81-85,103-107) 25 (90-94,130-134) 25 Ratio: Fe2+/Fe3+ = 0.69 Ratio Variation: 10% 3740/254689/25
1137/25 1628/25 4559/30 5797/30 1421/301956/30
Fo2+ (129-133,193-198) 30 Fe3+ (161-165,161-166) 30Ratio: Fe2+/Fe3+
=
_0.78
Fe2+ (129-133,193-198) Fe3+ (161-165,161-166) 30 30 Ratio: Fe2+/Fe3+ = .0_.2 Ratio Variation: _6.0RESULT: 6-10% Variation in reflected intensity ratios with expo--sure time holding all other parameters constant....infers nonlinearity of the vidicon system.
40 Figure: P-4 Jointed Dolo-mite 400.0 Nm Exp.-20 sec. Figure: P-5 Jointed Dolo-mite 950.0 Nm Exp.-0.02 sec. Figure: P--6 Jointed Dolo-.mite 950.0 Nm Exp.-0.04 sec.
f..
4fFigure: P-'
Jointed
Dolo-mite with
fea-tures enhanced (Negative, P-6) 950.0 Nm Exp.-0.04 sec. Figure: P-8 Jointed Dolo-mite with
fea-tures enhanced by subtracting Figure P-4 from Figure P-6.
42
To assist in a rough determination of the vidicon sys-tem's resolving power, an orbicular granite(Figure P-9,10,11) was chosen because of its unusual structure and the number of
mineral phases in its composition. The circular structures in this granitic rock are segregations of minerals that are explained by various differentiation processes(Johannson,1931) in the gran-itic magma. With reference to the picture taken at 950.0Nm (Fig-ure P-11), a brief mineral description is in order. Orthoclase
feldspar appears snow white. Plagioclase feldspar and quartz ap-pears as splotches of grey intermixed with white feldspar. The more massive dark grey to black regions(inner orbicles) are
com-posed of fine feldspar and biotite crystals. The matrix of the rock is coarse biotite, augite, and hornblende. Despite the pic-ture's poor focus((due to the crude means available for focusing the image upon the vidicon detector(to be discussed in the sec-tion on field performance)), rock features having minimum linear dimensions of 0.15 mm could be resolved from 3.15 meters with
per-fect focusing conditions.
Pictures were taken at 400.0 Nm, 800.0 Nm and 950.0 Nm to illustrate how the absorption of photons allows the differenti-ation of minerals. However, this was accomplished without using the absorption bands. If two minerals are spectrally flat and featureless(quartz and plagioclase-labradorite), then the mineral that has greater reflectivity over a spectral range(quartz in this case) should be distinct from the other mineral at any wavelength. This explains the consistent differentiation of biotite from or-thoclase feldspar in all vidicon pictures. However, problems
43
Mineral
Figure:T-4: ORBICULAR GRANITE
Mlineral DiIfferentiation and Texture Results
Location on Intensity Av Picture 400. ONm Orthoclase Feldspar (170-175,131-136)(36) 175.4 Quartz Quartz (157-160,198-203)(26) 117.6 (136-140.229-235)(35) 120.9 Fine Biotite(144-148,177-183135) 84.0 (minor qtz) ( " feldspar) Coarse (64-69,130-133) (20) 42.5 Biotite (No Mixture) ** **** ** ** *** **** * *******
Figure: M: RATIO OF MINERAL INTENSITIES*
erages at: 800.0Nm 950.ONm
236.0
134.3 72.0 40.6 111.0 64.7 70.0 39.6 28.3 Subjcots of Ratio (Relative to Quartz) Wavelengths: Orthoclase/Quartz Fine Biotite/Quartz Coarse Biotite/Quartz (Relative to Orthoclase) Quartz/Orthoclase Fine Biotite/Orthoclase Coarse Biotite/Orthoclase*NOTE: Bottom table of results is based on the average ties listed in the preceeding table.
intensi-400. 0Nm 1.49 0.71 0.36 800. N
1.75
0.53 0.300.56
0.30 0.17 950.ONm 1.7l 0.61 0.430.58
0.35 0.25 0.67 0.47 0.2444 Figure: P-9 'I Orbicular Granite 400.0 Nm Exp.-10 sec. Figure: P-10 Orbicular Granite 800.0 Nm Exp.-O.05 sec. Figure: P-11 Orbicular Granite 950.0 Nm Exp.-1-.O sec. 04
45
arise when the reflection spectra are similar; eg: Rhodochro-site versus MagneRhodochro-site (Hunt and Salisbury, 1971). To differen-tiate minerals with similar spectral reflectivity levels, use of their absorption bands' differences is necessary.
The orbicular granite could be anologized to the intru-sive structures observed from an aircraft over the south-western-region of the United States. In applying the vidicon system to the mapping of particular structures, ground truth of the target would have to be obtained. This would basically call for the determination of the lithology that comprises the structure and the region surrounding the structure. With the latter knowledge,
interference filters that occupied the mineralization's absorp-tion bands and continuum wouldbe selected for the vidicon survey.
If the absorption bands are distinctive and not shared by other minerals and/or rock units of the region, then a particular lith-ology or structure may be mapped. Such a procedure would have considerable value in mining exploration.
Another rock sample that depicted terrestrial surface
features was a glacial tillite; Precambrian Gondwana Conglomerate-Tillite, of the Cobalt Series-obtained by Robert Shrock near Kirk-land Lake, Ontario. This tillite consists of granitic clasts of variable composition(Figure P-13, Table T-6) in a chloritic clay matrix(greywacke(?)). The main compositional minerals were de-termined prior to the experiment. Filters for differentiating min-erals were selected using the latter information and the Hunt and Salisbury reflectivity spectral curves(1970-1971). Unfortunately, the minerals were not the type that could be differentiated by
46
the subtle use of absorption bands. Instead, according to the reflectivity spectra of Hunt and Salisbury(1970-1971), the struc-ture and mineralogy should appear distinct at any wavelength. Pictures were taken at 400.0, 560.0, 800.0, and 1100.0 Nms.(Fig-ures P-12,13,14,15). If the obvious poor focus and saturation is ignored(to be discussed in a later section), it is obvious that the key structures of the granites in the chloritic matrix are dis-tinguishable. The average albedo of each granitic clast is a
function of the distinct compositional differences of each gran-ite relative to the others. Because of the poor quality of the 400.0 Nm and 1100.0 Nm pictures, the SC4020 plot routine that was discussed earlier(Kunin,1972) was employed. The plotting of the pictures was a more concise means of determining which mineralogy was most directly effecting the albedo of the granites.
At 400.0 Nm, Granite II(Figure S-4) had the highest albedo due to its significant quartz composition(Table T-6). The other three granites' low quartz compositions and amphibole content
made their reflectivities comparable to the matrix(Hunt and Salis-bury,1970) which resulted in poor contrast.. The intensity plots
illustrated that at 560.0 Nm, Granites II and III have the high-est albedo. Reflectivity spectra of Hunt and Salisbury(1970-1971) suggest that the high concentrations of hornblende and quartz
for Granite-II and the high concentrations of hornblende for Gran-ite III are the minerals responsible for the high albedo. At
800.0 Nm the chlorite is absorbing due to Fe3+ ion in its coord-ination state(Hunt and Salisbury,1970). This absorption permits contrast between the four granites relative to the matrix; however
4.7
to differentiate the granites relative to each other is diffi-cult. The reason for the difficulty is that only Granite I has enough quartz content to give it a distinct albedo relative to the others; but the composition of the remaining granites are similar in their quartz-poor nature. The 1100.0 Nm filter pic-ture is very distorted and complicated by the difficulties in focusing the equipment; the intensity plots were of no real help in this case because of the overall picture quality.
The remaining two rock samples observed were a banded marble and an olivine basalt. The marble exhibited a fold struc-ture that is a common terrestrial crust feastruc-ture. The marble's structure was resolved adequately(no figures because of the sat-urated nature of the pictures). The olivine basalt contained oli-vine phenocrysts; these have absorption bands at 1000.ONm due to Fe2+in six-fold coordination. The olivine-feldspar matrix ex-perienced similar absorptions at 1000.0 Nm for the same reasons. The latter similarity may account for the inability of the vidicon
system to dfferentiate phenocrysts from matrix material at 950.0 Nm; though the low contrast may be attributsd to saturation(no figures). The low contrast phenomena is predicted by:crystal field theory; olivine reflectivity spectra(Hunt and Salisbury, 1970); and the reflectivity spectra for a grey basalt(Adams and Filice, 197). A second experiment was performed on the basalt sample. The pictures were of poor quality again leaving this investigation of low contrast phenomena open to speculation.
48 Figure:t S-4
Glacial TillitIe Referenc
Figure: T-6 Granite I : Granite II: GraniteII a Granite IVs ( See Table T-6)
Composition of Granite Clasts 80% Red-Pink Orthoclase Feldspar 10% Weathered Hornblende
10% Muscovite(?) and Quartz 25% Hornblende and Biotite 40% Pink Orthoclase Feldspar
35%
Quartz
55%
Weathered Hornblende(Biotite?)45% Pink Orthoclase Feldspar 10% Quartz
15% Hornblende and Biotite
35% Pink Orthoclase Feldspar
35% White Orthoclase Feldspar
5%
Quartz
49
Figure: P-12 Gondwana Tillite 400.0 Nm Exp.-5 sec. FIigure: P-13 Gondwana Tillite 560.0 Nm Exp.-1.0 sec.950 Figure: P-14 Gondwana Tillite 800.0 Nm Exp.-0.4 sec. Figure: P-15 Gondwana Tillite 1100.0 Nm Exp.-25 sec.
TESTING ABILITY TO IDENTIFY MINERALOGY WITHOUT GROUND TRUTH
Background
During a remote sensing survey with the vidicon system, there could conceivably occur a time when there was no available ground truth from which interference filters could be selected
for a survey. If the vidicon system could identify mineralogy, with the assistance of computer processing and a library of
ab-solute reflectivity spectra(eg. Hunt and Salisbury), then it would provide a valuable tool in ore mineral exploration that
exceeded its proven value in detection, differentiation, and map-ping of geologic material.
Absolute reflectivity spectra have been obtained for a variety of common minerals(Hunt and Salisbury). The process
con-sists of plotting the ratio of the reflected intensity of a min-eral to a standard's reflectivity(jgO, sandblasted gold) versus wavelength (Hunt and Salisbury,1970-1971;-Adams and Filice,1967). An experiment was performed to obtain the ratio of the recorded intensities of minerals with respect to the subsaturation
inten-sities of a MgO standard. These ratios were plotted versus wave-length. The resulting spectral curves were compared to published absolute reflectivity spectra in order to identify the minerals. This was basically a crude form of vidicon spectroscopy.
The laboratory setup is illustrated in Figure S-3 and the. procedure followed is similar to the experimental procedures in-volving large rock samples(page 34). The minerals chosen in this study were cinnabar(HgS-mercury ore), rhodochrosite(MnC03), and rhodonite(NnSiO3). Cinnabar was selected for its'simple spectra;
CINNABAR 133B MANHATTANNEV.
0
0100 LUJ Lez
O
0
50010
LUz
0
O.4 0.5 0.6 0.7 0WAVELENGTH
"o
IN MICRONS
a
WAVELENGTH IN MICRONS
Figure: G-61.0
1.5
2.0
2.5
CATA.IAARCA
67
PROVENEE,ARGENTaNA
0
0
10050
-LJzo
9L0
Ioo
950
LAJa:
z
O
Uj CLJK
1
I I I I10
I I I I ! I1.5
WAVELENGTH IN
20
Figure: G-7RHODOCHROSITE
04 0.5 0.6 07
WAVELENGTH
IN MICRONS
MICRONS
25
54 Figpur e t G Rhodonite (LnSiO3 ) RHODONITE 0 0 w AUGITE cc u AUGITE
z
0 -j t- SPODUMENE w z FASSAITE w JADEITE 3. 0.4 0.5 0.6 0.7 . -8 Reflectiv O 1.5 2.0 WAVELENGTH IN MICRONSie. conduction band at approximately 600.0 Nm causes low albedo
from 400.0 Nm to 600.0 Nm and high albedo from 600.0 Nm to 1100.0
Nm(sharp increase in albedo at 600.0 Nm). Figures G-6, S-5, and P-16 illustrate cinnabar's absolute reflectivity spectra, position relative to the target pattern, and its appearance on a processed vidicon picture,respectively. Rhodochrosite and Rhodonite were
selected because of the fine, distinct electronic absorptions that the Mn2+ ion in octahedral coordination produced at 340.0 Nm, 370.0 Nm, 410.0 Nm, 450.0 Nm, and 550.0 Nm. Figures -P-7,8 are the
ab-solute reflectivity spectra of rhodochrosite and rhodonite re-spectively; whereas Figure S-5 and P-16 illustrate the minerals' location on the target pattern and processed vidicon pictures.
DISCUSSION
In order to successfully perform a reasonable vidicon spectroscopy experiment, several interference filters had to be selected in order to adequately illustrate the minerals' absorp-tion bands and/or conducabsorp-tion bands. Unfortunately, the filters available for the experiment did not adequately correspond to the absorption features of rhodonite and rhodochrosite. There were filters that covered the continuum but there was only one filter that corresponded to a Mn+2 absorption band(560.0Nm). Never-the-less, nineteen filters were used and the resulting pictures and print-out of intensities(O to 255 scale) permitted ratios of min-erals' intensities to standard WgO intensity to be determined(Fig-ure -T-7). The averages of table T-7 are plotted in Figdetermined(Fig-ure G-9 relative to wavelengths of the visible and near-infrared spectra.