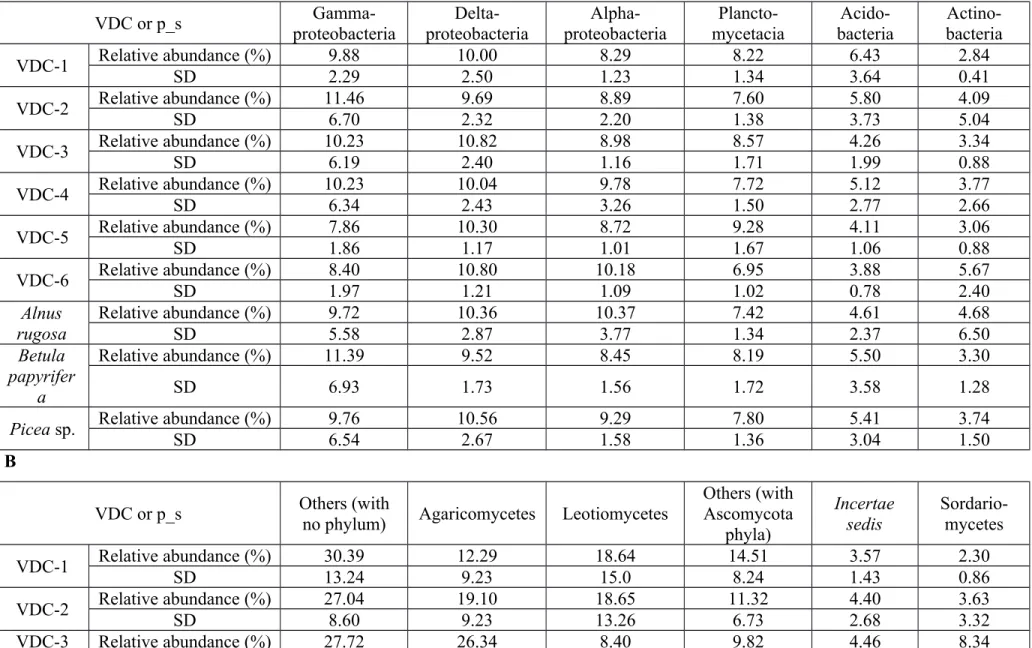
Table S7. Relative abundance of transcripts (%) of the 6 most abundant bacteria (A) and fungi (B) classes between the different vegetation density classes and plant species. SD: standard-deviation, VDC: vegetation density classes, p_s: plant species.
A
VDC or p_s Gamma-
proteobacteria Delta-
proteobacteria Alpha-
proteobacteria Plancto-
mycetacia Acido-
bacteria Actino- bacteria
VDC-1 Relative abundance (%) 9.88 10.00 8.29 8.22 6.43 2.84
SD 2.29 2.50 1.23 1.34 3.64 0.41
VDC-2 Relative abundance (%) 11.46 9.69 8.89 7.60 5.80 4.09
SD 6.70 2.32 2.20 1.38 3.73 5.04
VDC-3 Relative abundance (%) 10.23 10.82 8.98 8.57 4.26 3.34
SD 6.19 2.40 1.16 1.71 1.99 0.88
VDC-4 Relative abundance (%) 10.23 10.04 9.78 7.72 5.12 3.77
SD 6.34 2.43 3.26 1.50 2.77 2.66
VDC-5 Relative abundance (%) 7.86 10.30 8.72 9.28 4.11 3.06
SD 1.86 1.17 1.01 1.67 1.06 0.88
VDC-6 Relative abundance (%) 8.40 10.80 10.18 6.95 3.88 5.67
SD 1.97 1.21 1.09 1.02 0.78 2.40
Alnus rugosa
Relative abundance (%) 9.72 10.36 10.37 7.42 4.61 4.68
SD 5.58 2.87 3.77 1.34 2.37 6.50
Betula papyrifer
a
Relative abundance (%) 11.39 9.52 8.45 8.19 5.50 3.30
SD 6.93 1.73 1.56 1.72 3.58 1.28
Picea sp. Relative abundance (%) 9.76 10.56 9.29 7.80 5.41 3.74
SD 6.54 2.67 1.58 1.36 3.04 1.50
B
VDC or p_s Others (with
no phylum) Agaricomycetes Leotiomycetes Others (with Ascomycota
phyla)
Incertae sedis
Sordario- mycetes
VDC-1 Relative abundance (%) 30.39 12.29 18.64 14.51 3.57 2.30
SD 13.24 9.23 15.0 8.24 1.43 0.86
VDC-2 Relative abundance (%) 27.04 19.10 18.65 11.32 4.40 3.63
SD 8.60 9.23 13.26 6.73 2.68 3.32
VDC-3 Relative abundance (%) 27.72 26.34 8.40 9.82 4.46 8.34
SD 8.54 11.27 8.10 4.17 1.58 6.31
VDC-4 Relative abundance (%) 26.75 22.87 14.21 9.45 5.52 4.50
SD 7.55 11.16 11.62 3.01 4.78 3.61
VDC-5 Relative abundance (%) 26.91 20.31 5.97 12.82 12.74 4.18
SD 6.89 13.48 3.42 7.99 13.29 2.69
VDC-6 Relative abundance (%) 27.21 11.29 5.70 9.62 19.66 4.64
SD 7.38 3.89 12.15 2.33 11.59 2.06
Alnus rugosa
Relative abundance (%) 25.51 23.51 13.57 9.25 4.89 6.36
SD 6.92 10.43 10.83 2.82 3.21 5.54
Betula papyrifer
a
Relative abundance (%) 27.00 21.23 17.88 10.21 4.65 3.63
SD 8.66 11.24 13.15 4.61 3.03 2.52
Picea sp. Relative abundance (%) 28.36 21.17 12.95 10.99 5.64 4.20
SD 7.93 10.24 11.79 6.43 5.39 2.57