HAL Id: hal-02623866
https://hal.archives-ouvertes.fr/hal-02623866
Submitted on 26 May 2020
HAL is a multi-disciplinary open access
archive for the deposit and dissemination of
sci-entific research documents, whether they are
pub-lished or not. The documents may come from
teaching and research institutions in France or
abroad, or from public or private research centers.
L’archive ouverte pluridisciplinaire HAL, est
destinée au dépôt et à la diffusion de documents
scientifiques de niveau recherche, publiés ou non,
émanant des établissements d’enseignement et de
recherche français ou étrangers, des laboratoires
publics ou privés.
A new empirical model for enhancing well log
permeability prediction, using nonlinear regression
method: Case study from Hassi-Berkine oil field
reservoir -Algeria
H Belhouchet, M Benzagouta, A Dobbi, A Alquraishi, Joelle Duplay, Oum
Bouaghi
To cite this version:
H Belhouchet, M Benzagouta, A Dobbi, A Alquraishi, Joelle Duplay, et al.. A new empirical model
for enhancing well log permeability prediction, using nonlinear regression method: Case study from
Hassi-Berkine oil field reservoir -Algeria. Journal of King Saud University - Engineering Sciences, In
press. �hal-02623866�
A new empirical model for enhancing well log permeability prediction,
using nonlinear regression method: Case study from Hassi-Berkine oil
field reservoir – Algeria
H.E. Belhouchet
a,⇑, M.S. Benzagouta
b, A. Dobbi
a, A. Alquraishi
c, J. Duplay
da Department of geology, Faculty of Hydrocarbons, Renewable Energies and Earth and Universe Sciences, Kasdi Merbah University, Ouargla, Algeria b Department of Geology, Larbi Ben Mhidi University Oum Bouaghi, Algeria
c King Abdulaziz Center for Sciences and Technology (KACST), Riyadh, KSA d Department of Geology (LHGes), University of Strasbourg, France
Keywords: Permeability
Reservoir characterization Rock typing
Hydraulic unite Flow zone indicator
a b s t r a c t
The reservoir permeability (K) factor is the key parameter for reservoir characterization. This parameter is considered as a determinant reservoir quality index. Depending on the data required and procedure avail- ability, permeability can be defined from several methods such as; well test interpretation, wireline for - mation tester, and core data. These approaches can also be in assumption with permeability prediction targeting the non-cored sections. According to a similar status, well logs records can be an interesting support tool in use to reach the planned objectives. Thus, this investigation consists of finding out a model able to estimate the well log permeability and adjusting the outcome to the core permeability results.
In this led research, the applied approach to the core data, to start with, was aimed to determine the reservoir rock types (RRT) using the flow zone indicator (FZI) method. The obtained classification allows stating a permeability model for each rock type.
In order to calculate permeability from well logs, FZI has been founded out. A multi -regression tech- nique was used to analyze the relationship of FZI with respect to specific logs such as Gamma -ray (GR), Density Log (RHOB), and Sonic log (DT). An objective function has been designated to minimize the quadratic error between the observed normalized FZI coming from core data, and the normalized FZI calculated from well logs. This process is carried out to identify a mathematical correlation allowing the estimation of FZI from porosity logs, leading to permeability determination. As results, permeability from logs was supporting relatively permeability defined from cores. The final results can be an accurate and real test for associating the exactitude performance of logging data records in boreholes with respect to the overall reservoir characterization sections. Thus, the applied investigation can be a genuine and quick method for essentially a specific deduction regarding the non -cored reservoir sections, with refer- ence to rock typing, permeability and probably further reservoir factors.
1. Introduction
The development of an oil field is an entire range of research activities starting from exploration up to field development
⇑ Corresponding author.
E-mail address: [email protected] (H.E. Belhouchet). .
(Galard et al., 2005). It consists of characterizing a sedimentary basin in detail. The exploration steps may involve seismic data, log- ging, and analysis up to geobodies identification. In order to get a stable, consistent and coherent model, specific studies have been developed (Al-Hajeri et al., 2009). Dynamic modeling with reser- voir fluid characterization, SCAL studies, and identification of ini- tial conditions are also part of these orientations (Holtz, 2002). The reservoir characterization parameters in that purpose can be figured out by factors such as seismic attributes, rock typing and geostatic. These parameters concern can be through probabilistic function responsible for uncertainties.
2
Different researches on that purpose have been led. However, investigations can be exposed to some risks. Doubts can be issued from a reduction of exploration uncertainties and inefficiency related to the predicted potential and real reserves presence of hydrocarbons (Selley and Sonnenberg, 2015). In addition, any exploration achievement can be related to significant geologic ele- ments processes and rock typing (Al-Hajeri et al., 2009). Modeling system and fluid dynamics behavior can be key factors suitable for the reservoir potential evaluation and recovery challenge (Galard et al., 2005).
The Rock typing is a process of rock classification based on min- eralogical composition, grain size, shape and pore size distribution (PSD). Rock typing – fluid interaction, with fluid dynamic behavior, and capillary effect are of importance in this organization. In such circumstances, the envisaged process can involve: integrating, ana- lyzing and synthesizing the real data supplied from different bore- hole records and cores analysis.
Other detailed parameters used, to define rock typing as part of the reservoir comprehension, characterization for fluid circulation aptitude is the hydraulic flow units (HFU). Rock typing classifica- tion can be allocated to the same dynamic properties, the same porosity, and permeability correlations results, identical capillary pressure profile and the same relative permeability curves. Similar characteristics are well supported by Shenawi et al. (2009). The cited authors found that Hydraulic Unit (HU) determination and use is providing a useful and interesting advice and device for rock typing definition in relation to the porous media assessment.
Once the rock typing identification procedure is done, reliable estimated permeability can be extended to the non-cored wells. This assumption allows the generation of water saturation models and minimizing convergence problems. Therefore, the reservoir performance is then related to generating simulation sensitivities, involving possible rock classes endorsed by considered scaled field. Accordingly, figuring out reservoir properties, it can be carried out along the whole reservoir sections.
Therefore, the requirement of conceptual studies in that regard is in need of sensitive steps materializing the stability and conver- gence of the model as a digital one. For the case study, the reservoir characterization, based on permeability (K) determination will lead to developing an operational modeling device. This application is capable of calculating the permeability as a function of porosity and lithology (Enaworu et al., 2016). The impact of the rock prop- erties on the static and dynamic behavior of the fluid circulation, related to rock typing, is another essential controlling factor to consider (Attia and Shuaibu, 2015).
Control on permeability prediction for rock typing determina- tion is also related to the flow zone indicator (FZI). It is known that the FZI parameter is directly associated to the hydraulic unit for considered rock type as well as its porous media (Enaworu et al., 2016). The method was proposed to decrease the absolute error between defined permeability from cores and the calculated one. In addition, applied method can ensure better development of the considered oilfield by optimizing the perforation intervals. With regards to the overall, an enhancement boreholes recovery can be set. Meanwhile, the method will guide avoiding the interval located in the aquifer section: Since underestimation of the perme- ability in the section near the oil–water contact (OWC) can be con- sidered as the main issue for water breakthrough occurrence.
The preferred zone for perforation is generally carried out in interval above the oil–water contact. This scenario is intended to delay the water breakthrough arrival. On the other hand, owing to a similar scenario, the probability of having a good permeability in the reservoir section above the water–oil contact can be proba- bly underestimated. Calculated permeability is affected by its esti- mation accuracy (Wu and Li, 2013). The calculated permeability care can be subdued to some uncertainties regarding its estimation
exactitude. This kind of statement might be proofed by water-wet rocks and high salinity formations (Elraies and Yunan, 2007).
The general complexity for the reservoir characterization related to permeability prediction especially in the non-cored borehole section, is conducted towards a variety of methods, which can be executed. Investigating on permeability and porosity char- acteristics, with regards to geological properties of the rocks, might carry considerable reserves. Texture and structure factors with mineral composition and their distribution (arrangement, packing, sorting distribution), remain an essential impact regarding uncer- tainties on rock typing and degree of heterogeneities statements (Benzagouta, 2015). Conversely, making use of parameters recorded from the formation evaluation, ambiguity concerns might be improved for sustaining the decrease in rock typing uncertain- ties (Mohammad Emami Niri and David Lumley, 2014, Pirrone et al., 2014).
Similar statement is well known in the Lower Shaly – Triassic Sandstone Formation (TAG-I Formation, Algeria), where, the main characteristics controlling rock typing uncertainties, can be owed to rock solids textural and fractional compositional. In addition, contribution is expected from fluid flow filling pores and its properties.
For similar purposes and to clear out various doubts for the case study investigation, conducted tasks can be set as follow:
Rock typing identification based on integrating, analyzing and synthesizing data from well logs and core analysis.
Rock typing identification related to the volume of shale esti- mated from gamma-ray (GR), hydraulic units, capillary pressure profile, and saturation height function.
Finding out relation between completed classification process using FZI method and permeability models specified for each rock type.
Anticipating the determination of FZI from well logs application using the empirical model and non-linear regression approaches.
Final objective is to calculated permeability from FZI based on rock typing classification in reservoir sections.
2. Field description and well presentation
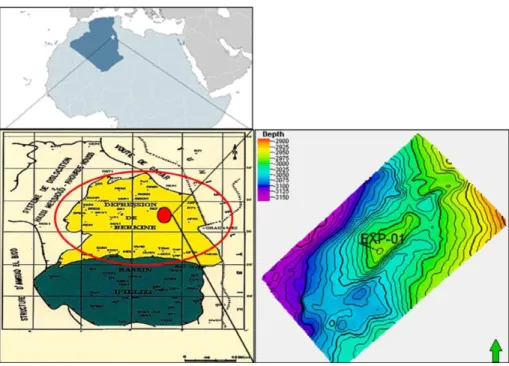
As part of the Saharan Platform, the Berkine Basin is located in South-Eastern Algeria, between latitude 29 degrees and 33 degrees North and longitude 5 degrees and 9 degrees East (Fig. 1). It is lim- ited to the North by the southern border of the Dahar Mole, to the south by the Mole D’Ahara which separates it from the Illizi basin, to the East by the Tunisian – Libyan borders and finally to the West by the structural extension North of the Amguide – El Biode – Hassi Messaoud Mole. The Berkine basin is of intracratonic type with a total area is 102,395 km2 (Souadnia and Mezghache, 2009).
The EXP-01 exploration well has been drilled in the Berkine oil field Basin for assessing the H-C potential of sandstone part within the Triassic Lower Sandstone Clay TAG-I stratigraphic column (Fig. 2). A 15 m core thickness was picked up between 3247 m TVDSS (true vertical depth subsea) and 3262 m TVDSS. A total Core recovery was achieved without any loss (100% recovery). The core height has been found covering the entire reservoir targeted sec- tion. The core section has been described from sedimentological and petrographical points (Fig. 2). Results, based on the strati- graphic log of the core interval and the whole borehole section, indicate a detrital sandstone lithology dominance, which may be split up into different facies deposits according to Turner et al., 2001 (Fig. 2). From sedimentological point of view, the Berkine basin deposits have been found of braided to meandering fluvial environmental deposits (Turner et al., 2001).
● ●
●
●
3
Fig. 1. The localization of the study area and Well position (Souadnia and Mezghache, 2009).
Fig. 2. Stratigraphic column for reservoir coring section (Turner et al., 2001).
Reservoir characteristics have also been found of relatively up to good with porosity varying from 7 to 20% and the permeability from 1 millidarcies to 850 millidarcies (mD). The PVT (Pressure, Volume, and Temperature) analysis has indicated light oil, with a gravity of 40.4 API (Souadnia and Mezghache, 2009).
3. Core samples porosity and permeability measurements 42 conventional core measurements have been selected from the reservoir interval (essentially the Net pay sections) in the first
exploration borehole. Porosity and the permeability are targeted in the assessment purpose. Six special core measurements with mer- cury intrusion-porosimetry have been selected to define capillary pressure (Pc). The experiments have been realized in the labora- tory. Prior to petrophysical characteristics measurements, the core plugs underwent the following laboratory procedures, at ambient conditions.
- Cleaning procedure - Helium derived porosity
¼ —
ð — Þ 4
3.1. Cleaning and drying
The preferred Routine core analysis (RCA) method for cleaning of plugs has been the hot Soxhlet reflux cleaning with methanol and toluene as the most used cleaning liquids, followed by chloro- form/methanol and finally methanol, Extended cleaning for 2– 4 weeks are often necessary depending the core permeability. Dry- ing is normally done at 105–110 °C to remove adsorbed humidity and obtain the most accurate porosity and grain density figures.
3.2. Helium porosity determination
Porosity was determined by helium injection using a Boyle’s law porosimeter. The bulk volume was measured using the immer- sion in the Mercury technique. The method used for porosity calcu- lation is based on consolidated rocks. The method was based on some cylindrical plugs allowing the volume calculation (bulk vol- ume) (irregular shapes are not accurate): length and diameter have to be measured accurately.
We can determine the solid volume or the pore volume by sat- uration subsequent to air evacuation using a vacuum pump. Total Saturation of the sample is accomplished by a fluid of known den- sity. The sample is weighted (Ww). Then Sample is dried (furnace). The difference in weight between saturated and dry samples can give us the pore volume according to fluid density (generally when it consists of water: water density = 1 g/cm3. The porosity is expressed as:
Volume of Pore ðV Þ
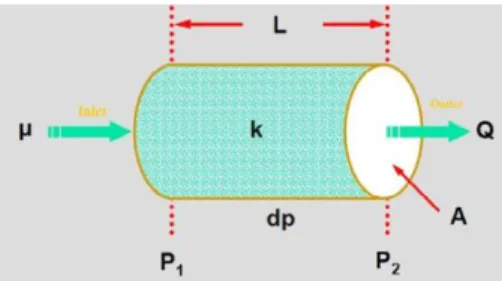
Fig. 3. General permeability measurement scheme According to Darcy Law (Zand et al., 2007).
4. Rock typing; identification and assignment
In reservoir engineering, rock classification can be made on the basis of hydraulic unit identification, planned for fluid circulation ability and determination (Attia and Shuaibu, 2015). These hydrau- lic units (HU) are used for modeling parameters such as permeabil- ity (K) (Mahjour et al., 2016) in order to optimize simulation time. Rock typing is determined on the basis of reservoir petrophysical properties, porosity – permeability cross plot, capillary pressure curves, in addition to water saturation height function profiles. Generally, the determination of these parameters will help to define different rock classes and their contribution potential towards predicted recovery. Conducting similar research consists on making use of data from different sources (well logs and core data) to support identification of the different rock types. As men-
Porosity ð£Þ ¼ p
Total
v
olume of rock ðVbÞ m 100 ð1Þtioned previously, the static behavior (Lithology, rock type and physical properties) can be gathered to dynamic behavior (petro- physical parameters relationship and capillary pressure effect). In that principle, defined rock types must be calibrate in terms of
3.3. Klinkenberg corrected gas permeability
The general measurement of permeability (K) is based on the type of fluid, its viscosity, pressure difference between the inlet and outlet, sample section and its length. The permeability mea- surement has been taken in the company laboratory. It has been measured by using core cylindrical samples according to the pro- cess: A fluid of known viscosity (
l
) is pumped through a rock sam- ple of known cross-sectional (A) area and length (L). The pressure drop across the sample is measured through pressure gauges (Dp Pinlet Poutlet ).The Darcy’s Law as formulated by Muskat and Botset is as fol- lows (Muskat, 1931):
the following defined setting:
Lithofacies: the same type of rock in terms of lithology. Petrofacies: the process is based on the classification of cores data into sets having the same hydraulic unit (FZI method), the same pore size and similar capillary pressure profile. 5. Application for the case study: results and discussion
In the case study, exploitation of cores, coming from the first explored borehole in the Hassi – Berkine oil field (Algeria), has been used for rock typing identification. These cores have been characterized on the basis of porosity and permeability properties.
Q k m ðP1 — P2Þ m
A 2 These factors are considered as the main indicators for the reser-
¼
l
m L ð Þwhere:
Q : Rate of flow (cm3/s)
k: Permeability (Darcy)
P1 P2 : Pressure drop across the sample (atmosphere)
A: Cross-sectional area of the sample (cm2)
l
: Viscosity of fluid (cP)L: Length of the sample (cm)
Nothing that, in the form shown above, we assume that the Eq.
(2) is occurring without any chemical reaction between the fluid and the rock, with only one fluid phase (after cleaning procedure). The permeability measurement procedure can be illustrated by the schematic diagram below (Fig. 3):
Detailed information on the purpose of these procedures of lab- oratory measurements and various steps, for the core use, were fig- ured out from laboratory core analysis and guides (McPhee et al., 2015, William Lyons et al., 2015).
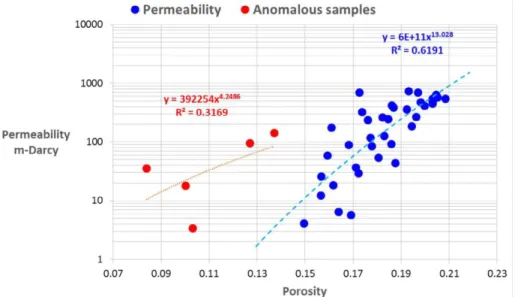
voir classification process. Before going through this process, a plotting permeability versus porosity relation is required and becomes essential. According to permeability porosity distribution, and regarding the porosity evolution, two groups of samples distri- bution were set up main (normal) samples and anomalous sam- ples. In addition, a relation between permeability and porosity was also established (Fig. 4).
5.1. Permeability porosity relationship
Permeability versus porosity relation, recorded from core anal- ysis, presents a non – uniform cloud over which a representative mathematical model is privileged. This predicted model can be set on the basis of a best-provided correlation coefficient. Provi- dentially, the rock type classification procedure begins by remov- ing core results located out of the main set of points. Permeability versus porosity recorded outcomes from core analysis indicates the best fit line, crossing a group with a correlation coef-
● ●
£ #
5
Fig. 4. A cross plot indicating permeability versus porosity where heterogeneity is illustrated through a predetermined interval of distribut ion.
ficient of 0.62 (Fig. 4). This low value of the correlation coefficient provides a considerable margin of error. All calculations, depend- ing directly or indirectly on absolute permeability, will be overestimated.
Therefore the numerical simulation model does not represent the real field performance. In that purpose, the application of the HFU parameter becomes necessary to predict the various reservoir rock types (RRT) and the degree of reservoir heterogeneities. With reference to parameters control, this request will possibly improve the absolute permeability calculation and subsequently extended to the uncored sections, thus, this prediction will be used to decrease the uncertainties surrounding the uncored zones.
5.2. Data availability and quality control (QC)
To carry out a complete study on reservoir rock types classifica- tion in the cored and uncored wells, a data preparation must be carried out, and presented as follows;
Core data in cored wells, and well logs data in all wells should be prepared and quality controlled.
Quality insurance of core data should be necessary; all cores destroyed during the sampling should be removed.
Porosity estimation from well logs should be calibrated to that calculated from cores with consideration of the overburden phenomenon.
● Core data depth correction must be adjusted.
5.3. Rock typing
According to Chehrazi et al. (2011), reservoir rock typing is a process of classifying reservoir rocks into distinct units. From a geological point of view, it is characterized by similar geological conditions deposited in the same sedimentary environment and undergone through similar diagenetic alterations. From the reser- voir engineering point of view, it is characterized by identical fluid flow properties. Based on these definitions, given rock type can be imprinted by a unique permeability - porosity relationship, capil- lary pressure profile and saturation height functions above free water level (HFWL).
In the case study, reservoir rock types identification is the pro-
two principal steps have been considered to define reservoir rock types:
5.3.1. Lithofacies identification
Lithofacies determination is derived from the description of core and cuttings obtained during the drilling phase. The different lithological units are grouped, as mentioned previously, to similar- ities in rock composition, texture, and sedimentary structures. Therefore, each lithofacies should be associated with a specific Rock type.
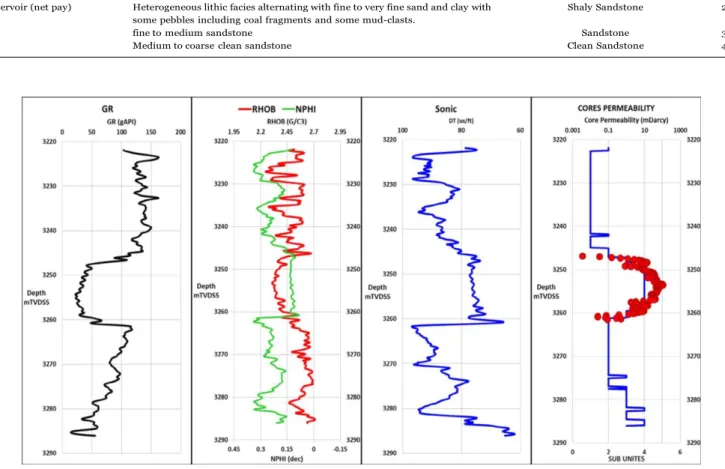
According to the carried out description of the cores and the cutting, the whole material consists on detrital deposits. Therefore, shaliness or clay content parameter constitutes a basic parameter to be used for splitting up between the different facies. The avail- ability of Gamma ray records is a valid tool for this function (Turner et al., 2001, Benzagouta et al., 2001). For that purpose, the gamma-ray log has been used, as the main source for lithofa- cies identification and classification, matching the defined lithofa- cies from core description and cutting (Table 1). Based on this perceptive concept, five lithofacies were defined in Hassi Berkine Oil Field. Two defined types of lithofacies: organic-rich shale and shales are considered as non-reservoir with regards to the others. Plotting core permeability versus porosity for defined reservoir subunits shows that three lithofacies could be considered as prob- able reservoir efficient facies; Shaly sandstone, sandstone and clean sandstone (Fig. 5).
5.3.2. Petrofacies determination
In this case study, Amaefule et al. (1993) method was applied to identify hydraulic units. This latter parameter could be presented by a unique permeability – porosity relationship. Results are indi- cated in Fig. 6. This method deals with the rock quality index (RQI) versus normal porosity (£z). The calculation of these parameters has been achieved graphically based on the unit slope. As a result, six hydraulic units revealing six dynamic curve behaviors were obtained (Fig. 6a).
For each hydraulic unit, permeability factor was obtained from
FZImean and effective porosity using the equation below (Eq. (3))
(Enaworu et al., 2016). Consequently, various rock types are laid down (Fig. 6b).
k 1014 FZI2
"
3
3 cess by which rocks are regrouped in specific sets and are cali-
brated in terms of lithofacies and petrofacies. In the case study, ¼ m mean ð1 — £eÞ ð Þ
2
● ● ●
6 Table 1
Table showing the main lithofacies characteristics in the considered reservoir according to Asquith and Gibson (1983), Turner et al. (2001) and Benzagouta et al. (2001).
Commun lithological description Lithofacies Codes
Non Reservoir Dark clay rich in organic matter content Organic-rich Shales 1
Greenish clay deposits Shales
Reservoir (net pay) Heterogeneous lithic facies alternating with fine to very fine sand and clay with some pebbles including coal fragments and some mud-clasts.
Shaly Sandstone 2
fine to medium sandstone Sandstone 3
Medium to coarse clean sandstone Clean Sandstone 4
Fig. 5. Well log interpretation based on GR classification indicating the location of core data in reservoir zones.
Fig. 6. Permeability vs. porosity with the obtained different curves and correlation coefficient: Different clusters have come out with various hydraulic units leading to different rock typing (Amaefule et al., 1993).
7 Then, the units were modeled by a linear, logarithmic, exponen-
tial and power-law in order to determine the best representative equation corresponding to each hydraulic unit (Table 2, Fig. 6c). The choice of a mathematical model, representing the same set of points, is coupled to the correlation coefficient. This correlative coefficient is used to measure the strength of the relationship between the two essential petrophysical parameters: porosity and permeability. Fig. 6d indicates, that the best correlation between the cited type of modeled and actual cores measurements permeability, with a high degree of accuracy, is set through the correlation coefficient value of 0.97.
In addition to the identification of the hydraulic units, six col- lected samples, from the reservoir area (net pay section or proba- ble efficient section), were used to calculate the capillary pressure (Pc) by the Mercury Injection Capillary Pressure experi- ment (MICP). The principle is to evaluate the capillary behavior of these samples as a function of defined hydraulic units. Fig. 7a is a graphical analysis of capillary pressure versus saturation: each capillary pressure value corresponds to a respective hydraulic unit. It is found that rock types RT-5 and RT-6 have the same initial
water saturation (Fig. 7b). This can be a support to set together rock types RT-5 and RT-6 in the same rock type, sustaining a con- sistent classification, in terms of hydraulic units and capillary pres- sure profiles. Consequently, the petrophysical rock types will be summarized in five rock types RT-1, RT-2, RT-3, RT-4 and RT-5bis (RT-5 and RT-6).
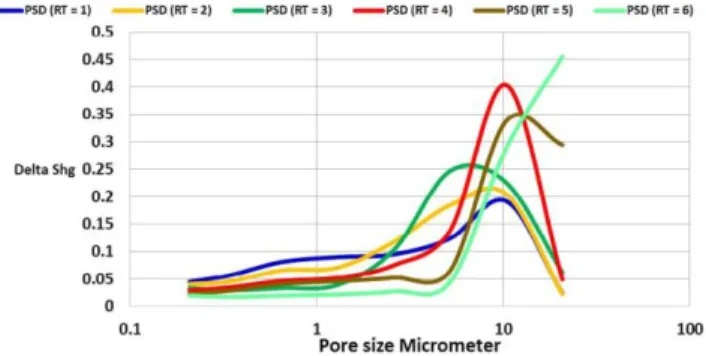
According to the outcomes, from the Fig. 6a and 6b, the pres- ence of more than one hydraulic unit and dissimilarities in the cap- illary pressure profiles can be ascribed to the heterogeneity of depositional environment change or lithological distribution varia- tion. For supporting this hypothesis, pore size distribution has been calculated from capillary pressure and presented in Fig. 8.
Graphical analysis shows that pore throat is of mostly macrop- orous type, with a pore throat radius fluctuating between 2.5 and 10 mm meter, with minor variations of mesoporous (0.5–2.5 mm meter) and microporous category (0.2–0.5 mm meter).
Accordingly, the reservoir rock quality type can be determined according to factors such as porosity, permeability, hydraulic uni- tes, capillary pressure and pore throat radius. The determination of the values of this last parameter can be an effective device to
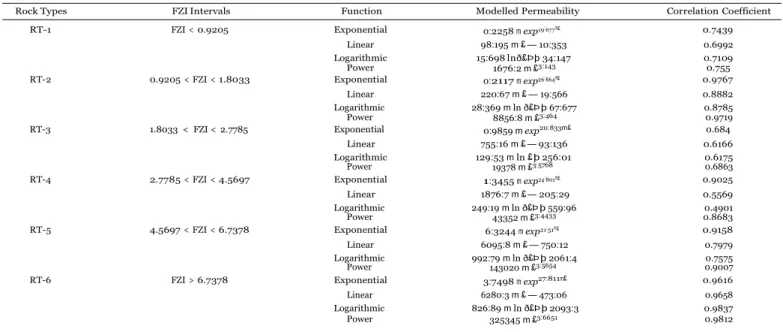
Table 2
Table summarizing the classification of rocks based on FZI method.
Rock Types FZI Intervals Function Modelled Permeability Correlation Coefficient
RT-1 FZI < 0.9205 Exponential 0:2258 m exp19:677m£ 0.7439
Linear 98:195 m £ — 10:353 0.6992
Logarithmic 15:698 lnð£Þþ 34:147 0.7109
Power 1676:2 m £3:143 0.755
RT-2 0.9205 < FZI < 1.8033 Exponential 0:2117 m exp26:864m£ 0.9767
Linear 220:67 m £ — 19:566 0.8882
Logarithmic 28:369 m ln ð£Þ þ 67:677 0.8785
Power 8856:8 m £3:464 0.9719
RT-3 1.8033 < FZI < 2.7785 Exponential 0:9859 m exp20:833m£ 0.684
Linear 755:16 m £ — 93:136 0.6166
Logarithmic 129:53 m ln £ þ 256:01 0.6175
Power 19378 m £3:5768 0.6863
RT-4 2.7785 < FZI < 4.5697 Exponential 1:3455 m exp24:801m£ 0.9025
Linear 1876:7 m £ — 205:29 0.5569
Logarithmic 249:19 m ln ð£Þ þ 559:96 0.4901
Power 43352 m £3:4433 0.8683
RT-5 4.5697 < FZI < 6.7378 Exponential 6:3244 m exp21:51m£ 0.9158
Linear 6095:8 m £ — 750:12 0.7979
Logarithmic 992:79 m ln ð£Þ þ 2061:4 0.7575
Power 143020 m £3:5654 0.9007
RT-6 FZI > 6.7378 Exponential 3:7498 m exp27:811m£ 0.9616
Linear 6280:3 m £ — 473:06 0.9658
Logarithmic 826:89 m ln ð£Þ þ 2093:3 0.9837
Power 325345 m £3:6651 0.9812
X
obs calc
8
Fig. 8. Pore size distribution deduced from capillary pressure (MICP method). assess the heterogeneity degree. Based on pore size distribution profiles, reservoir facies could be considered as relatively homoge- nous along the field sections. The presence of more than one hydraulic unit can be related to variation in lithological facies distribution.
In the case study and as results, Hassi Berkine oil field reservoir rock types (RRT) have been classified into five lithofacies and six petrofacies, the results are shown in Table 3.
According to Tanmay Chandra (2008), FZI can be calculated from the combined use of well log data such as Gamma-ray (GR), NPHI, RHOB, and Sonic (DT) (Eq. (4)):
FZI ¼ f ðGR; NPHI; RHOB; DTÞ ð4Þ
In this study, our approach is focusing on the determination of the normalized FZI from combined use of well log data such as Gamma-ray (GR), NPHI, RHOB, and Sonic (DT). Based on this under- standing, empirical modeling (EM) was applied to create models based on the experimental data to predict the normalized FZI model calculated from well logs and accordingly used in perme- ability calculation through the application of the reservoir rock typing process. In order to achieve this objective, several models were produced on the basis of the combination of mathematical functions such as; linear, exponential, logarithmic, power and rational functions using conventional well logs such as; Gamma- ray, NPHI, RHOB, and DT. The best mathematical model must be related to the optimal subject function and characterized by its specific logs. The objective function or the optimized goal of the proposed model consists essentially to minimize the quadratic error. This later will be between the calculated and the observed normalized FZI as mentioned in the Eq. (5):
5.4. Permeability estimation for Non-Cored section
According to the flow zone indicator method applying for rock typing identification, the permeability models for each rock type has been established and defined in the cored section (Enaworu
Objfunc ¼ minimize
where: n i¼1 . FZIm — FZIm Σ2 ! ð5Þ
et al., 2016). In order to calculate the permeability for the non- cored section, the determination of FZI should be necessary. For that reason, nonlinear regression methods have been carried out to calculate FZI in the non-cored section.
For accomplishing the precedent purpose, well logs data should be used for analysis and interpretation. It will provide an approach allowing non-cored section classification into reservoir rock types.
Objfunc: The objective function
FZIm
obs : Observed normalized FZI factor
FZIm
calc : Calculated normalized FZI factor
n: The number of cores presented in this study (n ¼ 42)
and normalized observed FZI (FZIm
obs ) has been calculated by
applying Shier (2004) formula as: Thus, for such setting FZI and Permeability models could be
applied.
In the case study, the volume of shale (Vsh) determination has
FZIm
obs FZI — FZI min
FZImax — FZImin ð6Þ
subdivided the reservoir zone into four sub-zones. The sub-zones have been defined as Sand, Shaly-Sand, Sandy-Shale, and Shale (Table 4). Cores are located in the sandstone (unite 4) and shaly- sand (unite 3) zones (Fig. 5, Table 4).
Table 3
Reservoir rock types (RRT) Classification.
where FZI, FZImin and FZImax are considered from core data.
We note that FZIm is constrained by the rock lithofacies (Shaly- Sandstone and Sandstone & clean Sandstone subzones), this means that each lithofacies has a specific mathematical model.
In this investigation, in order to solve the nonlinear optimiza- tion problem and compute the optimum model parameters accord- ing to the chosen subject function, the Generalized Reduced Gradient (GRG) method was performed (Maia et al., 2017). The
Reservoir/Non Lithofacies Petrofacies
mathematical models of normalized FZI (FZIm
calc ) for shaly-
sandstone and sandstone & clean sandstone subzones were devel- oped. They were performed on the basis of several scenarios car- ried out on the observed normalized FZI coming from cores and normalized FZI estimated from normalized well logs, RHOB* and DT*. NPHI* has been used as a parameter, but it has not led to good results. Thus, the mathematical models deduced for the two sub- zones are correspondingly:
- Shaly-Sandstone; Table 4
Clay evolution (Vsh ) in the reservoir based on GR readings.
GR Max 162.7971 GR readings Reservoir Subunites
GR Min 14.0944 GR < 1/2 GR Mid Sandstone & Clean Sandstone 4
GR Mid 88.44575 1/2 GR Mid < GR < GR Mid Shaly Sandstone 3
1/2 GR Mid 44.222875 GR Mid < GR < 3/2 GR Mid Shale 2
3/2 GR Mid 132.668625 GR > 3/2 GR Mid Organic Rich Shale 1
¼
Reservoir
Non Reservoir Organic rich
shales RT0 Non Reservoir Reservoir Shales Shaly-Sandstone RT-1 FZI < 0.9205 Sandstone Clean Sandstone RT-2 RT-3 RT-4 RT- 5bis 0.9205 < FZI < 1.8033 1.8033 < FZI < 2.7785 2.7785 < FZI < 4.5697 FZI > 4.5697
¼ ð Þ 9 FZIm calc ¼ 0:312739 m ln ðRHOBm þ 1:163084Þ þ 1:105386 m ln ðDTm þ 0:789186Þ ð7Þ
- Sandstone & clean Sandstone;
FZIm 1:342524 8
calc —1:00692 þ 1:408993 m e4:16757mRHOBm
where RHOBm and DTm
are normalized parameters and are calculated by Shier (2004):
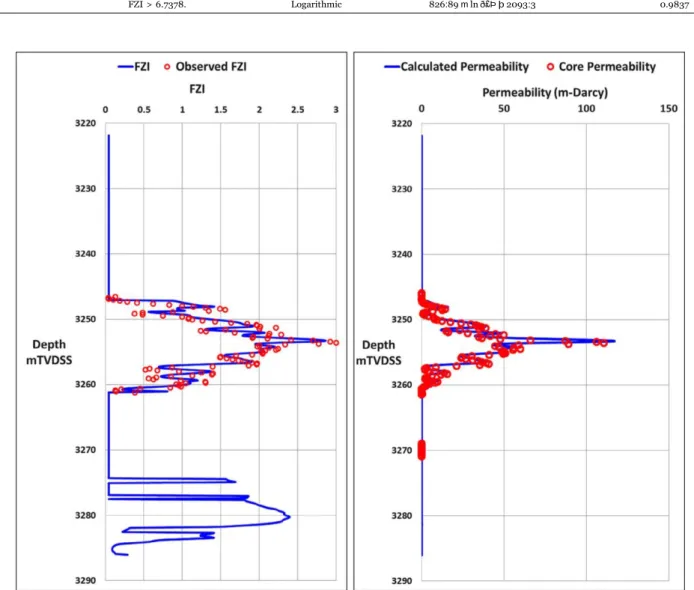
FZIlog ¼ FZImcalc m ðFZImax — FZIminÞ þ FZImin ð10Þ For the permeability calculation, reservoir rock types were clas- sified on the basis of the FZI values, in which a permeability model was defined for each rock type (Table 5). The results presented in
Fig. 9 indicate a relative fine correlation between calculated and observed parameters (FZI and Permeability), and therefore, these inferred models can be used to calculate the permeability in the non-cored wells.
6. Conclusion
Normalized ReadingValue — MinValue
9 ● Rock typing can be defined as integration and analysis of data
log ¼ Max
v
alue — MinValue ð Þ from boreholes and core analysis.Based on the Eq. (6), the FZI log is calculated from the normal- ized FZI and stated as follows:
Rock typing determination can be due to various factors leading to various modifications.
Table 5
Table summarizing the permeability models for each rock type.
Rock Types FZI Intervals Function Modelled Permeability Correlation Coefficient
RT-1 FZI < 0.9205 Power 1676:2 m £3:143 0.755
RT-2 0.9205 < FZI < 1.8033 Exponential 0:2117 m exp26:864m£ 0.9767
RT-3 1.8033 < FZI < 2.7785 Power 19378 m £3:5768 0.6863
RT-4 2.7785 < FZI < 4.5697 Exponential 1:3455 m exp24:801m£ 0.9025
RT-5bis 4.5697 < FZI < 6.7378 Exponential 6:3244 m exp21:51m£ 0.9158
FZI > 6.7378. Logarithmic 826:89 m ln ð£Þ þ 2093:3 0.9837
Fig. 9. FZI and Permeability profiles calculated from well logs data. ●
10
Lithofacies process is a helpful tool that can be used to link core data to Well log column data.
Identification of hydraulic unit parameters such as HFU and FZI can be a vital compilation between the real cores and petro- physical characteristics.
Capillary pressure and saturation height function are influenc- ing factors regarding reservoir rock typing classification. Pore size distribution (PSD) could be introduced to identify the reservoir degree of homogeneity or heterogeneity.
Uncertainties on data analysis with various obtained mathe- matical curves can be involved and useful to find out and sup- port the correlation between hydraulic units issued from core data and well logs.
The use of the classification process can be main concern for the permeability determination and its anticipation for each rock type.
Similar investigation on reservoir characterization steps can be applied for other non-cored wells especially for boreholes set in the same structure and having broad-spectrum characteristics.
Declaration of Competing Interest
The authors declare that they have no known competing finan- cial interests or personal relationships that could have appeared to influence the work reported in this paper.
References
Al-Hajeri, M., et al., 2009. Basin and Petroleum System Modeling. Oilfield Review Summer 2009: 21, no. 2, 16.
Amaefule, J.O., et al., 1993. Enhanced Reservoir Description: Using Core and Log Data to Identify Hydraulic (Flow) Units and Predict Permeability in Uncored Intervals/Wells. Society of Petroleum Engineers. doi:10.2118/26436-MS, 205- 220.
Asquith, G., Gibson, C., 1983. Basic Well Logging Analysis for Geologists, AAPG Methods in Exploration Series number 3, Page 120. Tulsa, Oklahoma USA: ‘‘The American Association of Petroleum Geologists AAPG’’. 1982, Library of Congress. Schlumberger, Log Interpretation Principles/Applications, Schlumberger, Wirline & Testing, Houston Texas.
Attia, Attia M., Shuaibu, Habibu, 2015. Identification of barriers and productive zones using reservoir characterization. Int. Adv. Res. J. Sci. Eng. Technol. 2 (12), 8– 23. https://doi.org/10.17148/IARJSET10.17148/IARJSET.2015.21210.17148/ IARJSET.2015.21202.
Benzagouta, M.S. et al., 2001. Reservoir heterogeneities, in fractured fluvial reservoirs of the Buchan oilfield (Central North Sea). Oil Gas Sci. Technol. – Rev. IFP 56 (4), 327–338.
Benzagouta, Mohammed, 2015. Reservoir characterization: Evaluation for the channel deposits sequence – Upper part using scanning electron microscope (SEM) and mercury injection (MICP): Case of tight reservoirs (North Sea). J. King Saud Univ. – Eng. Sci. 27 (1), 57–62.
Chehrazi, A. et al., 2011. Pore-facies as a tool for incorporation of small-scale dynamic information in integrated reservoir studies. J. Geophys. Eng. 8, 202– 224.
Elraies, Khaled Abdalla, Yunan, Mat Hussin, 2007. Investigation of water breakthrough time in non-communicating layered reservoir. J. Chem. Nat. Resour. Eng. 3, 12–18. ISSN 1823-5255, 7.
Enaworu, E. et al., 2016. Permeability prediction in wells using flow zone indicator (FZI). Petrol. Coal 58 (6), 640–645. ISSN 1337-7027, 6.
Galard, Jean-Hector et al., 2005. A case study on Redevelopment of a Giant highly fractured Carbonate Reservoir in Iran based on integrated reservoir characterization and 3D modeling studies. In: SPE Middle East Oil and Gas Show and Conference, MEOS, Proceedings. https://doi.org/10.2118/93760-MS, 14.
Holtz, M.H., 2002. Residual Gas Saturation to Aquifer Influx: A Calculation Method for 3-D ComputerReservoir Model Construction. SPE Proc. – Gas Technol. Sympos. https://doi.org/10.2118/75502-MS, 10.
Mahjour, S.K. et al., 2016. Identification of flow-units using methods of testerman statistical zonation, flow zone index, and cluster analysis in tabnaak gas field. J. Pet. Explor. Prod. Technol. 6, 577–592.
Maia, A., et al., 2017. Numerical optimization strategies for springback compensation in sheet metal forming. Computational Methods and Production Engineering, Research and Development, Woodhead Publishing Reviews: Mechanical Engineering Series, 51–82.
McPhee et al., 2015 eBook, Chapter 5. In: Core Analysis: A Best Practice Guide. first ed. Elsevier, Radarweg 29, PO Box 211, 1000 AE Amsterdam, Netherlands, pp. 181–266.
Mohammad Emami Niri and David Lumley, 2014. Probabilistic Reservoir-Property Modeling Jointly Constrained by 3D-Seismic Data and Hydraulic-Unit Analysis. SPE Asia Pacific Oil and Gas Conference and Exhibition, APOGCE 2014 - Changing the Game: Opportunities, Challenges and Solutions (Vol. 1, pp. 368- 382). Australia: Society of Petroleum Engineers, 15.
Muskat, M.A., 1931. Flow of gas through porous materials. J. Appl. Phys. 1 (1), 27– 47.
Pirrone, M., et al., 2014. Lithofacies Classification of Thin Layered Reservoirs Through the Integration of Core Data and Dielectric Dispersion Log Measurements. Society of Petroleum Engineers. Society of Petroleum Engineers. doi:10.2118/170748-MS, 21.
Selley, Richard C., Sonnenberg, Stephen A., 1800. In: Elements of Petroleum Geology. third ed. 525 B Street, Suite 1800, San Diego, CA 92101-4495, USA, Elsevier, p. 488.
Shenawi, S.H., et al., 2009. Development of Generalized Porosity-Permeability Transforms by Hydraulic Units for Carbonate Oil Reservoirs in Saudi Arabia. SPE/EAGE Reservoir Characterization and Simulation Conference, 19–21 October, Abu Dhabi, UAE, 16.
Shier, D.E., 2004. Well log normalization: methods and guidelines. Soc. Petrophys. Well-Log Anal. Petrophys. 45 (03), 13.
Souadnia, S., Mezghache, H., 2009. Caractérisation géologique et simulation du réservoir d’hydrocarbure TAGI – HBNS, gisement Hassi Berkine Sud - à l’aide de méthodes géostatistiques. Université Badji Mokhtar, Annaba, Algeria.
Tanmay Chandra, 2008. Permeability estimation using flow zone indicator from Well log data. In: 7th International Conference & Exposition on Petroleum Geophysics, p. 7.
Turner, P. et al., 2001. Sequence stratigraphy and sedimentology of the late Triassic TAG-I (Blocks 401/402, Berkine Basin, Algeria). Mar. Pet. Geol. 18 (9), 959–981. William Lyons et al., 2015. In: Standard Handbook of Petroleum and Natural Gas
Engineering. third ed. Gulf Professional Publishing, pp. 957–961.
Wu, Keliu, Li, X., 2013. A new method to predict water breakthrough time in an edge water condensate gas reservoir considering retrograde condensation. Pet. Sci. Technol. 31. https://doi.org/10.1080/10916466.2011.594830, 7.
Zand, A. et al., 2007. A simple laboratory experiment for the measurement of single phase. J. Phys. Nat. Sci. 1 (2), 10.
● ● ● ● ● ● ●