Airline Operating Cost Reduction through Enhanced Engine Health Analytics
by
Henry H. T. Luu
Bachelor of Arts in Neurobiology, Harvard University, 2011
Submitted to the Department of Aeronautics and Astronautics and the Sloan School of
Management in partial fulfillment of the requirements for the degrees of
Master of Science in Aeronautics and Astronautics
and
Master of Business Administration
in conjunction with the Leaders for Global Operations Program at the
Massachusetts Institute of Technology
June 2018
0 Henry H.T. Luu. All rights reserved.
The author hereby grants to MIT permission to reproduce and to distribute publicly paper and electronic copies of this thesis document in whole or in part in any medium now known or hereafter created.
/ /
Signature of Author...
Certified by...
S ig
n
Signature redacted
D art6-A ronautics and AstronauticsSloan School of Management May 11, 2018
ature reaactea.
Peter P. Belobaba, Thesis Supervisor
Signature
redacted
, qpaRearch
ScientistCertified by... A ccepted by ... A ccepted by ... MASSACHUSETTS INSTITUTE OF TECHNOLOGY
JUN 28 2018
Arnold I. Barnett, Thesis Supervisor George Eastman Profesior of Management Science
Signature redacted
Hamsa Balakrishnan Chair, Graduate Program Committee Associate Prof4ssor of Aeronautics and Astronautics
...
Signature redacted..
Maural-lerson Director of MBA Program Sloan School of Management
Airline Operating Cost Reduction through Enhanced Engine Health Analytics
By Henry H. T. LuuSubmitted to the Department of Aeronautics and Astronautics and the Sloan School of Management on May 11, 2018, in partial fulfillment of the requirements for the degrees of
Master of Science in Aeronautics and Astronautics and Master of Business Administration
Abstract
Engine Health Management (EHM) is a comprehensive maintenance service offered by engine manufacturer Pratt & Whitney (PW) to its airline customers. In its current form, engine performance is monitored through recorded physical metrics, such as gas temperature, pressure, and altitude, taken as single snapshots at various phases of flight. The advent of the Enhanced Flight Data Acquisition, Storage and Transmission (eFASTTM) system, which allows for near-continuous recording of engine metrics, provides Full-Flight Data Analytics (FFDA) that may proactively alert and recommend maintenance activity to airlines. Adopting eFASTTM may help avoid Adverse Operational Events (AOE) caused by unexpected engine failures and the associated cost burdens. With respect to operating cost, airlines standardly report Cost Per Available Seat Mile (CASM) and Cost Per Block Hour (CBH). EHM services that prevent operational disruptions can help airlines reduce these unit-cost metrics, whose scrutiny by industry analysts affect investment guidance, stock performance, and overall business outlook.
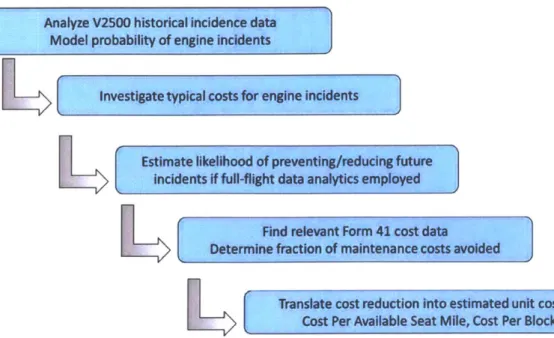
In this study, the value of FFDA services to airlines is investigated on the International Aero Engines V2500, a mature engine with customers' operational histories well-documented. Using a Poisson distribution to model the occurrence of six operational disruption types-Inflight Shutdown, Aircraft-On-Ground, Aborted Takeoff, Air Turn-Back, Ground Turn-Back, and Delay/Cancellation-the cost savings potential is quantified as a function of events avoided by a hypothetical FFDA service. Airline Form 41 financial data from the Bureau of Transportation Statistics is then used to estimate the magnitude of savings on CASM and CBH retroactively for 2012-16. Results show that unit cost reductions of 0.5% to 1.5% are possible through engine event avoidance, representing savings up to $104M annually, but outcomes are highly dependent on assumptions about cost of operational disruptions for each individual carrier. Overall, a baseline model and procedure is developed for valuating FFDA and associated EHM services. Further collaboration between airlines and Pratt & Whitney on data availability and accuracy will help refine this model, which is the first to bridge publicly available airline costs with engine history data, helping stakeholders transition to an eFASTTM ecosystem that promises greater operational efficiency and safety.
Thesis Supervisor: Peter P. Belobaba
Title: Principal Research Scientist, Aeronautics and Astronautics Thesis Supervisor: Arnold I. Barnett
Acknowledgements
What a blessing it was to study under the auspices of Dr. Peter Belobaba and Professor
Arnie Barnett, given their deep knowledge and experience in aviation. They were an unrivaled duo of aviation expertise from Engineering to Sloan to Logan, and back. I thank them for their kind support, guidance, and patience throughout this thesis and the two years.
At Pratt & Whitney, I was received with open arms and open minds. I wholeheartedly thank my supervisors, Jason Siegel and Andrew Geib, for their support and leadership as I navigated the company, as well as Leslie Fockler for her guidance. Thanks also to my friends and colleagues of the Diagnostics, Prognostics, and Health Management team, particularly Mike Mehallow and Ed Rocco, with whom I shared office space, lunch, and stories.
I had the great fortune of working across departments at Pratt, and I thank the support of
all those in Engine Services and Marketing for extending their help when I needed it. These include Jason Rhodes, my benefactor for this project, as well as John Renehan, under whom I look forward to working. My gratitude also to Larry Gray, Paul Burke, Anand Gupta, Arun Srinivasan, and Karine Lavoie-Tremblay for showing me the business side of Pratt.
To my roommate and dear friend, Gijs Gielen: Thank you for showing me what it means to live and breathe Pratt. I am in awe of your intelligence and maturity every day, and I thank you for opening your home and life to me so welcomingly. The Green Manor was a gift, and for that I also thank Dora Aldama for introducing me to the friendly Pratt social circle with whom I have shared many holidays and celebrations.
The wonderful LGO alumni at Pratt made this experience possible, and I express my utmost gratitude to Travis Gracewski and Kevin Thomas for their care and mentorship. My thanks also to Matt Bromberg for leading the way for LGOs all these years at Pratt.
LGO is three letters that has grown greater and greater in meaning with each story, joke,
and conversation I have shared with my friends in the Class of 2018, who lifted me up every day in our time at MIT. Through all trials and tribulations, we have forged a community to which I will feel a sense of belonging for the rest of my life.
Thanks to the LGO staff, in particular Thomas Roemer, Patty Eames, Jolene Monson, and Ted Equi, for their confidence in me and their tireless efforts to uphold and promote the program.
My friends throughout the Institute have all contributed to a rewarding and enriching life
experience: Alex Bachwich, with whom I shared great academic, social, and professional rapport; Mike Wittman for his Form 41 expertise; and the diverse multitude of classmates and friends from the Sloan MBA Class of 2018.
From my hometown in Alhambra, CA, my dear friend Gloria Chi has lived with me through every moment of the work to school to work transitions in the last three years. I thank her for the lifelong friendship and support that transcends any distance.
To my friends and colleagues at JetBlue Airways and at Alaska Airlines, thank you for your mentorship and friendship during my time working with you. Those experiences affirmed and solidified my passion for the airline industry, and motivated my desire to expand it further with graduate school.
To lifelong friends from Alhambra and from college, thank you for your endless support from coast to coast. I am happy to have so many places to call home.
And to my parents and my entire extended family of 14, particularly my grandmother, our formidable matriarch who passed peacefully during the time of this project: thank you for showing me perseverance every single day of this life. From the killing fields of Cambodia to the tireless labor in auto body shops, on sewing machines, in nail salons, kitchens, and post offices, you have made my life far more comfortable than I could have ever hoped.
Contents
List of Tables ... 9
List of Figures... 11
Chapter 1: Introduction...
13
1.1 Com m ercial Engines and Afterm arket Services ... 13
1.2 Airline Cost Econom ics ... 13
1.3 Research Prem ise and Objectives ... 14
Chapter 2: Background and Current Literature... 15
2.1 Pratt & W hitney and the Jet Engine... 15
2.1.1 History of Pratt & W hitney... 15
2.1.2 The Gas Turbine Engine ... 15
2.1.3 The V2500 Turbofan Engine ... 16
2.2 Engine Perform ance, Health, M onitoring, and M anagem ent... 17
2.2.1 Definition of Engine Health... 17
2.2.2 Engine Health Monitoring and Engine Health Management ... 18
2.2.3 Fleet M anagement Program s ... 19
2.2.4 D iagnostics and Prognostics ... 20
2.3 Snapshot Versus Full-Flight Data... 21
2.3.1 Snapshot Data: ACM F, ACARS, A DEM ... 21
2.3.2 Full-Flight Data...22
2.3.3 The eFA ST M System ... 24
2.3.4 V2500 Engine Faults and Adverse Operational Events ... 25
2.3.5 The eFASTPM Engine Health Management Business Proposition...27
Chapter 3: M ethodology and Procedures... 41
3.1.1 Data Recording ... 41
3.1.2 Sam ple Size Determ ination... 42
3.1.3 Data Collection ... 43
3.2 Characterization of Data Set ... 44
3.2.1 The Poisson Distribution... 44
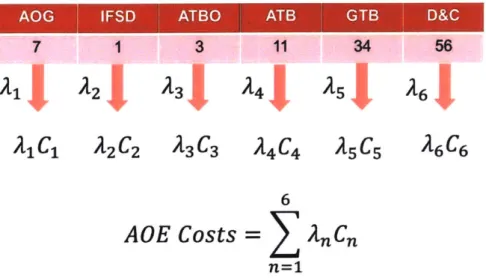
3.2.2 Formulating a Baseline Cost for Adverse Operational Events ... 47
3.2.3 Full-Flight Data Analytics for Cost Reduction ... 48
3.3 Airline Unit Costs ... 50
3.3.2 Airline M etric Calculations... 51
Chapter 4: Results and Analysis ... 53
4.1 V2500 Adverse Operational Events and Associated Costs... 53
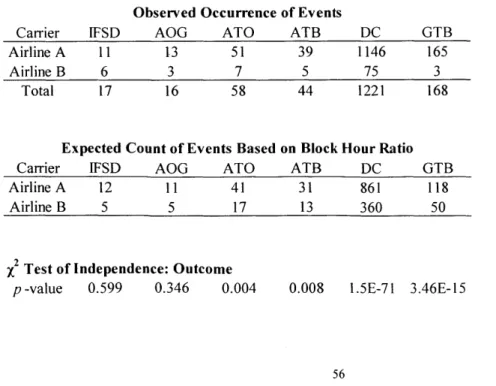
4.1.1 Statistical Independence of Events ... 54
4.1.2 Poisson Characterization... 57
4.1.3 Costs Associated with Events ... 60
4.1.4 Calculated Costs of Adverse Operational Events ... 63
4.1.5 Event Cost Estimates for Prescribed Severity Levels ... 67
4.1.6 Reducing Event Occurrence in a Poisson Process ... 68
4.1.7 Prospective Reductions in Engine Events... 70
4.2 Airline Unit Costs ... 74
4.2.1 Historical CASM ... 74
4.2.2 Unit Costs: CASM and Cost Per Block Hour ... 76
4.2.3 M aintenance Component of Total Costs... 76
4.2.4 Engine Event Cost Reductions and CASM ... 82
Chapter 5: Discussion and Conclusions... 87
5.1 Review of Framework and Assumptions ... 88
5.1.1 Grouping of Adverse Operational Events ... 88
5.1.2 Poisson Distribution and Characterization... 90
5.1.3 Poisson Parameter Pooling... 91
5.1.4 Event Reduction Estimation... 92
5.2 Translation of Engine M aintenance to Airline Costs ... 94
5.2.1 Form 41 Data Reliability... 94
5.2.2 Nuances of Form 41 Data Fields... 95
5.2.3 Unit Cost Reduction Estimation ... 96
5.2.4 Cost-Benefit Analysis of an Engine Prognostics Product... 99
5.3 Full-Flight Data in Its Current State ... 102
5.4 Next Generation Products at Pratt & W hitney and the Airline Industry... 104
5.5 Implications on Security and Privacy ... 105
5.6 Conclusions and Applications...106
List of Tables
Table 1. Data Represented in Engine Incident Reports ... 44
Table 2. Information Obtained from Form 41 Schedules ... 51
Table 3. Adverse Operational Event Groups Used for x2 Test of Independence...56
Table 4. Results from X2 Test of Independence by Airline...56
Table 5. Poisson Characterization of Engine Event Types...58
Table 6. Unit ) by Flight Hours and Flight Cycles. ... 59
Table 7. Engine Event Severity Categories ... 62
Table 8. Cost Index for Adverse Operational Events.. ... 64
Table 9. Cost Index for Integer Adverse Operational Events... 65
Table 10. Expected costs of Adverse Operational Events. ... 67
Table 11. Cost Savings Estimates With Varying Percent of Event Reduction...72
Table 12. Cost Reduction Sums by Year and Percent of Event Reduction.. ... 73
Table 13. Total Operating Expenses from Form 41 Schedule P-1.2 ... 75
Table 14. Total Mainline CASM for Carriers A and B, from 2012 to 2016.. ... 75
Table 15. Unit Cost Defined as Cost Per Block Hour.. ... 76
Table 16. Cost Accounts specific to Engine Maintenance ... 77
Table 17. Percentage of Total Aircraft Maintenance Attributable to Engines.. ... 78
Table 18. Maintenance Cost Categories from Form 41 Schedule P-5.2...78
Table 19. Fleet Size Ratio and Maintenance Cost Ratio.. ... 79
Table 20. Total Operating Costs and Maintenance Costs...81
Table 21. Aircraft Operating Costs and Engine Maintenance Costs ... 81
Table 22. Aircraft Operating Costs, Excluding Fuel ... 82
Table 23. CASM Reduction by Percent of Events Avoided...83
Table 24. Reduction of Block Hour Costs...84
Table 25. Estimates of Unit Cost Savings for Airline A...85
Table 26. Estimates of Unit Cost Savings for Airline B...85
Table 27. Estimated Cost Savings from 20% and 50% Event Reduction. ... 100
List of Figures
Figure 1. Typical Modules of Aero Engine ... 16
Figure 2. Cross Section of the IAE V2500 Engine... 17
Figure 3. Comparison of Snapshot Data and Full-Flight Data. ... 23
Figure 4. The eFA STTM Hardware... 25
Figure 5. Engine Data Transmission Paradigm ... 29
Figure 6. Domestic Mainline CASM from 2007 to 2016... 34
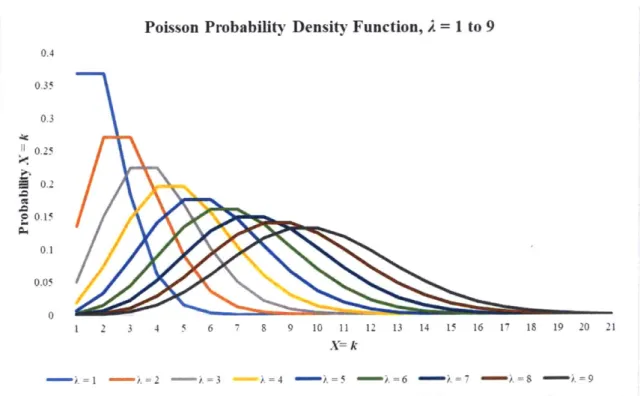
Figure 7. Probability Mass Functions Graphed for Various Values of 2... 46
Figure 8. Poisson Probability Distribution for Adverse Operational Events... 69
Figure 9. Mainline CASM Year-over-Year Change in Percent, 2010 to 2016... 97
Chapter 1
Introduction
1.1
Commercial Engines and Aftermarket Services
Engine Health Management (EHM) is a comprehensive aftermarket service offered by jet engine manufacturers to airlines to monitor, troubleshoot, and maintain the fidelity of the
engine's long-term functionality. American manufacturer Pratt & Whitney (PW) has long offered EHM through individual data snapshots on engine temperatures, pressure, altitude, oil debris, and other physical properties transmitted through ACARS (Aircraft Communications Addressing and Reporting System). Advancements in data storage and transmission technology have enabled PW to introduce Full-Flight Data Analytics (FFDA), a more comprehensive EHM service
utilizing near-continuous data point capture of even more engine performance properties. FFDA is expected to enable faster, more accurate predictive capabilities with respect to the metrics of interest. Specifically, the prospect of full-flight "fault detection"-instantaneously observing and reacting to an impending engine failure-holds promise for better safety and reduced
maintenance burden for airlines.
1.2
Airline Cost Economics
For airlines, enhanced EHM services offer the opportunity to improve maintenance scheduling and reduce direct operating costs. Predictive services can help avoid major engine overhauls or reduce the work scope of engine events by alerting airlines to likely faults and failures, and recommending repairs or replacements in a proactive manner. In turn, airlines can
expect reduced unplanned engine removals (UERs), aircraft-on-ground (AOG) events, and other service disruptions that have direct maintenance costs as well as further expenses due to extra crew pay, passenger re-accommodations, airport penalties, and other burdens resulting from
operational disruption. These cost components all factor into airlines' unit cost metrics, most commonly the Cost Per Available Seat Mile (CASM) and Cost Per Block Hour (CBH). The airlines' profitability, perceived shareholder value, stock market performance, and investment outlook are all directly tied to CASM and other related cost metrics. Therefore, implementation of enhanced EHM services to control engine operating costs holds promise for reduced CASM for the airline industry.
1.3
Research Premise and Objectives
The present study aims to define the value of EHM services for the US domestic airline industry through the lens of unit cost reduction. First, background on the history of engine health monitoring and management services is reviewed. Next, a data sample of airline operating costs, publicly available through the Department of Transportation's Bureau of Transportation
Statistics, will be evaluated for components related to engine maintenance. Using PW's historic data on the International Aero Engines (IAE) V2500 engine, Poisson probability models of various engine faults are calculated and presented to understand the current incidence of engine events. A model for unit cost reduction is formulated through sensitivity analysis of incremental prevention of engine fault incidence. Finally, the calculated cost benefits are analyzed and discussed as an approximation for EHM value to the industry at-large, with PW's nascent eFASTTM service as a product model. Commentary on further FFDA growth, big data development and usage, and cybersecurity implications conclude the thesis.
Chapter 2
Background and Current Literature
2.1
Pratt & Whitney and the Jet Engine
2.1.1 History of Pratt & Whitney
Pratt & Whitney, a subsidiary of United Technologies Corporation (UTC), has produced commercial and military aircraft engines since the early twentieth century. The original Pratt & Whitney Company of Hartford, CT was a manufacturer of measuring instruments. In 1925, it provided funding, factory space, and its namesake to Frederick Rentschler's aircraft engine business, which became the Pratt & Whitney Aircraft Company [1]. Throughout the twentieth century, Pratt & Whitney played a pivotal role in the emerging aerospace industry as part of the United Aircraft and Transport Corporation, which was eventually split by the U.S. government for anti-trust purposes and renamed United Technologies Corporation. As part of UTC, Pratt & Whitney (PW) pioneered both commercial and military aero-engines that powered propeller and jet aircraft, including prominent commercial models such as the Bombardier Q400, the Airbus
A320 family, the Boeing 747, and the Airbus A380. Today, PW engines make up about 25% of
in-service commercial aircraft across the globe [2].
2.1.2 The Gas Turbine Engine
Since 1951, PW has focused on producing jet engines after moving its major propeller products to Pratt & Whitney Canada. In the years since, PW turbofan engines have been at the
forefront of major breakthroughs in the commercial airline industry. Gas turbines have powered
the majority of commercial aircraft since the so-called "jet age" of the 1960s. The prototypical
gas turbine engine, shown in Figure 1, generates propulsion for an aircraft through two airflows.
First, air taken in through the fan and then forced through combustion with fuel and exhausted
through its back nozzle. The core of the engine is separated into a "cold section" and "hot
section," corresponding to the internal temperature of the components and the gas that passes
through. Second, a larger volume of air bypasses the engine's core, along its inner nacelle
(engine casing) and then exits through back nozzle.
INTAKE COMPRESSION COMBUSTION EXHAUST
AJr Inlet Combustion Chambers7 Turbine
Cold Section Hot Section
Energy Turbine Power
(HP~hr)1ooMAW HP
Fuel Bum zZle Power
200,000 HP /~~noe HP
Lift Fan ower
25.000 A
Waste Heat 120,000 HP Com resor Work
100.000P
Figure 1. Typical modules of an aero engine, along with spatial energy profile. Source: Wikimedia Commons (Open Source)
2.1.3 The V2500 Turbofan Engine
International Aero Engines (IAE), a manufacturing joint venture of which Pratt &
Whitney is now the majority stakeholder, introduced the V2500 engine to revenue air service in
1989 [3], powering Airbus Industrie's A320 family of single-aisle aircraft. It has since grown to
be one of the most successful gas turbine engines in aviation history, reaching over 5000
deliveries in 2012, and continues to be produced for the three variants of this popular Airbus
family of aircraft. Across the global airline industry, the A320 family numbers over 7000 of
in-service aircraft, representing about half of the single-aisle, mid-range market [4]. Of these, about
3250 are powered by IAE V2500 engines [5]. The V2500 competes directly with CFM
International's CFM-56 engine, the other power plant option for airlines operating the A320
family. Figure 2 below provides a cross-section of the JAE V2500 engine.
@2014 INTERNATiONAl. AERo ENGINEs A.G.
Figure 2. Cross section of the IAE V2500 engine. Source: Pratt & Whitney public website
2.2
Engine Performance, Health, Monitoring, and Management
2.2.1 Definition of Engine Health
Gas turbine engines consist of hot and cold rotating parts operating in high-altitude
environments that physically deteriorate over repeated use. The life of an engine is dictated by its
ability to power airframes consistently and safely across varying atmospheric conditions.
Because understanding of the physics of jet engine propulsion is mature and has been refined
throughout their engineering history, the components determining engine performance and
engine life are well-understood. As such, the state of any commercially produced engine can be
systematically monitored via sensors that report on the physical properties of propulsion and
flight. Data collected from sensors can be compared against known physical limits defined from
the product's initial design and engineering. Thus, standard operating limits for the various
sections, parts, and components determine whether or not an engine can safely operate a flight
mission. This systematic understanding of engine properties has fueled the practice of engine
health monitoring, and more broadly, engine health management.
2.2.2 Engine Health Monitoring and Engine Health Management
Engine Health Monitoring is the practice of ensuring that engines operate within bounds.
The known physical limits of each module and component are built in during the engineering
and design phase, ensuring that upper and lower bounds for operation are clearly defined. As
mentioned, properties such as temperature, air pressure, and altitude are metrics that can be
monitored by sensors to understand the engine's physical state during flight. These metrics
measure engine performance at the time of data capture, but the collection of data for a single
engine can be analyzed over its history to show patterns and trends. Over time, the metrics of
interest for engine health are bound by their control limits, such that a standard profile of
behavior is known. This standard profile provides the baseline against which all engines can be
compared to identify either (1) synchronicity with a known pattern, indicating normal "wear and
tear" over time, or (2) deviation from the known baseline, indicating the potential for unexpected
faults or failures. The analysis of physical metrics against known baselines forms the foundation
of Engine Health Monitoring [6]. This practice is akin to monitoring the vital signs for human health, ensuring measurable properties such as body temperature, blood pressure, and pulse are within the known limits of standard health. Extending the analogy, Engine Health Monitoring would be akin to maintaining a patient's health record over time, watching for patterns in the vital signs and ensuring that trends and drifts are within normal bounds.
Engine Health Monitoring forms the basis of Engine Health Management (EHM), a broader classification that encompasses the suite of aftermarket services offered by the original equipment manufacturer (OEM). Amongst OEMs, the "aftermarket" refers to the various products and services offered to their customers to maintain equipment performance, such as spares, repairs, replacements, and maintenance labor [7]. In the aviation industry, airplane engine OEMs incorporate aftermarket services in initial contract negotiations for engine orders. At PW, EHM is offered as a comprehensive aftermarket service that includes not only Engine Health Monitoring, but also the associated products and labor needed for maintaining engine
performance, such as spare parts supply, repair shops, data analysis, and recordkeeping via database storage of historic engine metrics.
2.2.3 Fleet Management Programs
EHM can involve even more comprehensive services, such as Fleet Management Programs (FMP), whereby the airline and the engine OEM enter into a business relationship colloquially called "power-by-the-hour" [8]. Coined by a manufacturer later purchased by Rolls Royce, the term refers to an arrangement in which the OEM charges the airline a set cost per flight hour delivered by an engine, and assumes maintenance and repair responsibilities based on contract agreement. Such a relationship allows the airline to know its engine-related operating
costs with greater certainty, and shifts much of the burden of spare part storage, maintenance staff, and other direct maintenance responsibilities to its OEM supplier. Small or new carriers often engage in power-by-the-hour agreements given the capital-intensive requirements for establishing maintenance facilities. FMP relationships fall at the more extreme end of engine cost management for an airline. Along the spectrum of EHM services, airlines have the freedom to
selectively engage with the engine OEM. A carrier may, for example, limit its relationship to basic monitoring and alerting services, and perform maintenance in-house or contract that work
out to a third party provider. Ultimately, the EHM relationship can vary widely from carrier to carrier, and is customized according to the contractual relationship with the OEM. The
methodology covered in this study makes no assumption about the exact business terms on which a given EHM agreement is defined, as the cost of such agreements is generally
individualized and confidential.
2.2.4 Diagnostics and Prognostics
EHM is, at its heart, a service of diagnostics and prognostics. The former, diagnostics, as its name suggests, is a study of empirical observations to diagnose a problem after it has
occurred. Retrospective in nature, diagnostics has generally formed the bulk of EHM services given the need to troubleshoot, investigate, and resolve issues. While engines themselves are very well understood, the exact reason for engine faults or events requires extensive information to ascertain. Dearth and overabundance of information are both issues that complicate the task of finding one or more causes to a given engine incident [9]. Nevertheless, through continuous trial and error, the foundational understanding of engine physics, constraints on possible phenomena, and process of elimination, EHM diagnostic methods have become an advanced practice.
Prognostics, on the other hand, requires an understanding of past incidents, past solutions, and sufficient levels of data and repeated trials that provide enough confidence to the predictor of an event. Given the uncertainty inherently tied to an event that has yet to occur, lack or dearth of data generally stymies progress on prognostic methods in EHM. Regardless, OEMs continue to have a strong incentive to improve and enhance prognostic capabilities for several reasons, only some of which will be defined here. First, the trajectory for sensor-based monitoring is always toward more information, not less, given continued advances in data capture, storage, and processing abilities. Second, with the advent of so-called "next generation" products in the aviation sector, whereby reduction in noise, fuel consumption, and emissions drive engine design, accurate prognostic methods help to reduce events that contribute to these adverse byproducts of gas turbine engines. Finally, in a highly competitive market with only a few players, advances that improve operational efficiency for airline customers provide any engine OEM a strong business advantage.
2.3
Snapshot Versus Full-Flight Data
2.3.1 Snapshot Data: ACMF, ACARS, ADEM
Commercial aircraft today use the Aircraft Communications Addressing and Reporting System (ACARS) to communicate with ground control [10]. The ACARS system is also the platform on which engine data is transmitted. At PW, the ACARS-produced "ACMF Report" is the snapshot data file from which current generation EHM services are rendered. Because of bandwidth limitations, engine data transmitted by ACARS is limited to a single data point captured at the so-called transient steady state for three phases of flight: takeoff, cruise, and
landing [II]. ACMF reports allow identification of data trends over the life of the engine, such as gas exhaust temperature, which creates a profile of likely deterioration over the flight cycles that the engine has completed.
The ACMF method of reporting has allowed PW to develop a service called Advanced Diagnostics and Engine Management (ADEM), which, as its name suggests, is a diagnostics-focused type of EHM service. ADEM is a productionized platform-that is, a standard product offering-available to airline customers that purchase the service for their own maintenance needs. Through ADEM, fleet managers at the operating airlines can access the full set of data captured in ACMF, create reports on a Graphical User Interface (GUI), and identify data patterns and trends. ADEM is a mature product that has been offered by PW for decades, forming the basis of its engine health monitoring apparatus and providing 24/7 field support for existing, in-service engines.
2.3.2 Full-Flight Data
ADEM performs diagnostic services well, given its long maturation period and repeated use by both airline customers as well as by PW's engine monitoring team. Despite its efficiency, ADEM's prognostic abilities are limited by the amount of data fed by ACMF. Specifically, because only snapshot data of the physical metrics is captured at the designated flight phases, users are blind to any data point appearing in-between captures. Figure 3 illustrates this concern. On the left, the current snapshot method shows trending of a generic metric, with each data point representing a single flight. In contrast, any one of the single flights can be monitored throughout its full flight cycle as in the right panel, with single data points now corresponding to individual
moments. Data can go uncaptured if the metric of interest fluctuates within the same flight phase,
such as during the cruise phase illustrated in the figure.
Current Method: Eng
13U
Ine Performance Trending New Product: Full-Flight Data and Analysis
_%_1 t.Airport Terminal
* ke-Off Cruise
Single data points
multiple flights Single flight across phases
-with continuous data
Time Time
Figure 3. Comparison of current snapshot data collection method (left), and full-flight data capture (right). In the current snapshot method, single points correspond to individual flights. With full-flight data, a continuous profile of one or more metric is possible. Note that graphs and axes are hypothetical and meant for illustrative purposes only.
Source: Author's research, with data obscured for confidentiality.
Full-flight data capture is the newest development in engine data technology, and has
been enabled by improved speed and capacity of data acquisition, storage, and transmission.
Beyond typical ADEM services, which will continue for the foreseeable future, PW is now
turning its attention to creating an ADEM-like system that will offer even more data availability.
This full-flight data availability is an investment PW believes will allow it to expand prognostic
abilities. Furthermore, there is desire to make use of artificial intelligence and machine learning
methods to create an "Internet-of-Things" product, such as a mobile application, that puts data
and control together more efficiently for the engine operator [12]. Much like a health-focused
"wearable" alerts the user to the number of steps taken and calories burned, a mobile application
could be developed for airline fleet managers to track and be alerted to impending engine
maintenance needs.
2.3.3
The eFASTTM System
PW began its quest for full-flight data acquisition with its Pratt & Whitney Canada
(PWC) division, which launched the Flight Data Acquisition, Storage, and Transmission (FAST)
system, to serve Cessna and Bombardier aircraft running on the PW 100 family of turboprop
engines [13]. The FAST system was based on PW's first hardware product for full-flight data
capture, and has become a productionized option for PWC customers. FAST is used on
turboprop missions that are lower in capacity, stage length, and altitude, and was enhanced in
2015 to accommodate full-flight capabilities for narrow-body jets [14]. This enhanced FAST
(eFASTTM) system was developed to serve PW's Geared Turbofan (GTF) family of high-bypass
ratio engines, as well as their predecessor, the V2500. With eFASTTM, PW aimed to capture
greater depth and breadth of data by near-continuous capture, from power-up to power-down, of
a plethora of additional engine performance metrics beyond those of the FAST system.
The eFASTTM product was developed in conjunction with the GTF, and formed part of a
suite of so-called next generation products predicated on fuel efficiency, noise and emissions
reductions, and range extension. The small to mid-size (150-180 seats) narrow-body market, now
dominated by the two most popular commercial aircraft families in the industry, the Airbus A320
and the Boeing 737, was the focus of the GTF. Today, the GTF is the sole engine option for the
Bombardier CSeries family, Embraer E2 family, and Mitsubishi Regional Jet; additionally, it is
an option for the Airbus A320 family's New Engine Option (NEO) and the Irkut MC-2 1.
-j
Importantly, the eFASTTM hardware was first introduced in the build-of-material (BOM)
for Bombardier's CSeries, and thus delivered to each airline customer by default [14]. This first
foray as a Health Monitoring Unit (HMU) installed aboard a commercially-operated PW
turbofan aircraft inspired the transfer of the eFASTTM hardware onto PW's most popular engine
in service, the V2500, as a business case emerged for establishing FFDA for the existing fleet of
Airbus A320 family Current Engine Option (CEO) aircraft, the moniker given to all A320
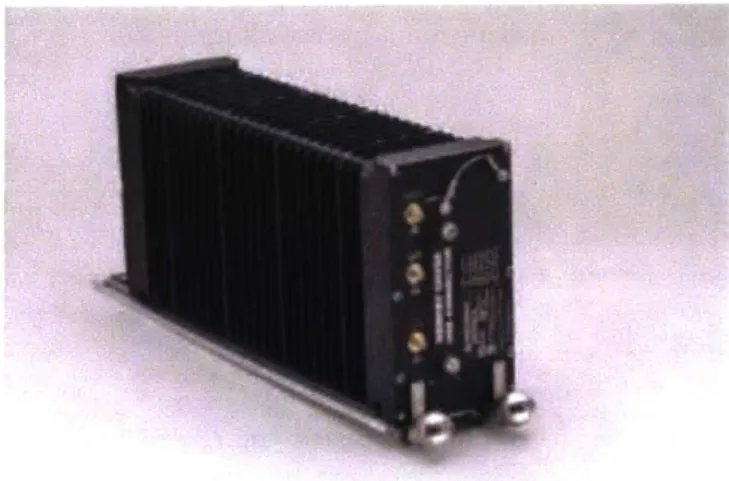
variants running on the V2500. The eFASTTm hardware box, which is connected to the avionics
bay of the aircraft, is shown below in Figure 4.
Figure 4. The eFASTTm hardware in its current form, which connects to the avionics bay of the
aircraft.
2.3.4 V2500 Engine Faults and Adverse Operational Events
The V2500 is a mature engine that has not received an HMU device for full-flight data
capture, but at the time of writing, PW has received the supplemental type certificate to
incorporate eFASTTM onto Airbus A320 family aircraft [15]. The prevailing ACMF reports
transmitted through ACARS has established a mature, single-snapshot level of Engine Health
Management that, while effective for diagnoses of faults that have already occurred, has limited
prognostic capability in its current form. In its current mature state, the V2500 experiences
engine faults that induce adverse operational events (AOE), which PW categorizes by their
disruption to the customer. The AOEs of interest in this study are outlined below.
* Aircraft-On-Ground (AOG): the unplanned grounding of an aircraft from commercial
revenue service due to an engine fault, often caused by an unplanned engine removal
* In-Flight Shutdown (IFSD): a fault that results in a full loss of engine functionality while
at cruising altitude, often induced by the engine's sensors as a precautionary measure
against more severe damage
* Air Turn-Back (ATB): otherwise known as a diversion, an event whereby the flight crew
either chooses or is advised to make a landing at an airport other than its intended
destination
* Aborted Takeoff (ABTO): a planned takeoff is stopped before reaching takeoff decision
speed, either before or during the takeoff run, due to engine sensor notification or any
visual indication to the flight deck that the takeoff cannot be completed safely
" Delay and/or Cancellation (DC): the delay or cancellation of a scheduled commercial
flight due to any suspected or actual engine fault, which may be experienced in
conjunction with mechanical checks or any of the above events
* Ground Turn-Back (GTB): an engine fault is noted on the flight controls' electronic
centralized aircraft monitor (ECAM) either during engine startup or aircraft taxi out.
Maintenance check or repair occurs at the gate.
PW's existing health monitoring employees record all AOE and non-AOE incidents related to
engine performance. This valuable database of engine events has created a searchable toolkit
from which past data, trends, and associations can be deciphered. The utility of this database will
be covered further in Chapter 3.
2.3.5 The eFASTTM Engine Health Management Business Proposition
The existing record of AOEs mentioned above form an extensive database that represents the status quo of V2500 engine health over two decades. If the status quo represents the current health and safety record of the engine, then a future state can be defined in which the full-flight data advancements improve on all of the AOE metrics for engines going forward. The advent of eFASTTM presents such an opportunity to usher in an EHM product that, in its nascent stages, can simply be benchmarked on its improvement to the status quo. Stated differently, one could use the current AOE rates as a baseline, and then show that the value of full-flight data analytics is realized through reduction of event incidence rate. Models for aircraft and engine life cycle cost for airline operators has been studied extensively, generally in analyses of total expected cost of a given aircraft or engine type based on its known performance parameters and maintenance cycles, with assumptions made on labor, fuel, and crew costs [16]. The present study will not make statements about theoretical life cycle costs, but rather will make estimates on likely cost reductions against the status quo of AOEs for V2500 operators. That is, the potential for AOE reductions is used as a heuristic for unlocking the possible cost savings enabled by a full-flight data analytics paradigm for EHM services.
2.4
Airline Economics and Metrics
2.4.1 History of the Airline Industry in the US
The US airline industry was de-regulated in 1978 following decades of profitability supported by government controls over airline routes and pricing, which established high barriers for new entrants. This radical change in the airline business ushered in a plethora of upstart
carriers that have come and gone in a fiercely competitive landscape [17]. The events of September 11, 2001 marked a turning point for the industry as demand for air travel plummeted in the immediate aftermath, and carriers were forced to reckon with oversupply of seats, labor costs in a highly unionized environment, and increasing fuel costs. At the same time, the emerging strength of low-cost carriers (LCC), with their cost-conscious business models and disruptive, low fares, added downward pressure on revenue at the network legacy carriers [18]. Leading up to the Great Recession of the late 2000s, the industry had already begun a series of mergers and acquisitions that resulted in significant consolidation of players in the US market. The decade from 2000 to 2010 saw most US carriers going through bankruptcy proceedings, allowing significant restructuring of business models, labor contracts, and security operations. The introduction of so-called ancillary amenity and service fees came about as airlines sought to increase revenue channels and "unbundle" the standard level of services of a flight ticket to match those of the LCCs; henceforth complimentary inflight meals became buy-on-board meals, and the standard two complimentary checked bags became fee-based checked baggage [19]. These industry-wide changes paved the way for continued improvement in operating costs, and converged with advancements in revenue maximization methods through internet distribution, revenue management, and ancillary fee management. The fortuitous, record-low fuel costs in the mid-2010s helped usher in an era of unprecedented profitability for the smaller number of US-based carriers remaining. The so-called era of "capacity discipline," which in practice meant the strategic reduction by multiple carriers of seats on unprofitable routes, became and continues to be an industry trend [20].
2.4.2 Motivation for Airlines to Adopt Engine Health Services
Historically a low profit margin industry, airlines have continued to chase cost savings
through better fleet scheduling and operations. A shift in fleet utilization for mid- to long-range
domestic flights away from wide-bodies to narrow-body, twin-engine equipment types has
demonstrated the value of engine efficiency. The development of GTF-powered aircraft, as
described above, is a major contribution to this industry trend. Enhanced services such as
full-flight EHM complement the "next generation" products by offering greater visibility into engine
performance and maintenance, and can also be adapted for legacy products such as the
IAE
V2500. OEMs have pushed for more aftermarket products and services beneficial to their
businesses. For the airlines, the promise of greater visibility on maintenance provides yet another
cost-cutting vehicle by way of detecting, preventing, or otherwise proactively mitigating
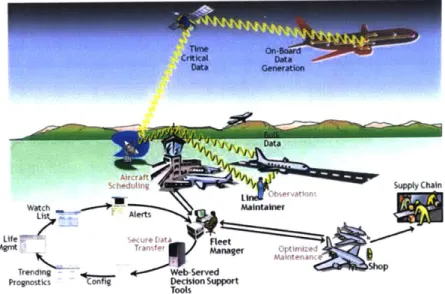
unplanned service disruptions. Figure
5
below shows the various components of an engine data
transmission paradigm, with particular detail on the alert and monitoring cycle that ties the
operations between the OEM and an airline.
UferOAS ,ecure Liat
Mgnt~~ d nepotSupply TtnsJ Datmz Chai
Watch Mantahne
Le
r [ t ho
Trending - nb-Serve
Prognostics oo D l n Supprt
Figure 5. Engine data transmission paradigm, from aircraft to ground station, diagnostics and prognostics cycle, and maintenance optimization for aircraft. Source: Volponi 2014 [9]
Importantly, Figure
5
depicts the entire process of data capture, transmission, storage,
processing, analysis, and delivery as a continuous cycle that involves several stakeholders across
air transportation operations. This visualization sets the stage for characterizing an eFASTTM
"ecosystem" that depends on the collaboration of the various players to ensure data integrity,
accuracy, and security.
2.4.3
Different Definitions of Cost
Airline costs are typically measured on the unit level, most often by Cost Per Available
Seat Mile (CASM) or Cost Per Available Seat Kilometer (CASK). Other unit cost metrics
include Cost Per Scheduled Block Hour (scheduled gate-to-gate hours) and cost per actual block
hour (actual gate-to-gate hours). The aim of these cost metrics is to measure the airline's cost
efficiency, given its supply of seat-miles, scheduled flying, or actual flying-that is, on a single
unit basis, what does it cost the airline to operate? There is also a distinction between operating
cost, operating cost excluding fuel, and total cost [21], [22]. Generally, these categories do not
align perfectly with the traditional notion of fixed and variable costs. Instead, airline costs tend to
be categorized by functional purpose. The nuanced ways of calculating costs are covered below
[23], while particularities on unit costs are shown in the next section:
* Flight Operating Cost, Direct Operating Cost, or Aircraft Operating Cost refers to pilot
pay, fuel cost, maintenance and overhaul, and allocated capital cost (depreciation and
amortization). Stated more simply, these are costs that have to do with the flying of an
aircraft. Approximately
50%
of total costs for an airline can be attributed to Aircraft
Operating Cost.
" Ground Operating Costs include airport-related fees and services: ground handling,
landing fees, passenger processing fees, and reservation centers/travel agencies/distribution system fees. These comprise 17-20% of total costs.
* System Operating Costs are the remaining "general overhead" costs not directly associated with transporting passengers. These include passenger services (on-board meals, amenities, and flight attendant pay), and marketing. Also included are "transport-related costs," a category the encompasses a mainline carrier's fees paid to a regional partner for regional flights. System Operating Costs comprise the remaining 30-40% of total costs.
2.4.4 Basic Airline Metric Equations
As described above, CASM is the main unit metric for comparing costs. The unit in this metric is the Available Seat Mile (ASM). The ASMs of any given flight, route, or network is the scheduled seat capacity planned by the airline. For a given origin and destination (O&D), ASM is calculated as one seat flown one mile, hence its equation,
Available Seat Miles = Total Seats * O&D Distance (1)
This equation holds for an individual flight, the sum of many individual flights, the sum of flights in one airline's network, or even the sum of all flights in the industry, provided that seats are multiplied by their corresponding O&D distance before summation. It is itself a unit metric of supply in the industry, with extra weight given in direct proportion to the distance flown by a given seat. Generally, on a single flight level, ASM is calculated as
As described above, the cost component of CASM can be defined in various ways, depending on the intended purpose for analysis. At the highest level, an airline will report its total network CASM as the sum of all costs realized, including all three categories described in the previous section: Aircraft Operating Cost, Ground Operating Cost, and System Operating Cost. Since Aircraft Operating Costs include even the amortization of capital, an airline's total CASM is a succinct, single metric that accounts for the entire airline's operations. Therefore, the general equation for CASM is
Total Costs (3)
CASM
=Available Seat Miles
Aircraft, Ground, and System Operating Costs Total Seats * Miles Flown
CASM takes this general equation form, but reported CASM can vary based on the elements of the numerator intentionally included or, conversely, excluded. As one of the most volatile components of operating cost, fuel is often excluded in order to calculate an "ex-fuel" CASM independent of the fluctuations in oil price. Ex-fuel CASM is useful for comparing "internal" unit cost performance, that is, how the airline is performing on factors in its control, such as labor, overhead, distribution, and marketing expenses. For reporting purposes, airlines may also choose to report only their mainline operations-that is, flights operated only under its two-letter International Air Transport Association (IATA) code, rather than that of any regional subsidiary or regional partner operating on a seat-lease basis. This latter arrangement, seen most often in short-haul, low-capacity flights to smaller spokes from an airline's hub, are regarded as seats "sold and marketed" by the mainline carrier, but "operated by" a fleet and crew that are not considered to be directly owned or employed by the airline itself. Regional carriers, including
SkyWest, Mesa Airlines, and ExpressJet, often operate regional flights for more than one
mainline carrier. In CASM calculations, an airline or any reporting entity may choose to exclude all regional seat-lease agreements, subtracting out the contract cost for these operations and their
associated ASMs [23].
With respect to units, CASM is customarily reported as cents per ASM. Typical system
CASM in the domestic US industry has ranged from low single digits to high teens, with CASM
generally decreasing as the carrier's average stage length increases [24]. CASM is replaced by
Cost Per Available Seat Kilometer (CASK) for airlines using the metric system. Raw numbers
for CASM and CASK are different owing to the inherent numerical difference between a mile
and a kilometer, but the metric serves the same purpose, and all relative comparisons hold true
under CASM or CASK.
CASM is an industry-wide metric that captures the attention of financiers, consultants,
and academics for its simplicity of aggregation. Figure 6 below shows mainline CASM for ten
Mainline CASM: 2007-2016 17.0 E 15.0 3.0 Ya-4 . 5.0 3.0 2007 2008 2009 2010 2011 2012 2013 2014 2015 2016 Year
- Alaska Airlines Inc. - American Airlines Inc. - Delta Air Unes Inc. Frontier Airlines Inc. - - - Hawaiian Airlines Inc. - JetBue Airways Southwest Airlines Co. - Spirit Air Lines --- United Air Lines Inc. ... Virgin America
Figure 6. Domestic mainline CASM from 2007 to 2016. Data Source: US Department of Transportation and Bureau of Transportation Statistics.
In the decade shown in Figure 6, CASM dipped in 2009 following the 2008 financial
crisis, but appeared to pick up again quickly from 2010 to 2014, years in which oil prices
continued on an upward trajectory. From 2014 onward, the oil industry faced historically low
prices, coinciding with a period of low CASM and high profitability for the airline industry [25].
2.4.5 CASM in its Various Forms
As mentioned in the previous section, CASM can take one of various nuanced forms
depending on the intended purpose of discussion, whether that is a carrier's CFO, a Wall Street
analyst, or an industry publication. Some of the more common types of CASM are outlined
" CASM Ex-Fuel: One of the most commonly reported forms other than total CASM, ex-fuel CASM excludes ex-fuel expenses to keep cost components to those internal to, or otherwise controllable by, the airline itself.
* CASM Excluding Special Items: In some cases, airlines report a CASM that excludes "special items" such as one-time costs of, say, a merger partner or acquisition [26]. * CASM Ex-Transport-Related Costs: As explained above, the costs of a seat purchase
contract to regional airline(s) by a mainline carrier is categorized as "transport-related costs," a component of the aforementioned System Operating Costs. Exclusion of the transport-related costs leaves a CASM that is "mainline only," that is, reflects only the performance of revenue service flown by a carrier's distinctive two-letter IATA code. * Total CASM: Generally, without explicitly stated exclusions, CASM is understood to be
Total CASM, incorporating the total costs incurred by the airline for the given period of time being reported (usually quarterly or full year results for the airline's entire network). Because Total CASM includes transport-related costs, fair comparison across carriers
requires that one keep in mind the inclusion of outsourced, regional flying.
Given the complexity of spreading fixed costs over an airline's entire network of operations, it is often difficult to calculate the true CASM or other unit cost of a single route or flight. The traditional hub-and-spoke model, moreover, makes it nearly impossible to calculate a true CASM for a flight given the plethora of connecting itineraries that spread the "true cost" of a trip across multiple flight legs [23]. CASM comparisons are also complicated by the numerical fact that unit costs do not scale up linearly with the distance flown. In practice, since costs for each departure-arrival cycle are generally fixed, simple arithmetic shows that the longer the
flight, the lower its CASM, as those costs are spread out over more seat-miles. Conversely, short stage length flights see higher CASM than network average, since the fixed costs incurred are spread over fewer seat-miles. As airlines differ significantly in their route networks and hub geography, a direct comparison of total network CASM over all routes may misrepresent an airline's productivity relative to its peers. Inherently, an airline that operates more long-haul flights will appear to perform better on CASM. Because of this imbalance, airlines will also calculate a stage-length adjusted metric for CASM in order to make a viable comparison that controls for the effect of flown distance [27].
2.4.6 The Maintenance Component of Airline Costs
Maintenance has been shown to constitute up to 13% of an airline's total operating cost [28]. Although fuel and labor remain the largest components of airline operating costs, the focus on cost-cutting measures as the industry continuously chases the lowest cost carrier means that any opportunity to reduce the CASM numerator is part of the financial discussion. The AOEs mentioned above all disrupt operations and contribute to unexpected expenses. The unexpected aspect of these disruptions is only partially covered in the present study, given data availability. Although maintenance costs refer generally to mechanical system repairs and upkeep, an irregular operation (IROP) induced by an engine fault can have implications on costs in various aspects of the business, such as additional labor cost for staffing airport or flight crews, re-accommodation costs for affected customers, extra fuel required for route diversions, among
others. The main focus of this study is on the direct maintenance costs as reported by two carriers of interest, so it should be noted that estimates presented here are conservative estimates of cost savings, given the lack of data on airline IROP costs (particularly at the individual airline level).
Comprehensive studies of actual CASM effects would require collaboration across all
stakeholders of AOEs. For the time being, this study seeks to bridge two disparate metrics of cost, one from the OEM and the other from airlines, to understand how incidence of engine events can be translated to unit cost metrics, which are important for airline investment, profitability, and performance outlook.
2.4.7 Maintenance Regulations
All commercial carriers must abide by Federal Aviation Administration (FAA) regulations regarding maintenance. In particular, there are scheduled maintenance events that must occur after certain thresholds of flight cycles or hours, elapsed time since the previous check, or elapsed time since entry-into-service. In industry parlance, these are denoted the "A," "Bi" "C," and "D" checks, labeled in order of increasing complexity, person-hours of labor, and cost [29], [30]. These are briefly detailed below:
* "A" Check: Performed every 65 flight cycles, for routine, light maintenance and engine inspections; completed overnight without disruption to aircraft availability.
" "B" Check: Similar to A Check, but with more comprehensive tasks; generally occurs every 300-600 flight hours.
* "C" Check: Determined by flight hours, flight cycles, and months in service, and as such occurs every 1-2 years; generally involves check of a majority of an aircraft's
components; takes aircraft out of service, from a few days to a couple weeks.
" "D" Check: Considered a heavy maintenance visit, this comprehensive check involves essentially a complete disassembly of an aircraft for complete evaluation of its
components and parts; this check may take up to a month to complete, at a large maintenance facility.
The work scope of these checks may also depend on the equipment type, the recommendations from manufacturers, and the degree of fleet utilization. These scheduled checks, though required by the FAA for comprehensive safety protocol, do present both a time and cost burden on operators. In particular, they create a set of constraints in the so-called fleet assignment problem in operations research literature, wherein the optimal aircraft, crew, and route assignment for an airline's given fleet is solved to maximize utilization and minimize operating costs [31], [32]. One advantage of the routine, scheduled nature of these checks is that they can be predicted with certainty as to their time of occurrence. The challenge of unexpected engine faults and failures, leading to the AOEs mentioned above, is that maintenance schedules need to be reassessed, since even one aircraft taken out of service leads to downstream
disruptions to the entire schedule. The work of this present study, therefore, can help to explain the contribution of probabilistic modeling of unexpected engine events in the context of this fleet assignment problem. With EHM services provided by full-flight data analytics, the impact of the AOE on scheduled maintenance can, at the least, minimize unexpected disruptions and/or provide a heuristic for better understanding of aircraft maintenance schedules.
2.4.8 CASM and Maintenance Optimization
The advent of more sophisticated schedule optimization solutions has helped to improve the operational efficiency of airline operations, including crew scheduling and maintenance scheduling [33], [34]. Generally, such optimization problems have the objective of minimizing
cost for the operation of interest. Although CASM and unit costs are not explicitly stated as objectives, an optimization solution that minimizes costs would logically extend to optimizing CASM and unit costs. Given the current separation between internal engine data and external airline cost data, the hope for this study is to develop a better understanding of the relationship between engine monitoring, maintenance services, and realized costs-all of which will help define the value of full-flight data analytics for the customer. More broadly, further work of this type can help inform and refine future formulations of the ever-growing complexity of air transportation operations research.
Chapter 3
Methodology and Procedures
3.1
V2500 Fault Detection Database
3.1.1 Data Recording
Internal to Pratt and Whitney's (PW) existing EHM services for the V2500 engines is a repository of the data transmitted in ACMF reports through the Aircraft Communications Addressing and Reporting System (ACARS). These reports are fed into the Advanced
Diagnostics and Engine Management (ADEM) portal, which serves as the user interface for the plethora of data captured from every V2500 in commercial service throughout the world. In addition to the raw data-the actual gas temperatures, pressures, oil debris counts-the data of interest for this present study are the engine event reports generated each time an operational disruption occurs due to an adverse engine event, or an impending adverse event. Events can be triggered by flight crew observation or by monitoring staff working around the clock at multiple facilities worldwide.
In the case of an engine event, the field support personnel from PW can survey signals from the engine or components whose physical metrics led to alerts, and can order a borescope procedure to be done, whereby a narrow tube with light and camera is inserted into the engine and is used to probe for signs of damage or deterioration. This procedure is not unlike a colonoscopy that would be done on a human patient. Results from line inspection and any borescoping are recorded into an incidence report, which also indicates what type(s) of AOE
were caused as a result of the engine issue. Each event may trigger more than one AOE; in many cases, one type of AOE is logically linked to another. For example, an aborted takeoff is almost certainly going to trigger a delay or cancellation, depending on the severity of the engine fault.
In addition to records of damage, repair orders, spare orders, and other maintenance action, the engine's operational record is also available. These include flight hours and flight cycles experienced by each engine. Therefore, for any given AOE recorded, the incidence rate can be expressed as the occurrence per number of flight hours or flight cycles. This rate of incidence is important for the present study, as the premise of full-flight fault detection is to reduce as many of these unexpected AOEs as possible. In other words, the aim of diagnostics and prognostics at PW is to prevent or scale down the severity of any such AOEs, and the rate of incidence is a key performance metric that indicates the success or failure of the monitoring, alerting, and prevention tactics of EHM services.
3.1.2 Sample Size Determination
While the V2500 is widely used throughout the global airline industry, it is often not the only power plant chosen for a given carrier's fleet of A320 family aircraft. In fact, most major network legacy carriers in the US and Europe operate a mix of V2500 and CFM-56 engines on their Airbus fleet. As a result, the incidence rates analyzed were reduced to two North American carriers that operate the V2500 engine exclusively on their Airbus narrow-body fleet. Moreover, the two carriers chosen also share characteristics that make them useful subjects of study:
" Both operate a mix of long-haul and short-haul routes throughout North America. " While aircraft age varies between the carriers, both have active orders for more PW