FLIGHT TRANSPORTATION REPORT R96-3
LABORATORY
COMPETITION BETWEEN TRADITIONAL AND LOW-COST AIRLINES FOR LOCAL HUB TRAFFIC
BY: JAMES M. NISSENBERG
ARCHIVES
Competition Between Traditional and Low-Cost
Airlines for Local Hub Traffic
by
James M. Nissenberg
B.A., Geography
University of California, Los Angeles 1994
Submitted to the Department of Civil and Environmental Engineering
in Partial Fulfillment of the Requirements for the
Degree of
MASTER OF SCIENCE IN TRANSPORTATION
at the
Massachusetts Institute of Technology
June 1996
@ 1996 Massachusetts Institute of Technology
All rights reserved.
Signature of Author: ___
Certified by:
Accepted by:
Departmengjf Civif and Environment n
a y 24, 1996
Peter P. Belobaba Associate Professor of Aeronautics and Astronautics Thesis Advisor
Joseph M. Sussman Chairman, Departmental Committee on Graduate Studies
Competition Between Traditional and Low-Cost Airlines
for Local Hub Traffic
by
James M. Nissenberg
Submitted to the Department of Civil and Environmental Engineering on May 24, 1996 in Partial Fulfillment of the Requirements for the Degree of
Master of Science in Transportation Abstract
It is conventional wisdom among informed observers of the U.S. airline industry that the passengers who fly full-service, hub-and-spoke-style, "traditional" airlines like American, United and Delta are significantly different from those who fly so-called "low-cost" airlines Southwest, RenoAir and Valujet. The former supposedly value level-of-service attributes like frequent flights, frequent flyer program, pre-assigned seating and first class cabin, while the latter are mostly concerned with obtaining a low fare. In markets where traditional and low-cost airlines compete, one would expect that the number of passengers flying each airline has statistically different responses to changes in important airline transport supply and market socioeconomic variables. However, few studies have tried to quantify these differences.
This thesis tests the idea that traditional and low-cost airline passengers belong to different market segments. A series of econometric demand models are developed separately for the traditional and low-cost airline for short-haul markets in which the two compete. The markets connect the traditional airline's hub airport with some of its "spoke" cities. Elasticities of demand are calculated for population, per capita income, average fare, nonstop frequency, flight time, cross-fare and cross-frequency. To determine if traditional and low-cost airline passenger elasticities also differ by level of competition, demand models are estimated for three separate hub airports.
Estimated demand model elasticities strongly suggest that traditional and low-cost airline passengers have significantly different valuations of airline trip attributes. The values of exogenous market variables also appear to have a differential effect. Specifically, changes in average fare and flight time seem to have a stronger effect on the number of low-cost airline passengers, while changes in population and per capita income seem to have a stronger effect on the number of traditional airline passengers. Flight frequency seems to have an effect sensitive to the relative number of individual airline flights, but independent of carrier type. Cross-fare and cross-frequency elasticity estimates indicate that, in general, passengers perceive traditional and low-cost airlines as rather poor substitutes. Thesis Supervisor: Dr. Peter P. Belobaba
Dedicated to my Grandfather Samuel Nissenberg and the Memory of My Grandparents Rose and Milton Grey and Sara Grace Nissenberg.
Acknowledgments
First, I would like to thank my thesis advisor and part-time drinking buddy, Professor Peter Belobaba, for hiring me as a research assistant during my first year at MIT. He took a chance on me when things were rough, and I hope he agrees as I do that it was worth it. Also, and I don't think I'm supposed to admit this, he is definitely one of the better teachers at this school.
Next, I recognize the other two airline nerds in the Flight Transportation Lab: Jim Ferea and Daniel Skwarek. I am honestly not sure if I learned as much attending lecture and doing homework as I did listening to them argue the significance of current events in the world airline industry. It's pretty amazing (or sick) when you find people who treat airlines like their hometown football teams. I wish both Jim and Daniel health, success and happiness in the future.
Several people made my life at MIT considerably more fun socially than it should have been. The culprits include Cristian "Pollo Loco" Guiterrez, Chris "Belindo" Ackerman and Cathal "I don't know anything about that" Ridge. Memories include being pushed in the bushes, being stalked by a crazy woman, Chubangua and dancing an Irish jig. Here's hoping we keep in touch.
Thanks to all my acquaintances at the Center for Transportation Studies who shared with me the sweet taste of Roadkill softball wins and indulged in my silly jokes and general giddiness. In particular, Bill Cowart, John Decker, Daniel Rodriguez, Bob Armstrong, Jung Yu, Alex Reichert and Jon Kaufman.
I love my parents very much and am thankful for their love and support. I also thank them for teaching me the golden rule. A degree isn't worth the paper it's printed on if the person holding it doesn't know right from wrong. Of course, I love my brother Brett and wish him great luck as he starts his career.
Finally, I'd like to give a shot right out to my sister Ashley in California. She's all that, know what I'm saying?
Table of Contents
1. INTRODUCTION... 13
1.1 THESIS SETTING AND OBJECTIVE ... 15
1.2 THESIS STRUCTURE... 17
2. COMPARING TRADITIONAL AND LOW-COST AIRLINES...20
2.1 DEFINITIONS OF TRADITIONAL AND LOW-COST ... 20
2.2 DIFFERENCES IN ROUTE NETWORK... 21
2.2.1 Hub-and-Spoke Network... 21
2.2.2 Point-to-Point Network... 23
2.2.3 Quasi-Hub Networks... 25
2.3 M ARKETING AND SERVICE ... 26
2.4 COST STRUCTURE ... 28
3. LOCAL HUB MARKET COMPETITION... 31
3.1 DEFINITION OF LOCAL HUB M ARKET... 31
3.2 AIRLINE CHOICE IN LOCAL HUB M ARKETS ... 34
3.2.1 M ajor Choice Variables... 34
3.2.1.1 Airfares... 34
3.2.1.2 Flight Frequency ... 35
3.2.1.3 Airline Preference... 38
3.2.1.4 Role of Connecting Traffic and Yield Management Systems... 40
3.2.2 M arket Segmentation... 41
4. MODELING LOCAL HUB MARKET DEMAND... 44
4.1 OVERVIEW OF PREVIOUS RESEARCH... 45
4.2 INTRODUCTION TO COMPETITIVE SCENARIOS... 50
4.2.1 M odeling Procedure and Considerations... 50
4.2.1.1 General... 50
4.2.1.2 Combining Cross-Section and Time-Series Data... 53
4.2.1.3 Serial Correlation... 55
4.2.1.4 Simultaneity ... 56
4.2.1.5 Seasonality... 57
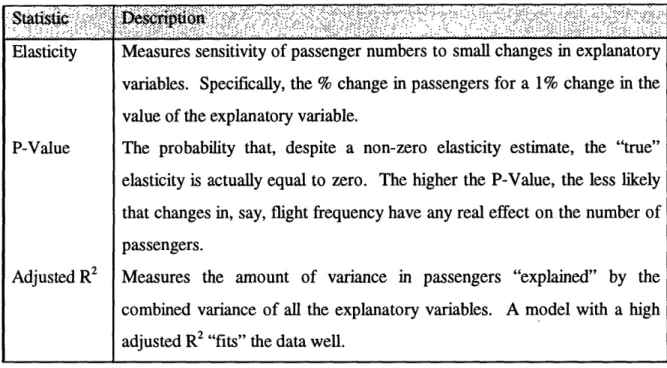
4.2.2 Reporting Model Results... 58
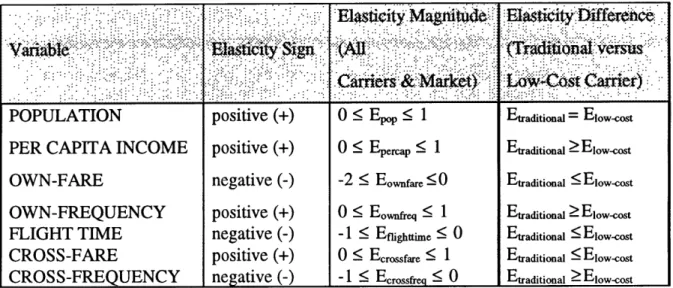
4.2.3 Expectations ... 61
5. COM PETITIVE SCENARIOS... 66
5.1 AMERICA WEST VERSUS SOUTHWEST AT PHOENIX, ARIZONA (PHX) ... 66
5.1.1 Background and Descriptive Statistics... 66
5.1.2 M odeling Results ... 69
5.1.3 Comparison of Elasticity Coefficients... 71
5.2 DELTA VERSUS MORRIS/SOUTHWEST AT SALT LAKE CITY, UTAH (SLC)... 82
5.2.1 Background and Descriptive Statistics... 82
5.2.2 M odeling Results ... 86
9
5.2.3 Comparison of Elasticity Coefficients... 88
5.3 DELTA VERSUS VALUJET AT ATLANTA, GEORGIA (ATL)... 96
5.3.1 Background and D escriptive Statistics... 96
5.3.2 M odeling Results ... 100
5.3.3 Comparison of Elasticity Coefficients... 104
6. SUMMARY AND INTERPRETATION OF ELASTICITY DIFFERENTIALS 117 6.1 POPULATION ... 117
6.2 PER CAPITA INCOM E ... 118
6.3 A VERAGE FARE... 120
6.4 N ONSTOP FREQUENCY ... 121
6.5 FLIGHT TIM E... 122
6.6 CROSS-FARE... 123
6.7 CROSS-FREQUENCY ... 124
7. C O N CLU SIO N S ... 127
7.1 RESEARCH FINDINGS... 127
List of Tables
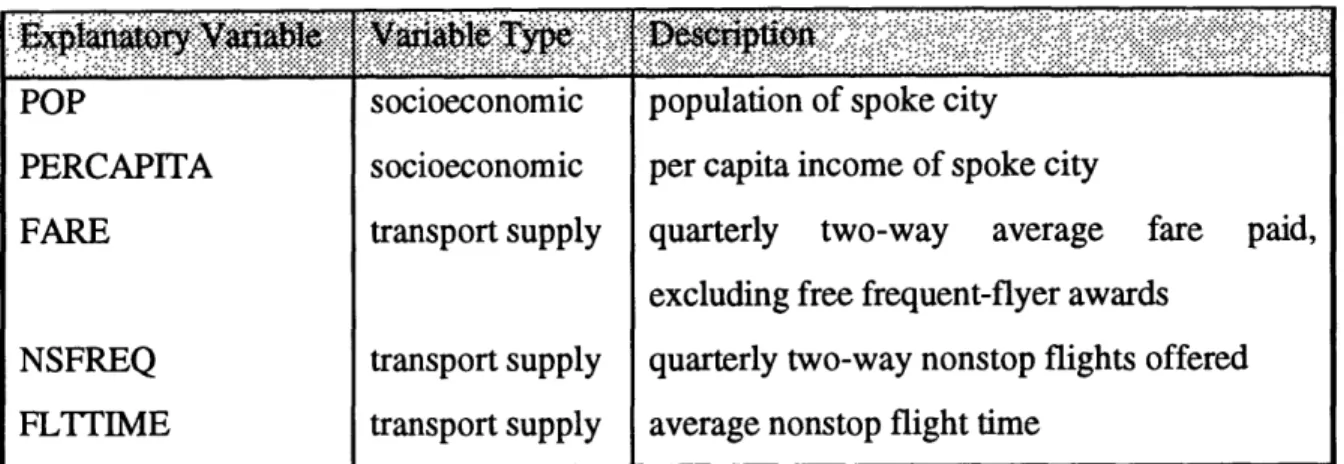
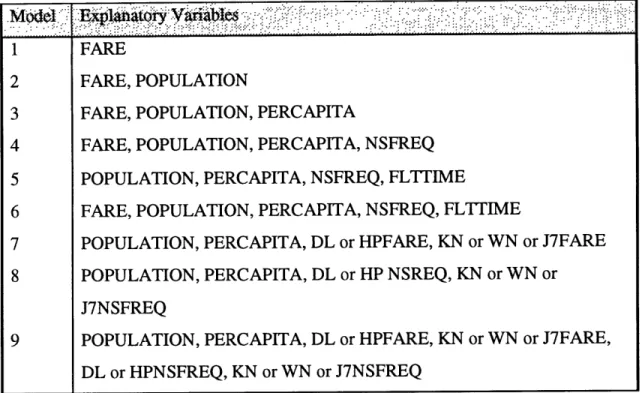
TABLE 4.1: EXPLANATORY VARIABLES USED IN THE DEMAND MODELS ... 51 TABLE 4.2: DEMAND MODEL TAXONOMY ... 54 TABLE 4.3: DESCRIPTION OF REPORTED DEMAND MODEL STATISTICS ... 59 TABLE 4.4: A PRIORI SIGNS, MAGNITUDES AND RELATIONSHIPS FOR DEMAND MODEL
EXPLANATORY VARIABLES ... 64 TABLE 5.1: LIST OF MARKETS USED IN PHOENIX DEMAND MODELS (AIRPORT CODES IN
PARENTHESES) ... 68
TABLE 5.2: DESCRIPTIVE STATISTICS FOR VARIABLES USED IN PHOENIX DEMAND
MODELS... 69
TABLE 5.3: PHOENIX DEMAND MODEL RESULTS ... 72 TABLE 5.4: ELASTICITY RANGES FOR PHOENIX DEMAND MODELS... 73 TABLE 5.5: LIST OF MARKETS USED IN SALT LAKE CITY DEMAND MODELS (AIRPORT
CODES IN PARENTHESES)... 84
TABLE 5.6: DESCRIPTIVE STATISTICS FOR VARIABLES USED IN SALT LAKE CITY DEMAND
M ODELS... 85
TABLE 5.7: SALT LAKE CITY DEMAND MODEL RESULTS... 87 TABLE 5.8: ELASTICITY RANGES FOR SALT LAKE CITY DEMAND MODELS ... 89 TABLE 5.9: LIST OF MARKETS USED IN ATLANTA DEMAND MODELS (AIRPORT CODES IN
PARENTHESES) ... 98 TABLE 5.10: AGGREGATE DESCRIPTIVE STATISTICS FOR VARIABLES USED IN ATLANTA
DEMAND MODELS... 99
TABLE 5.11: ATLANTA DEMAND MODEL RESULTS... 103 TABLE 5.12: ELASTICITY RANGES FOR ATLANTA DEMAND MODELS ... 105 TABLE 6.1: COMPARISON OF TRADITIONAL AND LOW-COST CARRIER POPULATION
ELASTICITY RANGES ... 1181 TABLE 6.2: COMPARISON OF TRADITIONAL AND LOW-COST CARRIER PER CAPITA INCOME
ELASTICITIES... 19
TABLE 6.3: COMPARISON OF TRADITIONAL AND LOW-COST CARRIER AVERAGE FARE
ELASTICITIES... 120
TABLE 6.4: COMPARISON OF TRADITIONAL AND LOW-COST CARRIER NONSTOP
FREQUENCY ELASTICITIES... 121 TABLE 6.5: COMPARISON OF TRADITIONAL AND LOW-COST CARRIER FLIGHT TIME
ELASTICITIES... ... 122
TABLE 6.6: COMPARISON OF TRADITIONAL AND LOW-COST CARRIER CROSS-FARE
ELASTICITIES... 124
TABLE 6.7: COMPARISON OF TRADITIONAL AND LOW-COST CARRIER CROSS-FREQUENCY
ELASTICITIES... .... 125
List of Figures
FIGURE 2.1: EXAMPLE OF A HuB-AND-SPOKE ROUTE STRUCTURE: TRANS WORLD
AIRLINES, JUNE, 1986... 22 FIGURE 2.2: ExAMPLE OF A POINT-TO-POINT ROUTE STRUCTURE: SOUTHWEST AIRLINES,
JUNE, 1995... 24
FIGURE 2.3: ExAMPLE OF A QUASI-HUB ROUTE STRUCTURE: VALUJET AIRLINES,
OCTOBER, 1995. ... 27 FIGURE 2.4: LOW-COST CARRIERS WN, J7,
QQ,
KN, BF, HP AND BP HAVE LOWER UNITCOSTS THAN TRADITIONAL AIRLINES AT SIMILAR AVERAGE STAGE LENGTHS... 29
FIGURE 5.1: MARKET SHARE VERSUS FLIGHT TIME IN LOCAL PHOENIX MARKETS... 79 FIGURE 5.2: FARE DIFFERENTIAL (AMERICA WEST MINUS SOUTHWEST) VERSUS FLIGHT
TIME IN LOCAL PHOENIX MARKETS... 80
FIGURE 5.3: DELTA/VALUJET FREQUENCY SHARE VERSUS FLIGHT TIME IN COMMON
ATLANTA M ARKETS ... 113
--1. Introduction
1.1 Thesis Setting and Objective
A popular theory of airline competition is that the passengers who fly large, full-service, hub-and-spoke-style "traditional" airlines like American, United and Delta are by and large not the passengers who fly smaller, no-frills, "low-cost" airlines like Southwest, RenoAir and Valujet. Traditional airline passengers are generally perceived as more sensitive to airline service characteristics like flight frequency, in-flight and on-ground service and frequent-flyer programs, while low-cost airline passengers are thought to be mainly interested in price. Although it is almost certainly true that there will be some mix of these passenger types on competing traditional and low-cost airline flights, that mix will almost certainly be weighted towards service-sensitive business travelers on the traditional airline flight and price-sensitive leisure travelers on the low-cost airline flight.
As any airline manager will say, the monetary benefit to more precisely defining the characteristics of the passengers an airline carries is not trivial. Airlines need to know what types of passengers they carry because this information helps them to plan everything from the number of seats they should allocate to different passenger types to competitive market strategy. It is this latter use for passenger data that it is important when a traditional airline and a low-cost airline compete against each other for passengers in one or more origin-and-destination (O&D) markets. Here, the advantage to having greater knowledge about the types of passengers one carries relative to one's competitor can be a
significant advantage in pricing, scheduling, marketing new products and even new market entry. For example, if the traditional airline knows that raising its fares will cause few of its passengers to fly the low-cost airline, then it will raise its fares and make more money than it otherwise would have.
If it is true that passengers on traditional and low-cost airline flights do not value different attributes of the airline product -- like price, schedule and on-board service -- as equally important, then the existence and magnitude of these differential valuations ought
to be empirically testable. Although one way to do this would be to use surveys, for example, such qualitative methods have the disadvantages that passengers often remember their priorities differently than when they made their flight selection, and that only the most interested (or bored) passengers reveal significant amounts of information about themselves.
A better way to derive traditional and low-cost airline passenger characteristics would be to use quantitative techniques like those found in classic econometric analysis. The advantage of econometrics is not only that it gives actual numerical answers to what effect changes in airline product offerings will have on passenger numbers, but that it uses actual passenger data, revealing choices that passengers have already made. If econometric equations could be derived relating traditional or low-cost airline passenger demand to, say, changes in important socioeconomic and transport supply variables that affect passenger choice of airline, then each airline would have valuable information about the effects of changes in market variables relative to its competitor.
The objective of this thesis is to estimate econometric models for traditional and low-cost airline passenger demand in common O&D markets. Specifically, equations will be developed to estimate the effects of the most basic socioeconomic -- population and per capita income -- and own-airline and cross-airline transport supply variables
--population, per capita income, average fare, nonstop frequency, flight time, cross-fare and cross-frequency on traditional and low-cost airline passenger demand. Moreover, these equations will be estimated for the traditional and low-cost airline at three separate traditional hub airports where the traditional airline faces different levels of low-cost airline competition for traffic in local hub markets (markets in which passenger origin and destination correspond to the hub city and cities linked to the hub through nonstop flights).
Hopefully, model estimation will provide evidence of three different phenomena. First, different socioeconomic and transport supply variables will have differential effects
on the number of traditional versus low-cost airline passengers in every competitive scenario. Second, these effects will differ according to the level of traditional and cost airline competition at the traditional airline hub. Last, although traditional and low-cost airline elasticities will differ according to their competition level, these differences will occur mainly within rather than between the traditional and low-cost airline. In other words, individual traditional and low-cost airline explanatory variable elasticities will be generally higher (or lower) than those for the other airline independent of the actual competitive scenario.
1.2 Thesis Structure
The remainder of this thesis is divided into six chapters. Chapter 2 defines the terms "traditional" and "low-cost" as applied to different U.S. airlines, and describes some general characteristics of traditional and low-cost airlines. Specifically, differences in route network, marketing and service, and cost structure are discussed. These are the main areas in which traditional and low-cost airline company structure differs and a key to understanding the reasons for the various competitive strategies that each airline type pursues.
Chapter 3 introduces the setting and framework under which traditional and low-cost airline demand models will be developed and estimated later in the thesis. First, the local hub market is defined and illustrated with a real-world example. Then, major local hub market airline choice variables such as airfare, flight frequency, airline preference and the role of yield management systems are described. Last, to provide background for the differential airline elasticities expected to be estimated later in the thesis, the relative importance that one would expect traditional and low-cost airline local hub market passengers to place on the airline choice variables is explained.
Chapter 4 provides an overview of the use of econometric modeling in estimating air travel demand relationships and introduces the local hub market competitive scenarios estimated in this thesis. The chapter begins by reviewing and critiquing the air travel
demand modeling literature, explaining why certain explanatory variables are basic determinants of airline demand and justifying a multiplicative functional form for the airline demand model. Next, the modeling procedures specific to the traditional and low-cost airline demand functions estimated in this thesis are described. Third, the summary statistics that will be used to compare elasticity estimates are reported. The chapter ends with insight into the a priori differential elasticity estimates one would expect from model estimation.
Chapter 5 presents results and interpretation for traditional airline, low-cost airline and total market demand model estimation at the three traditional airline hub airports in Phoenix, Salt Lake City and Atlanta. For each competitive scenario, background and descriptive statistics are given for each airline to provide a sense of the level of inter-airline competition and the range of explanatory variable values used in the data set. Next, demand model summary statistics are reported with comments. Finally, individual airline elasticity estimates are summarized, and the reasons for elasticity differentials exhaustively interpreted with reference to the descriptive statistics and the discussion of basic local market airline choice variables in Chapter 3.
Chapter 6 extends the discussion of individual competitive scenario differential elasticity estimates to a comparison across all competitive scenarios. For each explanatory variable used in the demand models, elasticity ranges are grouped by airline and competitive scenario, and the general "rule" that seems to apply for the elasticity differential stated. This rule is explained with reference to the elasticity estimates and the Chapter 3 discussion on the determinants of local market airline choice.
Finally, Chapter 7 reviews the objectives in estimating separate traditional and low-cost airline demand models, the process used to develop these models, and the main research findings. Although the demand models estimated in this thesis provide some general indications of the differential traditional/low-cost airline effects of changes in basic socioeconomic and transport supply variables, better specified and/or customized airline
demand models are necessary before these results can be applied to actual airline decision making. To this end, several directions for further research are provided with illustrative examples.
2. Comparing Traditional and Low-Cost Airlines
2.1
Definitions of Traditional and Low-Cost
It is hard to find any two observers of the U.S. airline industry able to agree on a nomenclature by which to separate large, hub-and-spoke-style carriers like American, United and Delta from smaller, lower-cost low-fare carriers of differing route structures like Southwest, Valujet and RenoAir. Although there are many terms to divide carriers by history (traditional, post-deregulation, new entrant), unit cost (high-cost, low-cost), fare differential (high fare, low fare), route structure (hub-and-spoke, point-to-point, mixed) or corporate size (major, national, regional), there are few that separate based on the critical difference between these two sets of airlines: operating philosophy. The terms that have been offered, like full-service or no-frills, are unsatisfying because (1) airlines like Southwest and RenoAir offer some services, like frequent-flier mileage, that would be expected only on full-service airlines and (2) competition is blurring the level of service distinction between airlines as full-service carriers cut costs by cutting meals and on-board service quality.
Although there is no simple way to express the whole of an airline's strategy in one word or phrase, two terms whose connotative definitions have come to symbolize the philosophical split between airlines like American, United and Delta, as opposed to Southwest, Valujet and Reno Air are "traditional" and "low-cost". Historically, the word traditional has denoted carriers founded before deregulation in the late 1970s. However, in practice, it has come to mean the largest, hub-and-spoke-style, full-service airlines regardless of when they began scheduled service. Note that this definition of traditional corrects the main shortcomings of the literal definition, namely that America West Airlines (whose operations date back only to 1983) is now included in the group of "traditional" carriers and Southwest Airlines (which began service in 1971) is now excluded.
Low-cost used to simply mean an airline with low costs per available seat-mile (ASM).1 However, America West, whose operational strategy clearly places it among the traditional carriers, has about the lowest unit costs in the airline industry. Now it seems that airlines must meet three criteria to be considered low-cost. First, they must have unit costs below about $.08/seat-mile. Second, their on-ground and in-flight service must be frugal and standardized for all passengers. Last, they must be price leaders in the markets in which they operate. In other words, low-cost airlines are also low-fare airlines.
In this thesis, the terms traditional and low-cost will be used according to the connotations just developed. "Traditional" will refer to the largest, hub-and-spoke, full-service airlines, a list that includes United, American, Delta, Northwest, USAir, Continental, TWA and America West.2 "Low-cost" will refer to low unit-cost, low-frills, low-fare airlines like Southwest, Valujet, RenoAir, Western Pacific, Vanguard, and Air South. Although no longer operating, Morris Air (bought by Southwest in 1994) and MarkAir (bankrupt in 1995) also deserve mention as recent low-cost carriers. Together, these traditional and low-cost airlines provide the overwhelming majority of scheduled service in the United States.3 It is the competition between traditional and low-cost
carriers on common hub-to-spoke routes which is the main focus of this thesis.
2.2 Differences in Route Network
2.2.1 Hub-and-Spoke Network
All traditional airlines and at least one low-cost airline organize their production of air services around a hub-and-spoke network. As
1 A seat-mile is one seat flown one mile. Cost per available seat-mile is the standard measure of unit cost
in the airline industry.
2 Ranked by system revenue passenger-miles (RPMs) for January-May, 1995. See Air Transport World October, 1995: 134. A revenue passenger-mile is one revenue passenger flown one mile.
3 One carrier not in this list is Alaska Airlines, whose operations are confined mainly to the west coast of the United States and the state of Alaska. In this paper, Alaska does not qualify for either traditional or low-cost
status because it does not have a hub-and-spoke route network and its costs are too high to be considered low-cost. 4 Western Pacific Airlines operates a hub at Colorado Springs. However, its size is far smaller than the smallest hub operated by any traditional carrier.
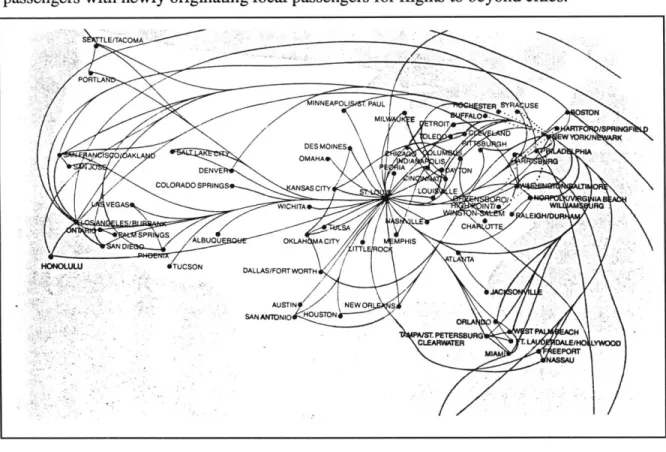
Figure 2.1 illustrates, a hub-and-spoke network connects passengers from many originating cities to many destination cities by means of a central "hub" airport. Each arriving aircraft at the hub carries both passengers destined for beyond cities and passengers destined for the hub city. At the hub, the beyond passengers change planes to connect to other flights5 while the "local" passengers -- those whose final destination is the hub city -- deplane and leave the airport. Hub departures combine the connecting passengers with newly originating local passengers for flights to beyond cities.
Figure 2.1: Example of a Hub-and-Spoke Route Structure: Trans World Airlines, June, 1986.
The hub-and-spoke network has many operational advantages. First, it exhibits economies of scope. That is the number of city-pairs served through the hub increases disproportionately with the number of spoke cities served from the hub. This increases aircraft load factors because each aircraft now carries passengers flying between many
s There are always some passengers who do not need to change aircraft because the aircraft on which they originate is routed from their city of origin to their destination. This type of service is termed "direct" or "1-stop."
different cities. Second, hub-and-spoke operations exhibit economies of scale. As load factors increase, an airline may use larger aircraft with lower per unit operating costs.6 Additional economies of scale may be realized by the consolidation of many airline facilities and contracts at the hub airport. Facilities and contracts, which include maintenance, fuel, crew bases, catering and headquarters, entail substantial fixed costs that would be larger if scattered at different airports as in other route networks. Third, a hub-and-spoke operation engenders market power for the hub airline for passengers flying between hub and spoke cities. This occurs partly because the hub airline offers by far the greatest number of frequencies from the hub city and partly through marketing arrangements to be described in Chapter 2. Last, hub-and-spoke operations facilitate the regular and anomalous scheduling of crews and aircraft since all flights must go through the hub airport.
The main disadvantages to operating a hub-and-spoke network are the increased fuel, airport charge and aircraft utilization cost of an additional per-passenger takeoff and landing, the loss of passengers through the loss of formerly nonstop service between spoke cities (although the additional frequencies offered through the hub do counteract this), and the cost of passenger handling facilities at the hub airport. Other disadvantages to hub-and-spoke operations include vulnerability to competing carriers' nonstop flights between spoke cities; decreases in aircraft utilization and customer satisfaction from hub congestion and resulting Air Traffic Control (ATC) delays; scheduling problems to and from spoke cities located at different distances from the hub; systemwide operational disruptions due to bad weather at the hub city; and high fixed costs at the hub, which virtually cement the hub airline to its hub airport and current operational strategy.
2.2.2 Point-to-Point Network
Most low-cost airlines, including Southwest and RenoAir, operate a point-to-point network. In contrast to a hub-and-spoke network, a point-to-point network is not
6 In practice, however, the increase in aircraft load factors by itself is often enough to justify the establishment of a hub-and-spoke operation.
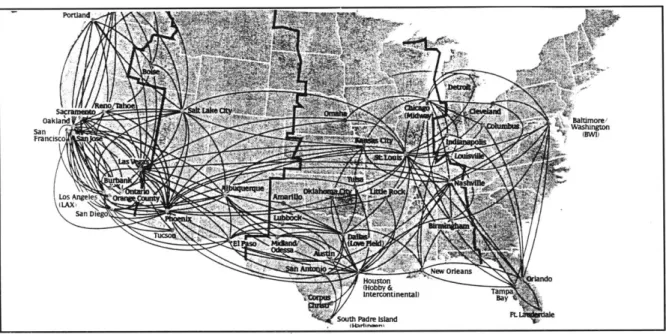
designed to move passengers efficiently through a hub between distant spoke cities. Instead, the main goal of a point-to-point operation is to provide frequent nonstop and direct service between cities whose local demand can support it. While flight connections are possible, they are only realistic at the larger cities, as the sheer frequency of flights may compensate for scheduling that does not explicitly consider connecting traffic. As
Figure 2.2 shows, there is no hub city in a point-to-point operation, although some larger, more centrally located cities may have nonstops to more destinations than other cities.
Portland OakF a San FranciscoW1 San Drlegn Houston0 r= ninental)Ta
South Padre [stand F
Figure 2.2: Example of a Point-to-Point Route Structure: Southwest Airlines, June, 1995.
In a deregulated environment, successful point-to-point networks are based on high aircraft utilization. High aircraft utilization cuts airline unit costs because more departures or more hours of flying are spread over fixed aircraft ownership costs like interest, hull insurance and depreciation. Thus, there is more opportunity for an airline to generate revenues and pay off these fixed costs. In the U.S., low-cost point-to-point carriers achieve increased aircraft utilization mostly through more daily departures.7
7 That low-cost airlines are able to increase aircraft utilization through more departures rather than longer
flights or by stretching the flying day is remarkable because one would intuitively correlate more departures with greater on the ground time and hence less flying hours. It is low-cost airlines' turnaround time that makes the difference.
Unlike airlines with a hub-and-spoke operation, who must allow minimum connecting times between arriving and departing aircraft at the hub, a low-cost airline operating a point-to-point network need only schedule enough time to turn the aircraft around for another flight -- as little as 15 minutes in some cases. Moreover, because point-to-point flights at most airports are spread evenly throughout the day, peak period airport congestion affects a much smaller portion of a point-to-point carrier's system. And, of course, there are never any late connecting flights in a point-to-point network, the effects
of which often domino through the systems of hub-and-spoke airlines.
Increased aircraft utilization also helps low-cost point-to-point carriers lower airport costs. Shorter turnaround times mean that more departures can be handled with fewer gates. And a more even spacing of airport operations decreases terminal costs because less ticket counter space is required to process departing passengers.
For low-cost carriers, the main operational disadvantage of a point-to-point network stems ironically from its reason for being: the focus on local passengers means that there is little connecting traffic -- either on-line or interline -- to raise load factors and not enough flights to enough destinations to confer the same kind of dominance at an airport as a hub-and-spoke carrier would gain. In reality, these disadvantages are often worse because the low-cost airline usually offers an inferior level of service to traditional airlines in the market. However, the low-cost carrier has other ways to fill seats, as will be discussed later.
2.2.3 Quasi-Hub Networks9
Some low-cost airlines operate networks that do not fit the standard definitions of hub-and-spoke, point-to-point or mixed. Mostly, these networks resemble hub-and-spoke
8 On-line connections are connections on the same airline. Inter-line connections are connections between
airlines. With the advent of hub-and-spoke networks, very few passengers need switch carriers anymore to complete their trip.
9 Term used by Michael Levine, Vice President Marketing and International, Northwest Airlines, at
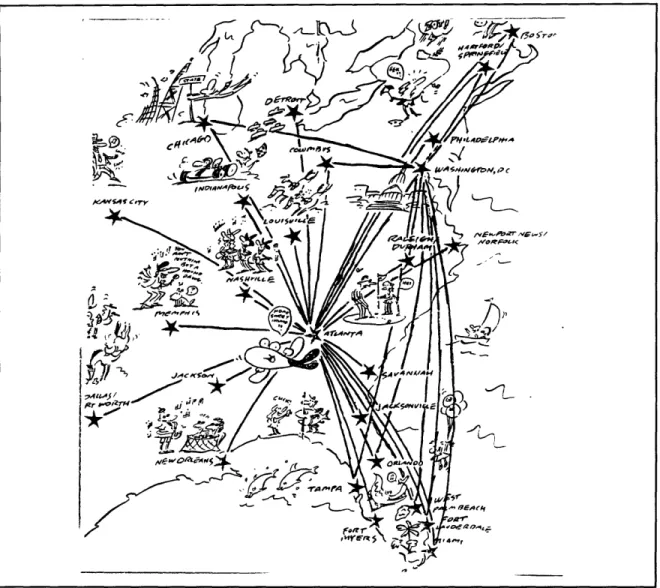
networks, except that the timing of flights is designed for convenience to and from rather than beyond the hub city. Such networks are really quasi-hub, because they do not take advantage of the economies of scope and scale that a hub-and-spoke networks allows. Valujet Airlines, whose route structure is illustrated in
Figure 2.3, is one example of a quasi-hub airline. While Valujet schedules its flights through two "focus" cities (Atlanta, Washington, D.C.) like a hub-and-spoke carrier, few of the flights are timed to make realistic connections. Other Valujet focus cities (e.g. Boston, Orlando) are not in the right locations for connecting traffic; flights to and from these cities are clearly supported by local demand. Morris Air (bought by Southwest Airlines in 1994) had a route network similar to Valujet's. Although Morris Air routed almost all flights through its Salt Lake City "hub," flights departing the hub did not appear to be timed for connections. Instead, Morris schedules seemed to consider only the traffic to and from Salt Lake City.
2.3 Marketing and Service
Although traditional and low-cost airlines fly many of the same routes, their on-ground and in-flight levels of service are often very different. Traditional airlines offer such amenities as pre-assigned seating, frequent-flyer programs, first class cabins, meal service and private airport lounges. Due in part to the consolidation of traffic flows through hubs, traditional airlines also tend to fly widebody aircraft on a number of routes.0 Passengers like widebodies because the cabin is larger and because the seats often have greater pitch."
10 Widebody aircraft have two aisles between three lengths of seats; singlebody aircraft have one aisle between two lengths of seats.
I ~
-~1~~~
Figure 2.3: Example of a Quasi-Hub Route Structure: Valujet Airlines, October, 1995.
Low-cost airlines, by contrast, offer very limited passenger services. Most do not have pre-assigned seating, for example, because the time involved in assigning seats decreases employee productivity. Some do have frequent-flyer programs, but as free trips can only be used over the low-cost airline's rather small and circuitous route network, passengers prefer the frequent-flyer programs of traditional carriers. Meal service, first and business class cabins, private airport lounges and widebody aircraft simply do not exist.
The vast difference in level of service between traditional and low-cost airlines reflects the different types of passengers that each type of airline is trying to attract. Passengers on traditional airlines fly relatively long distances for which pre-assigned seating, meal service, first and business class cabins, frequent-flyer miles and private airport lounges become more desirable. By contrast, low-cost airline traffic tends to fly relatively short distances because connecting opportunities are poor. Moreover, traditional airlines' passengers tend to be less price-sensitive than low-cost airline passengers because their tickets are often paid for by the company for which they work or by clients; low-cost airline passengers usually pay for the ticket themselves. Other price-sensitive low-cost airline travelers are stimulated by lower fares; they would not have flown otherwise. To them, service quality is a strictly secondary concern.
2.4 Cost Structure
As mentioned in Section 1.1, low-cost airlines have unit costs far below those of traditional carriers, in most cases below $.08 per available seat-mile. In general, this means that it is cheaper for low-cost carriers to fly the same routes as traditional airlines. However, because unit costs decline with increasing stage lengths,12 unit cost data for different airlines needs to be "corrected" for average stage length for any meaningful cost comparison. There is no easy formula to correct unit costs for average stage length; the easiest way to do it is to compare pro-rated unit costs on two routes the airlines fly in common with similar size and age aircraft.
1 Unit costs decline with stage length mainly because longer stage lengths are correlated with greater aircraft, labor and fuel utilization. Thus, fixed rental, depreciation and insurance costs are spread over more seat-miles. Other reasons include less frequently incurred airport charges and station costs, and a reduction in maintenance charges based on take-offs and landings.
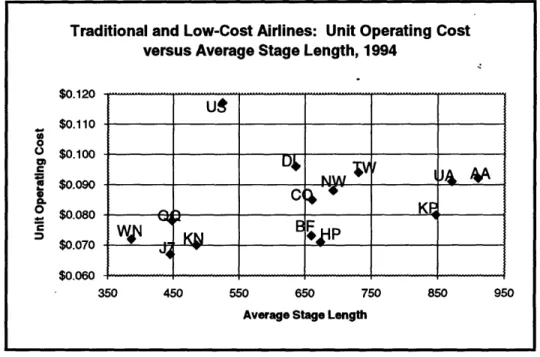
The relationship between unit costs and average stage length is illustrated in Figure 2.4, which plots domestic unit costs versus average stage length for all traditional and some low-cost airlines for 1994. The plot shows that unit costs for the traditional airlines seem to fall on a concave curve that declines with average stage length, while low-cost airline unit costs do not seem to vary much with distance. This implies that increasing stage lengths is a viable, albeit cosmetic, way for traditional airlines to cut unit costs. However, it is more difficult to interpret the placement of low-cost airlines on the plot. Although the points show low-cost airline unit costs invariant with average stage length, there is also a clumping of low-cost airlines into three groups (WN,
QQ,
J7, KN;BF, HP; KP) that suggests differences in cost structure between different types of low-cost airline.Figure 2.4: Low-Cost Carriers WN, J7, QQ, KN, BF, HP and BP have lower unit costs than traditional airlines at similar average stage lengths. (Source: Air Carrier Traffic Statistics Monthly, U.S.DOTBureau of Transportation Statistics, 12 Months Ending Dec. 1994)
As expected, Figure 2.4 also shows that low-cost airlines that fly similar average distances as traditional airlines also cut costs in other, just as significant ways. For example, although many low-cost airlines pay pilot crews market rates, they also require
Traditional and Low-Cost Airlines: Unit Operating Cost versus Average Stage Length, 1994
$0.120 $0.110 0 () $0.100 $0.090 NW6, 4 0$0.080 Q K KF CEF $0.070 W KE $0.060 350 450 550 650 750 850 950 Average Stage Length
more hours of flying." Cabin crews are often paid by the trip rather than by the hour, eliminating pay for on-the-ground time. And because low-cost airlines often fly only one or two aircraft types, they enjoy economies of fleet commonality and size derived from more efficient use of spare parts, maintenance procedures and flight crew training. At least one low-cost carrier, Southwest, has also kept down costs by borrowing money and acquiring aircraft when they identified growth opportunities regardless of the general economic climate. This happened during the recession of 1991-1992 when Southwest expanded capacity in California and Chicago.1 4
* * *
Traditional airlines include the largest full-service, hub-and-spoke style airlines like United, Delta and American. Traditional airlines generally provide amenities like pre-assigned seating, extensive frequent flyer programs, first class cabins, meal service and private airport lounges. However, their costs are relatively high: over $.08 per seat-mile. Low-cost airlines are so named because of their low costs -- under $.08 per seat-mile. However low-cost airlines are also distinguished by their no-frills service and their price leadership in competitive markets. Examples of low-cost airlines include Southwest, Valujet and RenoAir.
3 Of course, because low-cost airline turnaround times are so short and despite the greater number of departures, a greater proportion of flight crew salary already goes to actual flying rather than on-ground time. In fact, one of the arguments by traditional airline pilots wary of cloning low-cost operations for lower pay is that their salaries are not the problem with labor costs. Rather, it is the decrease in productivity from managment's "wasteful" use of the pilots' time (on average, about 1 hour) during hub connections that is uncompetitive.
14 David A. Brown, "Shrewd Capital Planning Allows Southwest to Outperform Competition," Aviation
3. Local Hub Market Competition
3.1 Definition of Local Hub Market
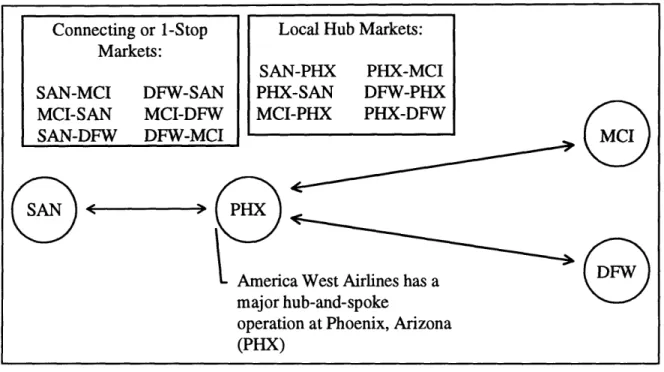
One consequence of the rise of hub-and-spoke route networks in the United States is that passengers with many different itineraries share space on the same flight leg. For example, the portion of a flight by a traditional airline from San Diego to Phoenix may combine passengers whose destination is Phoenix with passengers whose destinations are elsewhere, but who must connect to other flights at Phoenix to complete their journeys. In this case, the passengers whose final destinations are beyond Phoenix are "1-stop" or "2-stop" or "connecting" passengers depending on any plane changes they must make at Phoenix and elsewhere. The passengers who originate their flights in San Diego and fly nonstop to their final destination, Phoenix, are "local" passengers. Similarly, passengers who originate their travel at Phoenix and fly nonstop to San Diego are also local passengers.
Local passengers who fly either direction between an airport at which a traditional airline hubs and an airport connected by the traditional airline to that hub are "local hub passengers." Although there is no reason not to distinguish between local hub passengers who originate at the hub and local hub passengers who originate at the spoke (indeed, such passengers may have significantly different characteristics), it is common to group local hub passengers bi-directionally into the "local hub market." In the example above, because America West Airlines hubs at Phoenix, the Phoenix-San Diego bi-directional
origination and destination (O&D) market is one local hub market (Figure 3.1).
Local hub market passengers play different roles within different route networks. In a hub-and-spoke system, for example, local hub passengers are important because they fills empty seats left after higher revenue connecting traffic has been accommodated. The number of these empty seats is not trivial. Some hubs, like America West at Phoenix, may rely on passengers whose origin or destination is the hub city for as much as 50% of total
enplanements. Other hubs, like Delta Air Lines at Cincinnati, count relatively few local passengers among the enplaned. Most hub-and-spoke airlines, however, enplane at least
30-35% of total hub passengers as local, which is far more than enough to decide the
viability of a hub if competitors for local passengers threaten.
If local traffic1 5 plays an important role in a hub-and-spoke route network, its role in a point-to-point network is critical. As discussed in Chapter 2, point-to-point networks target geographically close medium-to-large size cities with strong enough economic links to support frequent nonstop and direct service. Thus, on another flight from San Diego to Phoenix, but provided by a low-cost airline with a point-to-point network, over 65% of the passengers may be local -- as opposed to 35% for the hub-and-spoke carrier. Conversely, about 35% of the point-to-point airline's traffic will be direct or connecting (but mostly direct). On average, then, the percentages of the types of passengers on a traditional versus a point-to-point airline flight on the same hub-to-spoke route are roughly opposite. In some instances, this limited overlap of passenger type is part of what allows a low-cost carrier to successfully share the traffic with a traditional carrier at a traditional carrier's hub airport.
Local Hub Markets: SAN-PHX PHX-SAN MCI-PHX PHX-MCI DFW-PHX PHX-DFW
Figure 3.1: Comparison of Local Hub Markets and Connecting and 1-Stop Markets. Passengers traveling between San Diego (SAN) and Kansas City (MCI) or Dallas/Ft. Worth (DFW) must stop in Phoenix and possibly change planes to reach theirfinal destination.
Local passengers are at least as important to low-cost airlines with quasi-hub networks as with point-to-point networks. The selection of so-called "focus cities" by quasi-hub carriers implies that there is strong enough local traffic demand at these cities to support flights to a wide array of destinations. In fact, because connecting opportunities are so poorly timed at the more centrally located focus cities, the percentage of local traffic on quasi-hub airline flights might be even higher than on hub to spoke flights operated by a point-to-point airline. This makes attracting local traffic an even higher priority. Connecting or 1-Stop Markets: SAN-MCI DFW-SA MCI-SAN MCI-DF SAN-DFW DFW-M PHX
America West Airlines has a major hub-and-spoke
operation at Phoenix, Arizona (PHX) N CI
MCI
SDFW 8SAN3.2 Airline Choice in Local Hub Markets
3.2.1 Major Choice Variables
3.2.1.1 Airfares
The fare, or price, that must be paid for a ticket is the most important determinant of airline demand. An airline faces two major constraints when pricing its seats. First, it must consider the reaction of market demand. For example, the number of local passengers who want to travel between San Diego and Phoenix on any airline depends on the level of fares in the market. Second, it must consider the fares being charged by its competitors. Indeed, because there is little prima facie difference between a seat on two different airlines for the same service between the same two cities, many air travelers will choose the airline with the lowest fare. This puts tremendous pressure on competing airlines to match each other's fares, and gives a big advantage to the airline with lower costs, who usually becomes the price leader in the markets it serves.16
All airlines offer multiple fares in the same market. As a rule, these fares are the same in value and conditions for all carriers. However, willingness to pay a particular fare depends mostly on the characteristics of the intended passenger trip. In general, passengers on "business" trips -- trips related to personal or company business and planned within a week of the flight -- are willing to pay higher fares because the additional expense of the trip is small compared to the money to be lost by not making it. Thus, variation in the price of business-type fares does not have much effect on the number of business passengers.
On the other hand, passengers on "leisure trips" -- trips made for vacation or to visit friends or relatives, and planned weeks in advance -- will not pay fares as high as passengers on business trips because leisure passengers usually pay for tickets out of their
16 The term "price leader" refers to a firm that sets the price in a market, which other firms than take as
own pocket and have a limited travel budget.7 Thus, variation in the price of leisure-type fares has a larger effect on the number of leisure passengers. Of course, most passenger trips fall along a trip purpose "continuum" and the passengers on them are willing to pay fares somewhere in between these business and leisure extremes.
Because passengers with differential willingness-to-pay tend to buy tickets for the same flight at different times before departure, airlines have used differential pricing as a way to maximize revenue. Typically, the fares airlines make available increase as time to flight departure approaches. This way, the airline can charge later-booking business passengers a higher price than earlier-booking vacationers with little chance that business traffic will be able to qualify for the lower fares.18 Because a business traveler in a short-haul market (less than 750 miles) may pay as much as four times as much as a leisure traveler for what is essentially the same seat,'9 it is extremely important that airlines adopt fare restrictions like advance ticket purchase deadlines to properly segment business from leisure passengers.
3.2.1.2 Flight Frequency
The demand for air travel is derived from the demand for activities at the destination city or in the destination region. Because there is only a certain amount of time during which to take advantage of these activities, potential air travelers usually have a time window during which they are willing to fly. This time window is narrowed by constraints at the origin such as work, school or family obligations.
17 Most business trips are paid for by the company for which the passenger works, or are billed directly to
clients.
18 Airlines also use other methods to separate traffic based on perceived willingness-to-pay. For example, most leisure passengers do not mind staying over Saturday night at their destination, while most business passengers -- many of whom have families and/or other obligations at home -- abhor the idea. Thus, tickets with a Saturday night stay restriction are another way to separate business from leisure traffic.
19 Based on the author's own observations of the highest and lowest fares charged by America West in the Phoenix-San Diego market for much of 1995. The highest unrestricted fare was $159 and the lowest restricted fare
The size and placement of a potential air traveler's time window varies according to the purpose of the trip. Business passengers have a very narrow time window because the activities at their destinations must take place on certain dates or the company loses customers or money. Leisure passengers, including those traveling on vacation and those visiting friends and relatives, usually have a much broader time window because there is no date by which they have to make the trip to avoid "unpleasant" consequences. Their plans are much more flexible.
An airline with greater flight frequencies is more likely to have a flight or a set of flights within a potential air traveler's time window. Assuming that most service on a route is symmetric (i.e. there are an equal number of flights in both directions), the airline with more frequenices in one direction will also have more frequencies in the other. Because passengers almost always choose their outbound and inbound flights together, and because they prefer to use the same airline for both flights (to accumulate frequent-flyer mileage more rapidly or to be near their parked car upon return, for example), there is a thus a disproportionate advantage to the airline with the most frequency on a route, all else equal. In other words, the airline with higher frequency obtains market share greater than its frequency share.
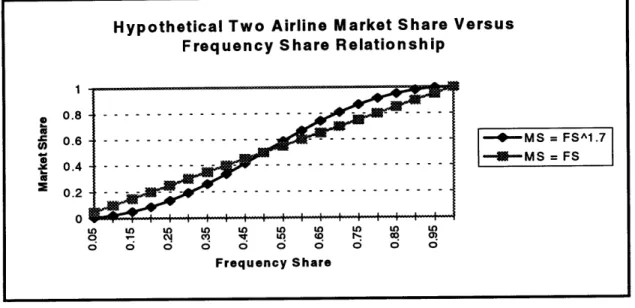
Figure 3.2 illustrates the disproportionate market share versus frequency share relationship for a hypothetical two-airline nonstop market and a factor of proportionality equal to 1.7. (The exact equation for this market share verus frequency share relationship
is MSg = FS1 ! / FS .7 It reads "the market share for airline i is equal to the frequency share for airline i rasised to the 1.7 power, divided by the sum of the frequency shares for airlines i and
j
both raised to the 1.7 power.) Also drawn is the straight line relationship that would exist if market share equaled frequency share. As the so-called "S-curve" shows, the airline with under 50% frequency share suffers a disproportionate loss in market share to the airline with over 50% frequency share. Thus, frequency additionsby one airline are likely to decrease load factors on the other airline at a very fast rate,
Hypothetical Two Airline Market Share Versus Frequency Share Relationship
0 .8 - - - -- - - -0.6 - - - - - - - - --- - MS = FSA1.7 -*-MS = FS 0.4 - - - - - - - - - - -- -- -MS =FS 2 0.2 - - - - - - - - -0 O t O o o to to O F0 0 0 0q 0 Sh 0 0 Frequency Share
Figure 3.2: The airline with greater frequency share gains a disproportionate market share, relative to the case where market share equals frequency share. Thus, increases infrequency by the higher frequency airline can empty the seats of the lower frequency airline at a very fast rate. (Source: Notes for Course 16.74 -Air
Transportation Economics, Massachusetts Institute of Technology, Fall 1994.)
unless the other airline matches the additional frequencies.
In a deregulated environment, the hypothetical market share versus frequency share relationship in Figure 3.2 seldom exists. In fact, almost every factor assumed equal between airlines in the classic S-curve relationship -- fares, service, image, aircraft size and others -- may be different in reality. For example, the low-cost airline may have more seats available at lower fares than the traditional airline in the same local hub market. Intuitively, this would tend to accentuate any frequency share advantage held by the low-cost airline, or, conversely, cushion its loss of market share should it have less frequencies than the traditional airline. On the other hand, through pre-assigned seats, frequent-flyer awards and in-flight snacks, meals and movies, the traditional airline probably has better service quality in the minds of potential air travelers. This would tend to cause the same effects for the traditional airline as lower prices do for the low-cost airline.
One last assumption of the hypothetical S-curve relationship is that passenger demand is constant and zero-sum. If one airline in a two-airline market adds flights, it takes all additional passengers from the other airline. In reality, adding flights on a route also stimulates demand, because the new set of flights will cover more potential air travelers' time windows.2 0 Thus, if one airline adds flights, it will steal market share from
the other airline, but it will also carry new passengers that did not fly in the past. This will make the S-curve even more pronounced, because the higher frequency airline captures an even more disproportionate share of the passengers already in the market, plus all the new passengers stimulated by its additional flights. Alternatively, if both airlines add flights, their market shares will stay about the same but they will both carry more passengers. However, whether additional flights are economically justified depends on competitive considerations such as the magnitude of the load factor gain, the average fares in the market and the importance of the market to the airline's route network.
3.2.1.3 Airline Preference
Most people who fly more than a few times per year prefer to fly certain airlines. Pricing and flight frequency are two reasons already discussed. If the traveler's experience is that one airline usually has the lowest fares, for example, he may contact that airline first to reserve a flight. Similarly, if the traveler's experience is that one airline has had the most flights to the most cities to which he has traveled in the past, he may call that airline first. In many cases, a traveler will compromise between the fare he must pay and the time at which he wants to fly.
Travelers may also choose an airline based on its real or perceived on-ground and in-flight level of service. Important airline service offerings include pre-assigned seats, first-class cabin, in-flight movies and meals, airport clubs and widebody aircraft. Some
20 Additional demand is stimulated up to a "saturation" frequency, after which the increase in new demand
is negligible. Adding another flight after satuation frequency is reached will cause market share gains to be zero-sum, although if the new flight does not provide another attractive departure time, the increase in market share may come at the expense of lower load factors. (Source: Simpson and Belobaba, 16-17.)
travelers will not fly an airline if it means taking a non-jet flight; others will not fly if that airline has had major accidents in the recent past.
Airline marketing innovations such as frequent-flyer programs have been a very successful way to build brand loyalty. Frequent-flyer programs award such items as free trips, first-class upgrades, dedicated check-in and reserved window and aisle seats to their members based on accumulated mileage. Although most airlines establish the same mileage levels for similar awards, the awards themselves increase disproportionately with incremental mileage. This encourages members to concentrate travel on fewer airlines because instead of acquiring, say, 40,000 miles each on two airlines, they can acquire
100,000 miles (and the extra awards) by flying only one.
There are also ways to influence airline choice that are hidden from the traveler. For example, airlines encourage travel agents (who sell approximately 80% of airline tickets) to steer customers towards their flights by offering commission overrides for bookings taken or tickets sold in certain markets above some target level.21 As with frequent-flyer awards, commission overrides increase disproportionately with additional sales after the target level is reached. The standard commission rate of 10% can quickly reach as high as 40% for the incremental sales.
Airlines can also induce bias into travel agent flight selections through the airline-owned computer reservations systems (CRSs) that travel agents use. Although the United States Department of Justice has discovered and prohibited the most egregious abuses of CRS ownership (for example, algorithms that always list the airline owning the CRS first even when that airline does not provide the most convenient departure time), it is unclear to what extent airlines are still able to use CRS's to influence travel agent behavior.
21 Alfred E. Kahn, "The Competitive Consequences of Hub Dominance: A Case Study," Review of
Industrial Organization August 1993: 381-405.
3.2.1.4 Role of Connecting Traffic and Yield Management Systems
Although all airlines offer the same fares in a market, the availability of a particular fare for a particular flight may depend on the value of and demand for other fares that may compete for seats on that flight. The necessity of keeping track of the demand for different passenger itineraries sharing the same flight leg but worth different revenue values to an airline's network has led to the development and continuing improvement of airline yield management systems. By forecasting the demand for different fare types on a flight, setting limits on the number of reservations taken for all but the highest fares and adopting heuristics for special cases,2 3 yield management systems are designed to maximize an airline's network revenue.
The yield management systems of all traditional and some low-cost carriers prioritize reservation requests according to the fare value the requests represent. Such yield management systems are called "revenue stratified." Because requests for connecting itineraries usually represent higher fares, revenue-stratified yield management systems give higher priority to connecting fare requests. This means that the yield management system saves seats for potential connecting traffic first, allocating the remaining seats to local fare/itinerary requests. The result is that depending on the variability of demand for a particular flight leg, the airline may refuse reservation requests by local traffic some of the time if the demand for connecting itineraries is especially high.
Differences in higher fare demand are the main reason why a potential traveler may call two different airlines for a reservation and be quoted two different fares. The fare on the flight that does not expect as much connecting or local business traffic will be lower than the fare on the flight that does expect more higher fare demand. If the potential traveler wants a seat on the higher demand flight, he will be forced to pay a fare
2 For example, the sum of two individually cheaper local fares is generally higher than the corresponding connecting fare, so it makes sense to refuse a request for the itinerary using the connecting fare if enough local demand exists to fill the remaining seats on both flight legs. Actually, the ability to refuse a higher revenue connecting itinerary request for two local itinerary requests is a feature of so-called bid price systems which most carriers do not yet own. The example is only used here for illustrative purposes.
comparable to the fare that the higher demand flight would lose if it accepted a local reservation at the lower fare offered on the lower demand flight.
3.2.2 Market Segmentation
When a traditional airline competes with a low-cost airline in the same local hub market, conventional wisdom says that the traditional airline's strength of schedule, superior frequent-flyer program, better on-ground and in-flight level of service, travel
agent dominance and name recognition allow it to capture the majority of the higher-paying business traffic while the low-cost airline, with its no-frills approach, carries mostly lower-fare leisure-type passengers. In a recent magazine article, for example, executives of several low-cost airlines boldly stated that there is no overlap at all between the traffic on their flights and the traditional airlines' passengers.2 4 'We're bringing passengers back to the airport," one executive said. 'We stole people from their living rooms and automobiles."25 True, many executives at traditional airlines may reply. But because airlines operate as if two seats for the same flight on.two different airlines are close substitutes -- regardless if one airline is traditional and the other low-cost -- traditional airlines may keep their passengers but at much lower fares than if the low-cost competition did not exist.
However, if traditional and low-cost airlines do, in general, carry different segments of the local traffic market, then the differential valuation each airline's customers place on certain transport supply variables should be empirically testable. For example, does an additional flight stimulate more passengers for the traditional or low-cost airline ? Although Chapter 5 focuses on the actual generation of such local hub market demand models, it will help the analysis later if some differential expectations for the effects of the most fundamental transport supply variables on passenger demand are stated now.
2 Paul Gray, "How High Can They Fly?" TIME April 22, 1996: 68-70.
2 Quote by Lewis Jordan, President of Valujet Airlines in TIME April 22, 1996: 68-70.