HAL Id: hal-02974572
https://hal.archives-ouvertes.fr/hal-02974572
Submitted on 21 Oct 2020HAL is a multi-disciplinary open access archive for the deposit and dissemination of sci-entific research documents, whether they are pub-lished or not. The documents may come from teaching and research institutions in France or abroad, or from public or private research centers.
L’archive ouverte pluridisciplinaire HAL, est destinée au dépôt et à la diffusion de documents scientifiques de niveau recherche, publiés ou non, émanant des établissements d’enseignement et de recherche français ou étrangers, des laboratoires publics ou privés.
Where and when to look: Sequential effects at the
millisecond level
José Eduardo Marques-Carneiro, Patrik Polgari, Estelle Koning, Emilie
Seyller, Brice Martin, Erik van der Burg, Anne Giersch
To cite this version:
José Eduardo Marques-Carneiro, Patrik Polgari, Estelle Koning, Emilie Seyller, Brice Martin, et al.. Where and when to look: Sequential effects at the millisecond level. Attention, Perception, and Psychophysics, Springer Verlag, 2020, 82 (6), pp.2821-2836. �10.3758/s13414-020-01995-3�. �hal-02974572�
1
Where and when to look: sequential effects at the millisecond level
Eduardo Marques-Carneiro1; Patrik Polgári1; Estelle Koning1; Emilie Seyller1; Brice Martin2; Erik Van der Burg3,4; Anne Giersch1
1
INSERM U1114, Pôle de Psychiatrie, Fédération de Médecine Translationnelle de
Strasbourg (FMTS), Centre Hospitalier Régional Universitaire of Strasbourg, Université de
Strasbourg, France.
2
Centre Ressource de Réhabilitation psychosociale et de remédiation cognitive, Centre
Référent Lyonnais en Réhabilitation et en Remédiation cognitive (CL3R) Hôpital du Vinatier;
CNRS UMR 5229, Lyon, France.
3
TNO, Netherlands Organization for Applied Scientific Research, Soesterberg, Netherlands
4
Brain and Cognition, University of Amsterdam, Amsterdam, Netherlands
Corresponding author : Anne Giersch
INSERM U1114, Pôle de Psychiatrie, Fédération de Médecine Translationnelle de Strasbourg
(FMTS), Centre Hospitalier Régional Universitaire of Strasbourg, Université de Strasbourg,
2
Abstract
Learning and imitating a complex motor action requires to visually follow complex
movements, but conscious perception seems too slow for such tasks. Recent findings suggest
that visual perception has a higher temporal resolution at an unconscious than at a conscious
level. Here we investigate whether high-temporal resolution in visual perception relies on
prediction mechanisms and attention shifts based on recently experienced sequences of visual
information. To that aim we explore sequential effects during four different
simultaneity/asynchrony discrimination tasks. Two stimuli are displayed on each trial with
varying stimulus onset asynchronies (SOA). Subjects decide whether the stimuli are
simultaneous or asynchronous and give manual responses. The main finding is an advantage
for different- over same-order trials, when subjects decided that stimuli had been
simultaneous on trial t-1, and when trial t is with an SOA slightly larger than trial t-1, or
equivalent. The advantage for different-order trials disappears when the stimuli change
eccentricity but not direction between trials (Experiment 2), and persists with stimuli
displayed in the center and unlikely to elicit a sense of direction (Experiment 4). It is still
observed when asynchronies on trial t-1 are small and undetected (Experiment 2). The
findings can be explained by an attention shift that is precisely planned in time and space and
that incidentally allows subjects to detect an isolated stimulus on the screen, thus helping
3
Where and when to look: sequential effects at the millisecond level
We can follow visual information in a seemingly fluid way, even when it is complex. For
example, we can follow sequences of movements ,accurately in both space and time (Repp &
Su, 2013; Su & Salazar-López, 2016). . Kang et al. (2018) recently showed that sequences of
lights displayed at random intervals of tens of milliseconds (ms) can be easily learned,
suggesting that recent experiences guide our attention in time and space. A high temporal
resolution of visual perception certainly matches our impression of time fluidity in our
movements but also in the visual environment.
Yet, many aspects of conscious visual perception seem slow and not well suited for
high temporal resolution performance (van Wassenhove, 2009; Elliott & Giersch, 2016): for
example, a stimulus onset asynchrony (SOA) of ~30 ms is usually required for two stimuli to
be consciously distinguished in time. For attention to be shifted between the two stimuli
requires an even longer delay of approximately 100 ms (Deubel, 2008). Several studies
additionally suggest that attention is rhythmic, i.e. discontinuous. This has first been proposed
in the context of the dynamic attending theory, and applied to sounds (Large & Jones, 1999
for a review). In vision, attention may also be cyclic rather than continuous (vanRullen, 2018;
Helfrich et al., 2018; Fiebelkorn, Pinsk, & Kastner, 2018). These studies are consistent with
those suggesting that object processing is slow and that perception is discrete rather than
continuous (Scharnowski et al., 2009; Elliott & Giersch, 2016; Herzog, Kammer, &
Scharnowski, 2016). The possibility that attention is cyclic, and perception discrete, is in
contradiction with our strong feeling of time continuity (Dainton, 2017). As a matter of fact,
we do not experience a difficulty to follow events over time. The contradiction between the
discreteness of perception and the strength of our sense of time continuity requires an
explanation, though. We have previously proposed that subconscious prediction of visual
4
visual attention and consciousness systems (Poncelet & Giersch, 2015). It is beyond the scope
of the present study to relate these mechanisms with the sense of time continuity, but this
question is at the background of the present study.
Several studies reporting that perception occurs at high temporal resolution have
typically used synchrony/asynchrony discrimination paradigms, whereby two visual stimuli
are displayed at different spatial locations (Lalanne, van Assche, Wang, & Giersch, 2012;
Lalanne, van Assche, & Giersch, 2012; Giersch et al., 2015). Typically, the two stimuli were
presented on the screen across a range of SOAs, and the participants were instructed to report
whether these events were presented in synchrony or not. Interestingly, these studies reported
that subjects biased their response to the location of the second stimulus. Importantly, this
bias was even observed for asynchronies smaller than 20 ms. This is intriguing, since
temporal asynchronies of this order are typically not visible (van Wassenhove, 2009; Poncelet
& Giersch, 2015).
A bias to respond towards the side of the last stimulus was explored more
systematically by means of a priming paradigm (Poncelet & Giersch, 2015). In the Poncelet
and Giersch study, two empty squares (place holders) were shown, and subsequently followed
by a target in one of the place holders after 50 to 100 ms. The place holders were either
simultaneously presented, or asynchronously with an undetectable delay of 17 ms.
Participants were faster when the target was displayed in the second place holder than when it
was shown in the first one. This effect was interpreted as the result of an automatic shift of
attention towards the location of the second place holder (Poncelet & Giersch, 2015). We
tentatively proposed that the shift of attention is driven by an unconscious prediction of the
sequence of two place holders (see Poncelet & Giersch, 2015 for a detailed discussion). Such
5
effects). Since a series of trial-to-trial effects have been described in the timing literature, we
briefly describe those before detailing our hypotheses for the present work.
To date, there are many studies reporting sequential effects in the temporal domain,
demonstrating that the timing between visual events on a given trial depends on the timing
between two visual events on the preceding trial. For instance, in the variable foreperiod task,
a target appears after a warning stimulus with variable delays and subjects have to respond to
the target as fast as possible. The probability that the target is displayed (the ‘hazard
function’) increases with the increasing warning stimulus-target delay, resulting in increasing
expectation and shorter reaction times (RTs) as the warning stimulus-target delay increases
(Niemi and Näätänen, 1981). However, RTs vary also as a function of the events occurring on
the preceding trial (Los and van den Heuvel, 2001; Vallesi et al., 2013; Los et al., 2017;
Steinborn et al., 2008). The foreperiod (i.e., the time between the warning stimulus and the
target stimulus) of the preceding trial influences performance on the current trial (t): if the
foreperiod on trial t is shorter than that on the previous trial (t-1), reaction times are slowed
down. It is as if the preparation for a long interval leads to a surprise effect when the target
appears earlier than expected. The precise mechanisms underlying this effect are still debated
(see Los et al., 2017 for a review). The sequential effects might reveal a change in the
evaluation of the target occurrence probability, that informs the system when to prepare
(Niemi & Näätänen, 1981). Preparation itself may also be adjusted as a function of recent
experiences, as if those would be replayed (Los et al., 2017; Los, Kruijne & Meeter, 2014).
Whatever the precise mechanisms of these preparation adjustments, the idea that
previous sequences are replayed, or at least that the system readjusts according to previous
experience, may apply to events occurring at higher time-resolution. Sequential effects have
already been reported for brief asynchronies of less than 100 ms, in case of audio-visual
trial-to-6
trial, so that the detection of the asynchrony is minimized (Van der Burg, Alais, & Cass,
2013; Harvey, van der Burg, & Alais, 2014; Van der Burg & Goodbourn, 2015). These results
suggest that asynchronies are detected and adjusted very rapidly and automatically: this
effect, known as rapid temporal recalibration, occurs after passive (i.e. when a response is
not required on trial t-1) as well as incorrect trials (i.e. participants perceive the order of the
preceding trial incorrectly) (Van der Burg et al., 2013; Van der Burg, Alais, & Cass, 2018).
Such mechanisms would be used to optimize multisensory integration, whereby auditory and
visual information is bound into a single percept when coming from a single source, like e.g.
in spoken language (Van der Burg & Goodbourn, 2015). Other mechanisms may be required
to follow unimodal visual information, though. Detecting fine-grained asynchronies may be
useful in order to perceive and reproduce the subtle delays that compose e.g. complex gesture
sequences. This need, i.e. following information in time dynamically, is different from the
need to integrate pieces of information into one unified percept. It would not be surprising,
thus, if the effects of attention shifts differed from the recalibration effects.
In the present study, we will explore sequential effects in simultaneity/asynchrony
discrimination tasks, during which two stimuli are displayed on the screen and subjects decide
whether they are simultaneous or asynchronous. Based on our previous work (Lalanne et al.,
2012a,b; Poncelet & Giersch,2015), we will investigate whether the perceived synchrony on a
given trial t is depending on the order (space) and the asynchrony (time) on the previous trial
t-1. Beyond a relatively trivial facilitation in case of two successive trials sharing the same
spatial properties (order), we hypothesize that the recent experience of asynchronous stimuli
will induce the expectation of a sequence of stimuli similar in both space and time and hence
induce attention shifts ahead of the expected stimuli. Such attention shifts may explain why
subjects, when trying to detect onset asynchronies between stimuli, sometimes perceive a
7
asynchrony detection observed when a stimulus is perceived as alone on the screen may
reveal attention shifts. Attention shifts anticipated on the basis of the previous trial should be
triggered by the first stimulus of the present trial, which can be a temporal trigger signaling
the beginning of the sequence of two successive stimuli. The location of this first stimulus
cannot be taken into account to adjust the prediction of the second stimulus location, because
there is not enough time between the two stimuli to adjust predictions. However, the second
stimulus can be predicted to occur in the same location as in trial t-1, and around the same
time after the first stimulus as on trial t-1. It follows that attention will be at the right place to
detect one single stimulus only when the first stimulus of trial t is in the location of the second
stimulus of trial t-1, i.e. when the direction has changed between the two trials (Figure 1). In
addition, attention will be focused at the right moment to detect the single stimulus when the
second stimulus is displayed slightly later than expected, i.e. when the SOA is longer than on
8
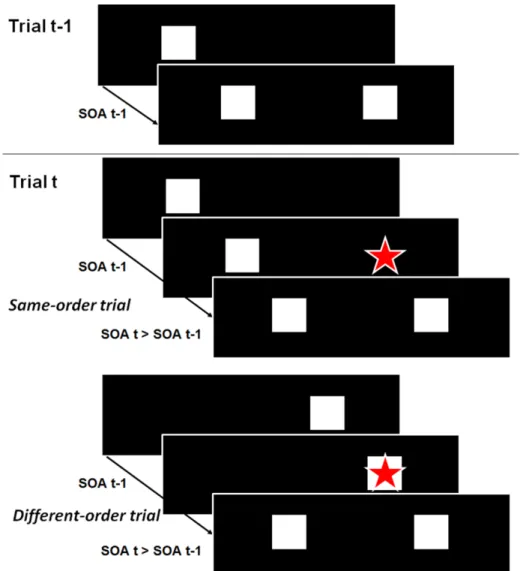
Figure 1: Illustration of the sequential effects expected if trial t-1 is used to predict where and
when the stimuli are presented on trial t, and attention is displaced according to the spatial and temporal characteristics of trial t-1. Trials t-1 are illustrated on the top part whereas corresponding trials t with longer SOAs are illustrated on the bottom part. Same-order trials are illustrated in the middle, and different-order trials in the lowest part. On trial t, attention, which is illustrated by the red star, is shifted toward the location of the second square of trial t-1, at the same time after the onset of the first square as on trial t-1. As a result, attention is optimally focused on the first square of trial t only when the two trials have different orders and when the SOA is slightly longer on trial t than on trial t-1 (i.e. the second square is presented later than expected).
In Experiment 1 we investigate the possibility of attention shifts, by verifying the
hypothesis illustrated in Figure 1: after the first stimulus, which triggers the onset of the
sequence, attention is shifted in space and time according to the previous trial, in order to
attend to the second stimulus. When order is reversed on the present trial, attention ends up in
9
isolated on the screen if the second stimulus occurs later than on the previous trial, thus
facilitating the detection of an asynchrony. In Experiment 2, we verify whether effects depend
on the location of the predicted target: if the predictions based on recent experience involve
attention shifts towards a specific stimulus location, then effects should disappear when the
stimuli location changes. In Experiment 3, we examine whether the trial-to-trial effects also
occur when the SOAs are too short to get noticed. Finally, we have seen that many sequential
effects have been described in tasks involving timing, but here we explore the hypothesis of
attention shifts, which differs from recalibration or adaptation. If this is true, then we may
observe attention shifts’ related sequential effects even in the absence of recalibration effects.
Experiment 4 is aimed at testing this possibility by using data in which recalibration effects
have been discarded (Harvey, van der Burg, & Alais, 2014) and test whether sequential
effects can be found similar to those observed in Experiments 1 and 3.
Experiment 1
The aim of Experiment 1 was to examine whether the perceived (or undetected)
asynchrony on the previous trial affects the perceived synchrony on the current trial. In the
experiment, participants saw two visual events across a range of asynchronies, and
participants were instructed to make a synchrony judgment. If the asynchrony on the previous
trial induces an attention shift according to our hypothesis (Figure 1), then there should be an
improvement of performance specifically when the order of stimuli is reversed from trial t-1
to trial t, and when the SOA is larger on the present trial than on the previous trial.
Alternatively, a general priming effect was expected to induce a general facilitation whenever
the two successive trials share the same order, and conversely a general adaptation effect was
10
types of results according to the difference in SOAs on successive trials, we analyzed the
results with ANOVAs, i.e. by considering the SOA differences as categories. Although this
might appear as maladapted for a variable that is continuous in essence, we considered that
our analysis was severe enough and the only one adapted to verify our hypothesis.
Method
Participants
Experiment 1 was conducted with 14 students from the University of Lyon, or members
of the laboratory. They were aged between 18 and 33 years old (mean 25.2 years, SD 6.9
years, 12 females/ 2 males). The subjects were naive as to the purpose of the experiment. All
the participants had normal or corrected-to-normal visual acuity. None of them had any
neurological or serious somatic disease or had taken any narcotics or drugs affecting the CNS.
The project was approved by local ethics committee in Lyon. Participants provided written
informed consent prior to inclusion in the study in accordance with the Declaration of
Helsinki.
Equipment
Experiment 1 was run on a Pentium PC 4 and programmed using Matlab 7.0.1 (Mathworks, 1984–2004) and psychophysics Toolbox extensions (Brainard, 1997; Pelli,
1997). Stimuli were displayed on a 14 inch CRT monitor (60 Hz refresh rate). The
Experiment was conducted in a mesopic environment (0.1 cd/ m2; day light did not enter the
room). The distance between the screen and the participants was held constant, at 60 cm, by
means of a chinrest.
11
The central blue fixation point (luminance here) was a circle with a diameter of 0.3° of
visual angle. Stimuli were two gray rectangles (width 0.5°, height 1.5 °), one being displayed
on the left side of the screen and the other one on the right (4.5° from the screen center). The
luminance of the rectangles increased gradually from 0.03 (background luminance) to 12
cd/m², over a presentation interval of 119 ms. The luminance was increased gradually to
avoid magno-cellular pathway activation (see also Giersch et al., 2009). The background was
black (0.03 cd/m²) and kept constant during the course of the experiment.
Procedure
Each trial began with the presentation of the fixation point that remained on the screen
until the end of the trial. After a randomly determined delay between 500 and 700 ms, the two
left and right target rectangles were displayed across a range of SOAs (from 0 to 133 ms by
steps of 16.7 ms). On half of the trials, the left target appeared before the right target, and on
the remaining trials the order was reversed. The target rectangles stayed on the screen until
subjects made an unspeeded response, by either pressing the left or right response key when
the rectangles were presented synchronously or asynchronously, respectively. The subsequent
trial was initiated after 500 ms. Each combination of target order (right-left and left-right),
and SOA (9 levels: 0, 17, 34, 51, 68, 85, 102, 119 and 137ms) was tested 20 times in
randomly determined order, yielding a total of 360 trials.
Results
Sequential effects as a function of the SOA difference between trials t-1 and t
The first trial of each block was discarded from further analyses. Furthermore, trials
were collapsed over left target first and right target first trials as we don’t expect an
asymmetry in the synchrony distribution. The results of Experiment 1 are shown in Figure 2.
12
difference between trials t-1 and t, and order difference between t-1 and t. On the x-axis, a
negative value indicates that the SOAs corresponds to smaller SOAs on trial t than on trial t-1
(the 2nd stimulus appears earlier after the 1st one than on the previous trial), and reversed.
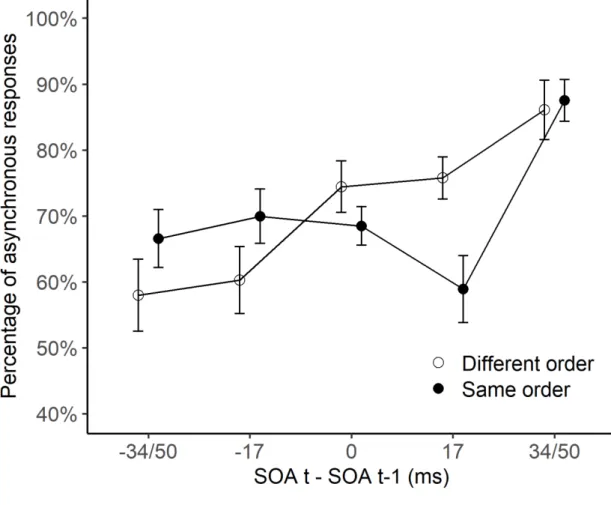
Figure 2: Results of Experiment 1. Mean percentage of ‘asynchronous’ responses are
represented as a function of the SOA difference between trials t-1 and t (a positive difference corresponds to a larger SOA on trial t than t-1, and reversed). The black circles represent those trials where the order (i.e., the direction) of stimuli was identical in trial t-1 and t, whereas the white circles represent those trials where the order was different. SEM are shown as error bars.
We conducted an ANOVA on the mean percentage asynchrony responses with SOA
difference between trials t-1 and t (-34/-51, -17, 0, 17, 34/51 ms; we collapsed 34/51 ms
difference because the random distribution of SOAs across trials means that these differences
13
within-group variables. The ANOVA yielded a significant two-way interaction (F[4, 52]=7.8,
p<.001, partial η²=0.53). Separate ANOVAs were conducted to further examine the interaction. The ANOVAs revealed a significant order effect when the SOA difference was
-34/ -51 ms (F[1, 13]=7.8, p<.05, partial η²=0.37), -17 ms (F[1, 13]=8.6, p<.05, partial η²=0.4), 0 ms (F[1, 13]=9.4, p<.01, partial η²=0.42), and 17 ms (F[1, 13]=21.3, p<.001, partial η²=0.62). The order effect was not significantly different when the SOA difference was 34/ 51 ms (F<1). The results indicate an advantage for same-order trials when the SOA was smaller
on trial t than on trial t-1, but an advantage for different-order trials when the SOA was longer
or equal on trial t as compared to trial t-1.
Comparison of the sequential effects for the various SOA differences
We wondered whether the advantage for different-order trials was related to an
adaptation effect. This would correspond to a disadvantage for same-order trials, whereby the
responsiveness to two asynchronous targets would decrease over time, i.e. from trial to trial, if
they share the same physical (temporal and spatial) properties. If this were the case then the
advantage for different-order trials should be larger when the two consecutive trials share the
same SOA than when they differ. To verify this possibility, we calculated the difference in
performance between same- and different-order trials for each SOA difference and compared
them. The advantage for different-order trials was significantly smaller when SOAs were
equal than when the difference was 17 ms (F[1, 13]=7.2, p<.05, partial η²=0.36), whereas there was no difference in the advantage for sameorder trials when the SOA difference was
-17 ms or -34/51 ms (F<1, p>.8, partial η²=0.003). These effects indicate that the advantage for different- over same-order trials is not related to the similarity between successive trials in
14
Detection vs. criterion
Thus far, the main result is the performance difference for same- versus different-order
trials when the SOA on trial t is 17 ms longer than on trial t-1. One might wonder whether this
difference reflects a discrimination detection ability between same and different-order trials or
a bias effect. For instance, participants could have been biased to respond ‘asynchronous’ in
case of a mere suspicion of spatial order change between trials, and this bias could have been
amplified when the SOA on the trial t was slightly longer than on trial t-1. This should lead to
increased bias when the SOA difference is 17 ms rather than e.g. 0 or -17 ms. We verified
these possibilities by calculating d-prime (d’) and criterion (c) corresponding to the
performance difference between same- and different-order trial, and did this for the different
SOA differences. The percentage of ‘asynchronous’ responses for different-order trials was
considered as hits, whereas the percentage of ‘asynchronous’ responses for same-order trials
were considered as false alarms. D’ and c signify the discrimination ability (i.e., sensitivity)
and response criteria, respectively. For a number of participants, performance was at ceiling
when the SOA was larger than 30 ms on trial t relative to trial t-1, making it impossible to use
SDT (Herzog, Francis, & Clarke, 2019). Therefore, we focused on performance for which
there was no significant difference in mean performance, i.e. sequences with SOA differences
of -17, 0 and 17 ms (there was respectively 67, 71 and 65% correct responses in these
conditions, F[2, 26]=2.2, n.s., partial η²=0.15).
D-prime differed significantly across SOA differences (F[2, 26]=17.4, p<.001, partial η²=0.57). The HSD Tukey post-hoc analysis showed that the d’ was significantly higher in the case of a SOA difference of 17 ms (.33) or 0 ms (.16) rather than -17 ms (-.22), (p<.001 and
p<.005 respectively). There was no significant difference for SOA differences of 17 and 0 ms.
There was no significant difference in the analysis conducted on the criteria c (F[2, 26]=2.7, p=0.08, partial η²=0.17). The results show an effect in terms of sensitivity (d-prime), but not
15
in terms of the bias (c), indicating that the advantage for different-order trials at 17 ms is not
related to a bias towards asynchronous responses when the SOA is longer on trial t than t-1.
Sequential effects as a function of the response given on trial t-1
We examined the impact of the response given on trial t-1 by conducting an ANOVA
on mean percentage of asynchronous responses with SOA difference, order-difference
between trials t-1 and trial t (same versus different) and the response on trial t-1
(‘simultaneous’ vs. ‘asynchronous’) as within subject variables. We focused on the shortest
SOA differences only (-17, 0 and 17 ms), as our previous analyses yielded significant
differences for these conditions. Furthermore, these SOAs represented the vast majority of the
trials. This analysis was conducted to examine whether the trial-to-trial effects observed
16
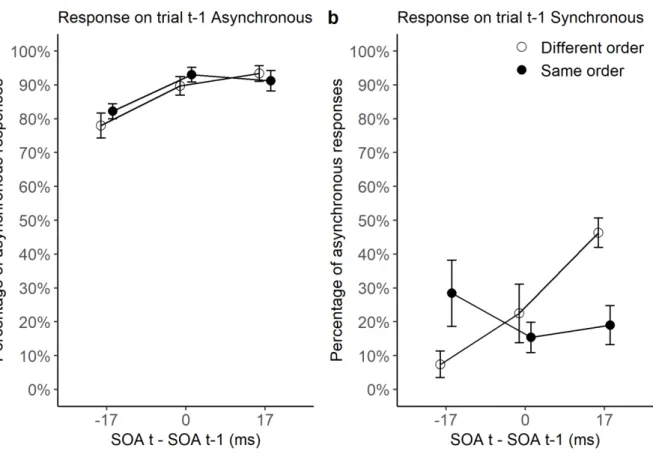
Figure 3: Mean percentage of ‘asynchronous’ responses are represented as a function of the
SOA difference between trials t-1 and t (a positive difference corresponds to a larger SOA on trial t than t-1, and reversed), when participants give an ‘asynchronous’ response on trial t-1 (lefthand panel a) and when they give a ‘synchronous’ response on trial t-1 (righthand panel b). The black circles represent those trials where the order (i.e., the direction) of stimuli was identical in trial t-1 and t, whereas the white circles represent those trials where the order was different. SEM are shown as error bars.
17
The analysis showed that performance was better for trials preceded by a trial yielding
an ‘asynchronous’ rather than a ‘simultaneous’ response (F[1, 13]=296, p<.001, partial η²=0.96). Most importantly, the analysis also showed a significant three-way interaction (F[2, 26]=5.3, p<.05, partial η²=0.29). The interaction was further examined by two separate ANOVAs. When the response on the previous trial was asynchronous, the two-way
interaction between the SOA- and the order-difference failed to reach significance (F[2,
26]=1.2, n.s., partial η²=0.09). The ANOVA yielded a significant interaction between the SOA- and the order-difference when participants perceived the previous trial as
‘synchronous’, (F[2, 26]=7.8, p<.005, partial η²=0.37). ANOVAs on each SOA difference showed an significant order effect when the SOA difference was 17 ms (F[1, 13]=19.1,
p<.001, partial η²=0.6), but not for the other SOA differences (all p values>.09). The results indicate that the advantage for different-order trials does not require a subjective perception of
asynchrony on trial t-1, as it was only observed when participants made a ‘simultaneous’
response on the preceding trial.
Response Repetition effect
Finally, we examined whether subjects generally repeat their response from trial to
trial, because it could explain the advantage for different- over same-order trials, i.e. more
‘simultaneous’ responses for same-order than different-order trials: this occurs when the
subject answered ‘simultaneous’ on trial t-1, and subjects might repeat the ‘simultaneous’
response more when successive trials are identical (same-order trials) than when they differ
(different-order trials). If this was the case, then participants should repeat their
‘simultaneous’ responses when the current SOA is 0 ms (trials with simultaneous stimuli had
not been included in the previous analyses). We measured the rate of asynchronous responses
at SOA 0 ms as a function of the response on the previous trial. However, rates of
18
on the previous trial (17.3%) or asynchronous on the previous trial (14.4%, F[1, 13]<1, partial η²=0.017). This shows that the subjective perception of simultaneity on trial t-1 does not bias the subjects to answer ‘simultaneous’ on trial t, and is unlikely to explain the higher
percentage of ‘simultaneous’ responses for same- than for different-order trials.
Discussion of Experiment 1
The results confirm that trial-to-trial effects do not correspond to a general order
(direction) priming, or non-specific adaptation. Effects depend on SOA differences between
successive trials. When the SOA on trial t is shorter than the SOA on trial t-1, asynchrony
detection is improved on trial t if the order of stimuli is similar on trials t-1 and t (on both
trials left target appeared first or on both trials right target appeared first). In contrast, when
the SOA on trial t is 17 ms longer than on trial t-1, asynchrony detection is better when the
order (direction) is different on the successive trials. A similar but smaller effect is observed
when SOAs are identical on trial t-1 and t. An advantage for different-order trials is mainly
observed when the asynchrony is not reported on the preceding trial. The advantage for
different-order trials is related to improved discrimination of different- vs same-order trials,
rather than a change in criterion.
Although the effects confirm our expectations, the argument for a displacement of the
attention in space is very indirect. In the following experiment, we investigate the importance
of spatial location by comparing effects when the targets on trials t-1 and t are in the same vs.
19
Experiment 2
Experiment 2 was designed to examine whether the location of the targets plays a
crucial role in the advantage for different-order as compared to same-order trials as illustrated
in Experiment 1, as it should be if this effect is related to attention shifts. In Experiment 2, the
task was identical to Experiment 1, except that we manipulated the eccentricity of the targets,
such that the eccentricity on the previous trial was the same (6°), or different (either smaller
or larger; mean eccentricity was 6° on average) compared to the current trial. If the observed
order effects are due to an anticipated shift of attention towards the location of the second
target, then the effect should disappear when the target locations do not overlap from one trial
to another. In other words, we expect to replicate the findings from Experiment 1 when the
eccentricity on trial t is similar to the eccentricity on trial t-1, but not when they are dissimilar.
Method
The experiment was identical to Experiment 1, except for the following changes.
Participants
Nineteen students from the University of Strasbourg or members from the laboratory
participated in Experiment 2. They were aged between 18 and 33 years old, (22.7 years old on
average, SD 2.7, 10 females/9 males). Experiment 2 was approved by a local ethics
committee from the University of Strasbourg.
Equipment
The stimuli were generated using a DELL Dimension 4600 computer and a visual
stimulus generator ViSaGe® (Visual Stimulus Generator, Cambridge Research Systems
-CRS), and displayed on a 20” 120 Hz CRT screen (resolution 800 * 600). The experiments
20
Toolbox for MATLAB®. Two response buttons on the CRS CB6 Push Button Response Box
were used for measuring the responses.
Stimuli
Target stimuli were two white target squares (0.85° x 0.85°) displayed on the left and
right of the screen center, presented on a black background. The targets were displayed at
three possible eccentricities: 2°, 6° or 10° of visual angle from the centre of the screen (the
distance was measured between the centre of the screen and the internal edge of the squares).
Procedure
Each trial began with the presentation of a central fixation point that stayed on the
screen till the end of the ongoing trial, i.e. till the response of the subject. After a delay of 400
to 600 ms (the delay was jittered so that the stimuli could not be predicted in time relative to
the fixation point), the left and the right target appeared across a range of SOAs (0, 17, 33, 50,
67, and 83 ms), so that participants were able to perform the SJ task. Subjects were instructed
to press the left or right response key if they perceived the targets simultaneously or
asynchronously, respectively. The display became blank after participants made their
response and the next trial was initiated after 2 seconds. The left or the right target could
appear first with an equal probability. The eccentricity and SOAs were manipulated within
blocks in random order. In total there were 3 blocks of 216 trials each.
Results
Note that only those trials were included in the analyses in which the eccentricity on
trial t was 6° (similar to Experiment 1), and the SOA difference from one trial to another was
21
1). The first trial for each block were discarded from further analyses. The results of
Experiment 2 are shown in Figure 4.
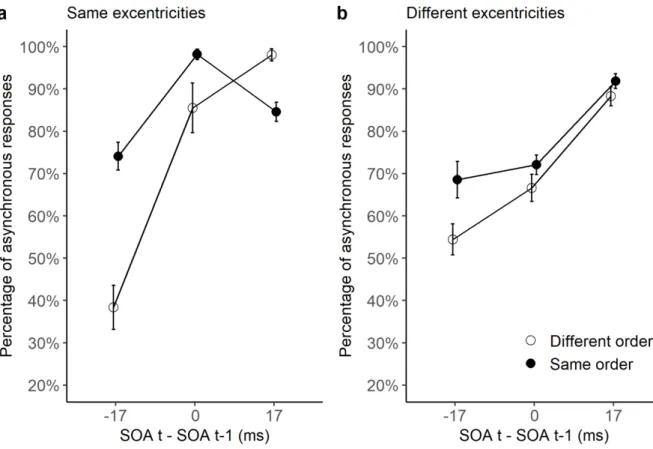
Figure 4. Results of Experiment 2. Here, the mean percentage ‘asynchronous’ responses is
plotted as a function of the SOA difference between trials t and t-1 (a positive difference corresponds to a larger SOA on trial t than t-1). Panel a reflects those trials where the eccentricity was 6 degrees on both trials t and t-1, whereas panel b reflects those trials where the eccentricity was 6 degrees on trial t, and either 4 or 10 degrees on trial t-1. Lines with filled black circles represent responses when the order (direction) of stimuli was identical in trials t-1 and t, whereas lines with white circles represent responses when the order of stimuli was different in trials t-1 and t. SEM are shown as error bars.
We conducted an ANOVA on the mean percentage of asynchronous responses with
SOA difference between trials t-1 and t (-17, 0, 17 ms), order-difference between trials t-1 and
t (same vs. different order), and eccentricity difference between trials t and t-1 (same vs.
different) as within subject variables. The ANOVA yielded a significant three-way interaction
(F[2, 36]=6.4, p<.005, partial η²=0.26).
There was a significant two-way interaction between order difference and SOA
22
partial η²=0.48) ANOVAs showed significant order effects when the SOA difference was -17 ms (F[1, 18]=22, p<.001, partial η²=0.55), 0 ms (F[1, 18]=6.2, p<.05, partial η²=0.25), and 17 ms (F[1, 18]=23.9, p<.001, partial η²=0.57). The results indicate an advantage for same-order trials when the SOA was smaller or equal on trial t and trial t-1, and an advantage for
different-order trials selectively when the SOA was longer on trial t as compared to trial t-1
(i.e. a replication of Experiment 1).
There was also a significant two-way interaction between order difference and SOA
difference when the eccentricity was different between trial t and t-1 (F[2, 36]=3.3, p<.05,
partial η²=0.15). ANOVAs showed significant order effects only when the SOA difference was -17 ms (F[1, 18]=15.9, p<.001, partial η²=0.47). The results indicate an advantage for same-order trials when the SOA was smaller on trial t than on trial t-1. Hence, contrary to
conditions in which eccentricity remained the same, there was no advantage for
different-order trials.
Detection vs. criterion
Contrary to Experiment 1, the percentage of asynchronous responses was often at
ceiling, and we renounced to apply signal detection theory in Experiment 2.
Discussion of Experiment 2
Experiment 2 replicated the advantage for different-order trials when the SOA on trial
t was 17 ms longer than on trial t-1. In line with Experiment 1, this effect was largest for this
particular SOA difference. In fact, the effect was reversed for a SOA difference of 0 ms or -17
ms. The advantage for same-order trials in case of a SOA difference of 0 ms confirms that the
similarity of the consecutive trials is not the critical factor underlying the advantage for
different-order trials observed at 17 ms. Moreover, the results show that the advantage for
23
trial t-1 to t. This location specific effect is consistent with the notion that attention is shifted
towards the location of the second target on the preceding trial. In contrast, the advantage for
same-order trials was significant regardless of the eccentricity on the preceding trial. This
advantage may be due to a sense of motion direction (left-right or right-left).
In Experiments 1 and 2, the SOA difference between two successive trials was
averaged over all SOAs on trial t (except for the 0 ms condition). Hence, it is unclear if the
advantage for different- vs. same-order trials observed in Experiments 1 and 2 can occur even
when SOAs themselves, and not only the SOA difference between consecutive trials, are
sub-threshold. Our hypothesis is that the trial-to-trial effects observed here reveal sub-conscious
orientation of attention in time and space, which compensate for the relative sluggishness of
voluntary attention moves. If this is the case, then attention shifts should be observed even for
very brief asynchronies.
Experiment 3
In Experiment 3, our main aim was to investigate whether the observed trial-to-trial
effects in Experiments 1 and 2 also occur if the order of the targets on the current trial is too
short to be perceived (i.e. sub-threshold), because this would make it possible to shift
attention in advance for sequences of events that follow one another very quickly, and hence
to follow events fluently. In Experiment 3, the task was identical to the task in Experiments 1
and 2. However, Experiment 3 was divided into mini-blocks of four successive trials each. On
the vast majority of trials (i.e., trials 2-4 in the mini-blocks), the SOAs used were very brief
(either 8 or 17 ms), such that we were able to investigate whether we can find evidence for
order benefits using SOAs below threshold. In addition, the use of only two SOAs made it
possible to easily balance all possible 3-trials sequences, taking into account both SOA and
24
participants were presented clear-cut simultaneous and asynchronous stimuli, and were thus
able to perform the task, the SOA of the first initial trial of each mini-block was either 0, 50
or 83 ms.
Since the aim of Experiment 3 was to explore sequential effects when the
asynchronies are not detectable, we analyzed only the 2 last trials of each mini-block, as these
trials were always preceded by 2 targets with a SOA of 8 or 17 ms. This was not the case for
the second trial of each mini-block, as the initial SOA was either 0, 50 or 83 ms. In addition,
we distinguished sequences starting with an initial SOA of 0, 50 or 83 ms. If sequential
effects occur in an automatic fashion, then we expected to observe order benefits regardless of
the sequence. In contrast, if they can occur for sub-threshold asynchronies but require a
minimum of effort, then the order benefits may disappear when the subjects are exposed to
long series of trials with barely detectable asynchronies, especially after series starting with a
synchronous trial. Only SOAs of 83 ms were expected to be detected without any effort in
almost all trials.
Method
The Experiment was identical to the previous ones, except for the following changes.
Participants
17 participants were included in Experiment 3: 24.2 years old, SD 2.8; 11 females, and 6 males.
Equipment and stimuli
Stimuli were always displayed at 6° of visual angle from the center of the screen.
25
The delay between the fixation point and target display was jittered between 300 and
500 ms, so that the first stimulus could not be predicted in time. A total of 128 mini-blocks of
4 trials each were presented. For each mini-block, the SOA for the first trial was either 0, 50
or 83 ms. Each initial trial had a 25%, 37.5% and 37.5% probability to start with a 0, 50 and
83 ms SOA, respectively. The number of trials with 0-ms SOA was minimized in order to
avoid a possible disengagement of the subjects, due to the difficulty to detect asynchronies.
The SOA for the remaining three trials was either 8 or 17 ms.
We balanced the sequences of trials and not only trials themselves, like in the previous
Experiments. Since we look at sequential effects, i.e. the processes occurring from trial t-1 to
trial t, it is important that the to-be compared conditions are presented the same number of
trials. Each possible sequence of three trials (8 possible SOA sequences x 8 possible spatial
order sequences=64 possibilities) was displayed twice across the experiment, and presented in
random order after the initial trial. The side of the response (‘simultaneous’ left and
‘asynchronous’ right, or the reverse) was counterbalanced between subjects.
Results
To make sure that the asynchrony on trial t-1 had not been perceived, we selected only
those trials which yielded a ‘simultaneous’ response. Given the small SOAs used (8 and 17
ms), the vast majority of trials were perceived as synchronous (65.7%). The mean threshold
26
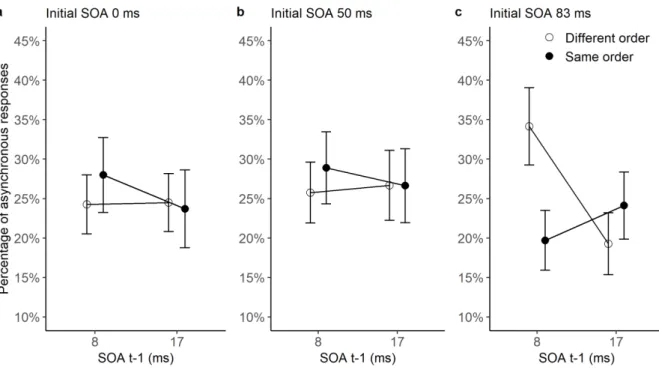
Figure 5: Percentage of ‘asynchronous’ responses (mean ± SEM) after an initial trial with
SOA of 0 (left panel a), 50 (middle panel b) or 83 ms (right panel c), as a function of the relative order in trials t-1 and t (filled black circles: same order, vs. white circles: different order), and as a function of the SOA of the previous trial (SOA t-1: 8 or 17 ms). The analysis was made on performance following a ‘simultaneous’ response on trial t-1, to ensure that asynchronies on conditioning trials had not been consciously detected. The data are averaged over the SOA of the present trial (t), i.e. either 8 or 17 ms.
We conducted an ANOVA on the percentage of asynchronous responses, with the
initial SOA (0, 50 and 83 ms), the SOA on trial t-1 (8 vs. 17 ms), the SOA on trial t (8 vs. 17
ms) and the order-difference (same or different) as within-group variables. The three-way
interaction between initial SOA, order difference and SOA on trial t-1 was significant (F[2,
32]=3.7, p<.05, partial η²=0.19). The three-way interaction was further investigated by conducting an ANOVA with order difference and SOA on t-1 as within subject variables for
each initial SOA condition. When the initial SOA was 0 ms or 50 ms, the ANOVA yielded no
significant two-way interaction (Fs<1). Neither were the two main effects significant (Fs<1).
When the initial SOA was 83 ms, there was a significant interaction (F[1, 16]=13.9, p<.005,
27
different order on trials t-1 and t). ANOVAs were conducted for each SOA on trial t-1. When
the SOA on trial t-1 was 8 ms, i.e. shorter or equal to the SOA on trial t, there was a
significant advantage for different- over same-order trials (F[1, 16]=11.4, p<.005, partial η²=0.42). When the SOA on trial t-1 was 17 ms, i.e. longer or equal to the SOA on trial t, there was no significant difference between same- and different-order trials (F<1). These
results replicate those of Experiments 1 and 2, but only when the initial SOA is 83 ms.
We verified whether the advantage for different- over same-order trials was due to an
advantage for different-order trials or a disadvantage for same-order trials. We first compared
the percentage of asynchrony responses for different-order trials after a SOA of 8 vs. 17 ms
on trial t-1 (initial SOA 83 ms). Asynchronous responses were more frequent after 8 ms
(34%) than after 17 ms (19.3%, F[1, 16]=7.1, p<.05, partial η²=0.31). There was no difference in the percentage of asynchrony responses for same-order trials after a SOA of 8 vs. 17 ms
(F<1). These results are consistent with an advantage for different-order trials rather than a
disadvantage for same-order trials.
We investigated whether the advantage for different- relative to same-order trials, was
related to a change in discrimination or bias by applying signal detection theory like in
Experiment 1. The ANOVA conducted on the d’ showed a significant interaction between the
initial SOA (0 vs. 50 vs. 83 ms), and the SOA on trial t-1 (8 vs. 17 ms, F[2, 32]=6.1, p<.01,
partial η²=0.28). The HSD Tukey post-hoc test showed this to be due to a larger d’ (0.75) when the initial SOA was 83 ms and the first SOA 8 ms, than when the initial SOA was 0 ms
(d’=-0.18, p<.05). There was no other significant difference in the post-hoc analysis, and no
28
We verified also the results when the response was ‘asynchronous’ on trial t-1. The
percentage of ‘asynchronous’ responses was significantly higher when the order of the stimuli
was identical on trials t-1 and t (46%) than when they differed (40%), as shown by a main
effect of order difference (F[1, 16]=5.9, p<.05, partial η²=0.27). There were no other significant effects (Fs<2.2).
Discussion of Experiment 3
Results of Experiment 1 and 2 were replicated in Experiment 3, inasmuch there was an
advantage for same-order trials when the asynchrony was perceived on trial t-1, and an
advantage for different-order trials when the asynchrony was not perceived, at least when the
trials t-1 and t were preceded by a clear asynchrony (83 ms) 2 or 3 trials before. The latter
suggests that the experience of an obvious asynchrony not too long before trial t is a
prerequisite for the sequential effects to occur when asynchronies are sub-threshold. This
suggests that trial-to-trial effects require involvement from the subject, and that they do not
occur totally automatically.
Experiment 4
The advantage for different-order trials is reminiscent of the recalibration effect, albeit
for a specific SOA difference. In order to dissociate the effect observed in the present data
from a recalibration effect, we re-used and analysed a dataset from another study by Harvey
and colleagues (2014). In their study, participants saw a green line at -45° and a red line at
+45°, which were displayed successively across a range of SOAs (see Figure 6 for an
illustration of an example trial), and participants were instructed to make a
synchrony/asynchrony judgment (like in Experiments 1-3). Synchrony distributions were
plotted as a function of the first target event on the preceding trial. Interestingly, and contrary
29
subjective simultaneity was not contingent upon the order of the targets on the preceding trial,
indicating the absence of a visual temporal recalibration effect. With regard to the present
study, if the inter—trial effects observed in Experiments 1 to 3 are similar to a recalibration
effect, we should find no trial-to-trial effect in Experiment 4, as Harvey and colleagues
illustrated that the preceding order did not shift the synchrony distribution. If in contrast we
find an advantage for different-order trials, this would represent an argument for a
dissociation between this advantage and a recalibration effect.
In addition, Experiment 4 allows us to verify the role of motion direction coding.
Effects observed in Experiments 1-3 varied as a function of time and space. Furthermore,
Experiment 2 confirmed the importance of spatial overlap between successive trials. It is
therefore questionable whether the observed sequential effects are due to participants making
a temporal judgment or a motion judgment (or a combination of both) (Cass & Van der Burg,
2014; 2019). Experiment 4 enables us to examine whether sequential effects can be found
with a different stimulus setting that is unlikely to elicit a sense of motion direction. In the
Harvey et al. study, the stimuli were spatially overlapping and therefore less likely to elicit a
motion direction. If the results observed in Experiments 1 to 3 are independent of a motion
direction, then we expect to replicate Experiments 1-3.
Methods
We summarize here the characteristics of the Experiment. More details can be found in
Harvey et al. (2014).
Participants
Fourteen healthy volunteers had participated in Harvey et al.’s Experiment (mean age:
21.3; 8 females/6 males). All had normal or corrected to normal visual acuity. The project was
30
Equipment
The stimuli were generated using Eprime 2.0 software on a Dell Optiplex 990, Intel
i7-2600 CPU at 3.40 GHz, (with a 8 GB of RAM and an AMD Radeon HD 6350 graphics card
running Windows 7 Enterprise 32-bit) and displayed on a Sony Trinitron CPD-E400 CRT 22“
monitor 57 cm from the observer at a refresh rate of 75 Hz (resolution 1280*1024). Manual
responses were recorded using a Dell wired USB keyboard.
Stimuli
The stimuli were a red line at +45° and a green line at -45° crossing at the center of the
screen. The intersection was covered by a grey fixation point (0.4° in diameter), leaving 4
segments visible (a pair of red ones at +45° and a pair of green ones at -45°), each measuring
0.7° in length. The red and green lines were separated by an SOA drawn randomly from a
range of SOAs [0, ±6, ±14, ±50, ±200, ±400 ms]. The sign of the SOAs indicate the order in
which the stimuli appeared on a given trial: negative SOAs correspond to the green line
appearing first and positive SOAs correspond to the red line appearing first.
Procedure
As shown in Figure 6, each trial began with the presentation of a central fixation point.
After a delay of 1000 ms, the red and green lines were displayed with an SOA drawn
randomly from the range of SOAs specified above. The stimuli stayed on the screen until
subjects had responded. Subjects performed a simultaneity/asynchrony judgment task, where
they had to press one response key in case they perceived the stimuli as simultaneous and
another key in case they perceived them as asynchronous. After the response, there was a
31
of 144 trials and the SOAs were randomized within blocks. Each block took approximately 20
min to complete and was followed by a break. Before the experiment, participants carried out
practice trials in order to familiarise themselves with the task.
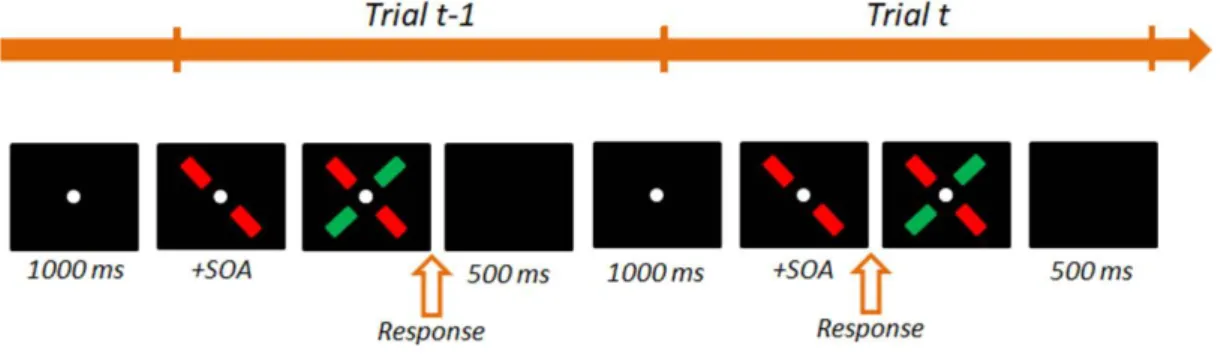
Figure 6: Illustration of the stimuli used in Experiment 4. The stimuli were a red line at
+45° and a green line at -45°, partially covered by a grey fixation point. The presentation of the fixation point indicated the beginning of the trial. The stimuli were then displayed, separated by a given SOA. Note that the sign of the SOA represents the order in which the two stimuli appear. Participants made a response indicating whether they perceived the stimuli as simultaneous or asynchronous. The next trial began after a delay of 500 ms. The upper part of the figure illustrates a sequence of trials where the red stimulus appears before the green stimulus (positive SOAs). The bottom part of the figure illustrates a sequence of trials where the sign of the SOAs differ: the green stimulus appears first on trial t-1 (negative SOA) and the red stimulus appears first on trial t (positive SOA).
In the Experiment designed by Harvey et al., (2014), performance reached a plateau at
an SOA of 50 ms and could hardly be expected to be modulated. For this reason we focused
on the effects observed for SOAs of 6 and 14 ms. We also restricted our analysis on
sequences of trials where the two subsequent SOAs were identical because these were the
32
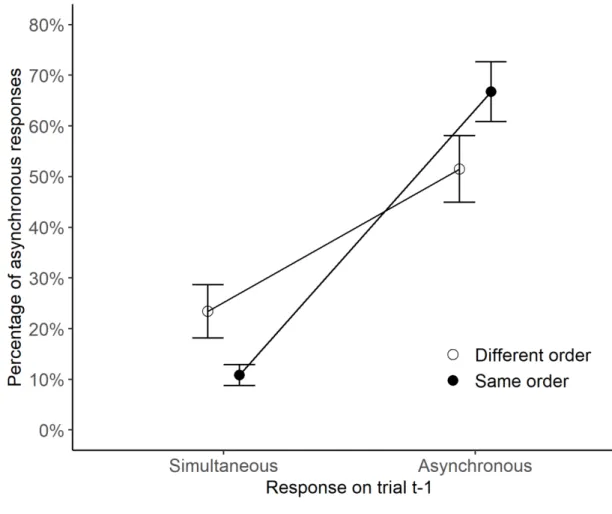
Figure 7: Rate of correct ‘asynchronous’ responses (mean ± SEM), as a function of the
response on trial t-1 (simultaneous vs. asynchronous), and the relative order of trials t-1 vs. t (identical with black circles and different with white circles). The analysis was performed on SOAs of 6 and 14 ms.
An ANOVA was conducted on the mean percentage asynchronous responses with
response to trial t-1 (simultaneous vs. asynchronous) and the relative feature order of trials
(same vs. different on trials t-1 and t) as within-group variables.
The ANOVA yielded a significant main effect of response on trial t-1 (F[1, 13]=144.7,
p<.001, partial η²=0.92). The rate of correct responses was higher by 42% when stimuli on trial t-1 were judged asynchronous (59%) than when they were judged simultaneous (17%).
The results also showed a significant two-way interaction (F[1, 13]=5.4, p<.05, partial η²=0.29). The interaction was further examined using two one-way ANOVAs for each
33
response type on the preceding trial. When participants made a ‘synchronous’ response on the
preceding trial, the ANOVA revealed the responses were more accurate by 13% when the
stimulus order between successive trials was different (23.4%) than when it was the same
(10.8%, F[1, 13]=5.9, p<.05, partial η²=0.31). When the stimuli were judged as asynchronous on trial t-1 no such effect was found (F[1,13]=2.7, p=.13, partial η²=0.17).
Discussion of Experiment 4
Like in Experiments 1 and 2, there was an advantage for different-order trials when the
asynchrony was not perceived on trial t-1, suggesting a dissociation between this advantage
and recalibration effects. Unlike in Experiments 1-3, however, in Experiment 4 stimuli were
overlapping in space and could not elicit a sense of direction. Hence the results suggest that
the advantage for different-order trials is independent of the perception of motion direction.
General discussion
In the present study we investigated whether temporal and spatial information about
visual sequences influences when and where we look subsequently. In four experiments we
show an advantage for different-order trials (Experiments 1 to 4), i.e. improved asynchrony
detection on trial t when stimuli are displayed in a different order compared to the order on
the preceding trial (t-1). However, this improvement was predominantly observed when
subjects failed to detect an asynchrony on the previous trial. Furthermore, this advantage for
different-order trials depends on the relative SOA between the two successive trials
(Experiments 1 to 3). More specifically, the largest effects were observed when the SOA on
trial t was 17 ms larger than on trial t-1 (Experiment 1 and 2). The advantage for
different-order trials disappeared when the location of the targets differed from the trial before
(Experiment 2). Finally, the advantage for different-order trials was still observed in a dataset
34
for different-order trials as observed in Experiments 1 to 4 vs. temporal recalibration. It is to
be noted that the advantage for different-order trials was replicated across experiments, which
were each programmed with different randomization tools. In Experiment 3, trial sequences
were precisely balanced, making it unlikely that serial dependency explains the results.
These results are consistent with our notion that subjects shift their attention in time and
space according to the events on the previous trial. Attention is shifted to the location of the
previous second target, and performance improves if the first target appears in this location
(i.e., a different-order trial), and if the second target occurs later after the first target than in
the previous trial. In that case only, attention lands on a target when it is still alone on the
screen (Figure 1). This explains why performance improves for different-order trials only
when the SOA in trial t is larger than on trial t-1.
In addition to the advantage for different- over same-order trials, we also observed an
improvement when the order of the events on a given trial was similar to the order on the
previous trial. Such an improvement was observed when the SOA on trial t-1 was longer than
the SOA on trial t (Experiment 1 and 2), and contrary to the different order effect, this
improvement was mainly observed when the asynchrony between two targets was perceived
on the previous trial (Experiment 2).
As a whole, the pattern of results allows us to discuss different alternative explanations.
The impact of the response on trial t-1 suggests that the facilitation for same-order trials
depends on the detectability of the asynchrony on trial t-1. This might be akin to a priming
effect, and especially a priming of direction. A role for direction priming is also supported by
the fact that the advantage for same-order trials remains even when the eccentricity of targets
35
eccentricity of the targets, and direction priming is not expected to be sensitive to the location
of the targets. It is thus clear that direction is processed, at least in Experiment 1 to 3.
Whereas direction priming may be an explanation for the same-order effects, it is
questionable whether this can also explain the improved performance for different-order
trials. A priming of sub-threshold direction has been demonstrated in the literature (Melcher
& Morrone, 2003), and shorter presentations of motion stimuli often favor priming effects
(Pinkus & Pantle, 1997; Kanai & Verstraten, 2005; Brascamp et al., 2007; Lauffs, Choung,
Öğmen, & Herzog, 2018; but see Alais, Leung & Van der Burg, 2017). Priming per se cannot explain the advantage for different-order trials, since the results are opposite to a priming
effect.
Adaptation has also been repeatedly shown, though, and especially motion adaptation.
If exposure to a given motion direction is long enough, it causes a reduction of the response to
this precise direction (Petersen et al, 1985; Kohn & Movshon, 2004). Adaptation would best
fit with an advantage for different-order trials. However, several results allow us to discard
this explanation. First it is not clear why the advantage for different-order trials should occur
only if the SOA on trial t is 17 ms longer or equal to trial t-1. Moreover, adaptation to
direction should not depend on the precise location of the stimuli, and should have persisted
whatever the eccentricity of the targets in Experiment 2. This was not the case. Finally, in
Experiment 4, we investigated sequential effects when stimuli could not elicit a sense of
motion direction. Despite this, the advantage for different-order trials was still observed. All
in all, the results suggest that the mechanisms at work for same- and different-order trials
differ, and that the processing of motion direction does not explain the advantage for
36
A global recalibration effect did not occur, i.e. a general advantage for different-order
trials. The advantage for different-order trials seems to be very specific to short SOA
differences between the two successive trials (Experiments 1 to 3). This result is consistent
with a previous study (Harvey et al., 2014), which showed no global shift of threshold in case
of unisensory information. The contrast between a global adaptation effect and the
performance modulation described in the present study is confirmed in Experiment 4. We
used the same data as in Harvey et al. (2014) study, in which it had been shown that with
unisensory information, there is no temporal recalibration of threshold on a trial-to-trial basis.
Despite this, performance improved in case of different-order trials, as compared to
same-order trials, when SOAs below 50 ms were identical on the successive trials. These results
show that the advantage observed for different-order trials is different from temporal
recalibration. Furthermore, recent studies reported that rapid temporal recalibration to
audiovisual asynchronies were independent on whether participants perceive the preceding
trial as being synchronous or asynchronous (Van der Burg et al., 2013; Van der Burg &
Goodbourn, 2015). This is clearly different from the present results, where we showed that
the advantage for different-order trials was observed mainly when the asynchrony was not
perceived on trial t-1, and specifically when the SOA on trial t-1 (the previous trial) was
slightly shorter or equal to the SOA on trial t (the present trial). Taken together, the results
suggest the existence of mechanisms that differ from the trial-to-trial effects described in the
literature. This makes sense inasmuch recalibration may reflect an adaptation in order to
better bind information from different sources, whereas the advantage for different-order trials
described in the present work would be the consequence of our ability to predict and follow
information from the same source at a high frequency rate.
In Experiments 1-4, we observed an advantage for different- vs. same-order trials. One
37
similar on the two successive trials, and alternate responses if the stimuli are different. This
might explain an advantage for different-order over same-order trials when the response on
trial t-1 is ‘simultaneous’. However, if this was the case, then a response repetition effect
would still not explain why the improvement was only observed for certain SOA differences.
For instance, in Experiment 3, the advantage for different-order trials was observed when the
SOA on trial t-1 was 8 ms, but not when it was 17 ms. Moreover, no response repetition was
observed in Experiment 1 when the SOA on trial t was 0 ms. Furthermore, applying signal
detection theory in Experiments 1 and 3 further supports the notion that the observed
improvements for different- versus same-order trials is related to a change in discrimination
sensitivity rather than decision criterion.
The advantage for different-order trials rather fits with an attention shift and with
previous studies (Lalanne et al. 2012a, b; Poncelet & Giersch, 2015). Importantly, Experiment
4 suggests that this attention shift is not necessarily spatial. To summarize our interpretation,
it was expected that the trial-to-trial prediction would include the location (or the features) of
the last stimulus at around the same time after the first stimulus as on the previous trial. Such
an orientation of attention may explain the advantage for different-order trials (or different
feature-order trials) when the second stimulus appears later than expected (Experiment 1 to 3)
or at the expected time (i.e. when the SOAs on trials t and t-1 are identical, Experiment 1, 3,
4). As mentioned in the introduction, attention would be shifted towards the location (or the
feature) of the first stimulus of trial t in case of different-order trials, i.e. when the first target
of trial t is presented at the same location (or the feature) of the second target on trial t-1. If
participants attend to the first stimulus when it is still alone on the screen, then subjects may
be better able to detect the asynchrony. The fact that this effect works even when SOAs are
identical on the two successive trials can be explained by attention being shifted slightly in