HAL Id: inserm-01192813
https://www.hal.inserm.fr/inserm-01192813
Submitted on 3 Sep 2015
HAL is a multi-disciplinary open access
archive for the deposit and dissemination of
sci-entific research documents, whether they are
pub-lished or not. The documents may come from
teaching and research institutions in France or
abroad, or from public or private research centers.
L’archive ouverte pluridisciplinaire HAL, est
destinée au dépôt et à la diffusion de documents
scientifiques de niveau recherche, publiés ou non,
émanant des établissements d’enseignement et de
recherche français ou étrangers, des laboratoires
publics ou privés.
Renaud Sabatier, Pascal Finetti, Arnaud Guille, José Adelaïde, Max
Chaffanet, Patrice Viens, Daniel Birnbaum, François Bertucci
To cite this version:
Renaud Sabatier, Pascal Finetti, Arnaud Guille, José Adelaïde, Max Chaffanet, et al.. Claudin-low
breast cancers: clinical, pathological, molecular and prognostic characterization. Molecular Cancer,
BioMed Central, 2014, 13, pp.228. �10.2174/156652412798376134�. �inserm-01192813�
R E S E A R C H
Open Access
Claudin-low breast cancers: clinical, pathological,
molecular and prognostic characterization
Renaud Sabatier
1,2,3, Pascal Finetti
1, Arnaud Guille
1, José Adelaide
1, Max Chaffanet
1, Patrice Viens
2,3,
Daniel Birnbaum
1and François Bertucci
1,2,3*Abstract
Background: The lastly identified claudin-low (CL) subtype of breast cancer (BC) remains poorly described as compared to the other molecular subtypes. We provide a comprehensive characterization of the largest series of CL samples reported so far.
Methods: From a data set of 5447 invasive BC profiled using DNA microarrays, we identified 673 CL samples (12,4%) that we describe comparatively to the other molecular subtypes at several levels: clinicopathological, genomic, transcriptional, survival, and response to chemotherapy.
Results: CL samples display profiles different from other subtypes. For example, they differ from basal tumors regarding the hormone receptor status, with a lower frequency of triple negative (TN) tumors (52% vs 76% for basal cases). Like basal tumors, they show high genomic instability with many gains and losses. At the transcriptional level, CL tumors are the most undifferentiated tumors along the mammary epithelial hierarchy. Compared to basal tumors, they show enrichment for epithelial-to-mesenchymal transition markers, immune response genes, and cancer stem cell–like features, and higher activity of estrogen receptor (ER), progesterone receptor (PR), EGFR, SRC and TGFβ pathways, but lower activity of MYC and PI3K pathways. The 5-year disease-free survival of CL cases (67%) and the rate of pathological complete response (pCR) to primary chemotherapy (32%) are close to those of poor-prognosis and good responder subtypes (basal and ERBB2-enriched). However, the prognostic features of CL tumors are closer to those observed in the whole BC series and in the luminal A subtype, including proliferation-related gene expression signatures (GES). Immunity-related GES valuable in basal breast cancers are not significant in CL tumors. By contrast, the GES predictive for pCR in CL tumors resemble more to those of basal and HER2-enriched tumors than to those of luminal A tumors.
Conclusions: Many differences exist between CL and the other subtypes, notably basal. An unexpected finding concerns the relatively high numbers of ER-positive and non-TN tumors within CL subtype, suggesting a larger heterogeneity than in basal and luminal A subtypes.
Keywords: Breast cancer, Claudin-low, Molecular profiling, Prognosis, Response to chemotherapy Background
Breast cancer (BC) is a heterogeneous disease with several classification systems [1]. Molecular classification, based on gene expression profiling, has been a major im-provement of BC approach for a decade [2,3], with the description of five major subtypes associated with different
molecular alterations and distinct clinical outcome including therapeutic response: luminal A, luminal B, ERBB2-enriched, basal and normal-like [2,4].
Following this discovery, additional subgroups of BC were identified such as the interferon-enriched [5] and the molecular apocrine [6] subgroups and several subgroups of triple-negative BCs [7]. In 2007, a new intrinsic subtype was described, the claudin-low subtype (CL), through the combined analysis of murine mammary carcinoma models and human BCs [8]. This subtype represented 6% of the BC samples analyzed (13/232). Surprisingly, since then,
* Correspondence:bertuccif@ipc.unicancer.fr
1
Department of Molecular Oncology, Centre de Recherche en Cancérologie de Marseille, UMR1068 Inserm, Institut Paoli-Calmettes (IPC), Marseille, France
2
Department of Medical Oncology, Institut Paoli-Calmettes (IPC), Marseille, France
Full list of author information is available at the end of the article
© 2014 Sabatier et al.; licensee BioMed Central Ltd. This is an Open Access article distributed under the terms of the Creative Commons Attribution License (http://creativecommons.org/licenses/by/4.0), which permits unrestricted use, distribution, and reproduction in any medium, provided the original work is properly credited. The Creative Commons Public Domain Dedication waiver (http://creativecommons.org/publicdomain/zero/1.0/) applies to the data made available in this article, unless otherwise stated.
only one study focused on the phenotypic and molecular characterization of CL BCs in a series of 76 and 32 cases, respectively [9]. CL tumors lacked tight junction proteins including claudin 3 and E-cadherin, and were character-ized by a low expression of luminal markers and a high expression of mesenchymal markers. Enriched in gene expression signatures (GES) derived from human tumor-initiating cells (TICs) and mammary stem cells [8], CL tumors displayed the least differentiated phenotype along the mammary epithelial differentiation hierarchy [9] and were frequent in the residual mammary tumor tissue after either hormone therapy or chemotherapy [10]. Today, with less than 90 samples characterized, the CL subtype is the least characterized subtype in the literature.
We analyzed more than 30 data sets containing almost 5500 clinically annotated BCs profiled using whole-genome DNA microarrays and identified 673 CL samples. We provide here a comprehensive characterization of CL BCs at multiple levels: clinicopathological, genomic (DNA copy number and mutations), transcriptional, survival, response to chemotherapy, and analysis of prognostic and predictive parameters.
Methods
Selection of the patients
We collected 32 retrospective data sets of BC samples profiled using oligonucleotide microarrays (Additional file 1: Table S1), including our own set (IPC set) and 31 public sets [3,6,9,11-39]. Regarding our own set, each patient had given written informed consent and the study had been approved by our institutional ethics committee. Gene expression and clinicopathological data of public series were retrieved from NCBI GEO and Array Express databases and authors’ websites. The 32 data sets included a total of 5447 pre-treatment samples of invasive adenocarcinoma.
Gene expression data pre-processing
Before analysis, we mapped hybridization probes across the two technological oligonucleotide-based platforms (Agilent and Affymetrix) used in these series. Affymetrix gene chips annotations were updated using NetAffx Anno-tation files (www.affymetrix.com; release from 01/12/2008). Agilent gene chips annotations were retrieved and updated using both SOURCE (http://smd.stanford.edu/cgi-bin/ source/sourceSearch) and EntrezGene (Homo sapiens gene information db, release from 09/12/2008, http:// www.ncbi.nlm.nih.gov/gene/). All probes were thus mapped based on their EntrezGeneID. When multiple probes were mapped to the same GeneID, the one with the highest variance in a particular dataset was selected to represent the GeneID.
Data sets were then processed separately as follows. For the Agilent-based sets, we applied quantile normalization
to available processed data. For the Affymetrix-based data sets, we used Robust Multichip Average (RMA) [40] with the non-parametric quantile algorithm as normalization parameter. RMA was applied to the raw data from the other series and the IPC series. Quantile normalization or RMA was done in R using Bioconductor and associated packages.
Gene expression data analysis
To avoid biases related to immunohistochemistry (IHC) analyses across different institutions and to increase the amount of available data, estrogen receptor (ER), proges-terone receptor (PR) and ERBB2 expression analyses were done at the mRNA level using gene expression data of their respective gene, ESR1, PGR and ERBB2. Because ESR1, PGR and ERBB2 expression profiles had bimodal distribution, we identified a threshold of positivity, com-mon to all sets, for each of these genes. Cases with gene expression higher than this threshold were classified as positive; the others were classified as negative [7].
Within each data set separately, the molecular subtypes related to the intrinsic BC classification were determined using the PAM50 classifier [41]. We first identified the genes common between the 50-gene classifier and each expression data set. Next, we used the expression centroid of each subtype as defined by Parker and colleagues [41] and measured the correlation of each sample with each centroid. The sample was attributed the subtype corre-sponding to the nearest centroid. To be comparable across data sets and to exclude biases resulting from population heterogeneity, expression data were standardized within each data set. To identify CL samples, we used the method described by Prat and colleagues [9]. Briefly, we used the 808 genes from the nine-cell line CL predictor to define the previously described “CL centroid” and “non-CL centroid”, then calculated the Euclidean dis-tance between each sample and each centroid, and assigned the class of the nearest centroid. For non-CL cases, we kept the subtype defined by the PAM50 classi-fier. To compare the molecular characteristics of CL BCs to those of the other subtypes, we used metagenes and gene signatures associated with different biological processes and pathways. We compared their expression in CL tumors to that in the five other molecular subtypes. We first developed, using an unsupervised approach, two metagenes associated with the luminal and proliferation patterns. They were established from the luminal and pro-liferation gene clusters identified in the whole-genome hierarchical clustering of 353 IPC samples: genes belong-ing to these clusters had a correlation rate above 0.75 and the two metagenes corresponded to the mean expression of all genes included in each cluster. We also studied metagenes associated with different immune popula-tions [42]. Epithelial-to-mesenchymal transition (EMT)
was analyzed with a core-EMT GES [43] from which we developed a core-EMT metagene defined as the Taube’s Up/Down metagenes ratio. We also focused on previously published GES of pathway activity [44]. Finally, because CL BCs were described as having stem cell features, we applied a differentiation predictor [9] derived from the gene expression profiles of three mammary cell popu-lations: mammary stem cells, luminal progenitors and mature luminal cells [10,45]
We also tested the prognostic value of previously re-ported classifiers associated with survival in BC: the 70-gene GES [11], the Genomic Grade Index (GGI) [14], the Recurrence Score (RS) [46], the Risk of Relapse (ROR) score [41], and the stroma-derived GES (B-cell cluster) [47]. We also looked at the prognostic value of signatures identified in ER-negative, triple negative or basal BCs: the kinase immune metagene [48], the LCK metagene [49], the immune response metagene [50]. Out of these 8 prognosis signatures, 4 are rather related to cell proliferation [11,14,41,46] and 4 to immunity [47-50]. Fi-nally, we tested the predictive value of 4 multigene signa-tures associated with pathological complete response (pCR) after primary chemotherapy in BC: Diagonal Linear Discriminant Analysis–30 predictor (DLDA30) [18], A-score [21], stromal metagene [51], and RB-loss signature [52].
Array-comparative genomic hybridization
We compared the genomic profile of CL tumors with that of the other molecular subtypes by analyzing our array-comparative genomic hybridization (aCGH) data-base containing 256 BCs [53]. Data had been generated by array-comparative genomic hybridization (aCGH) using 244 K CGH Microarrays (Hu-244A, Agilent Tech-nologies). Data analysis was done as previously described [53]. Extraction of data (log2 ratio) was done from CGH Analytics, whereas normalized and filtered log2 ratio was obtained from “Feature Extraction” software (Agilent Technologies). Frequencies of copy number alterations of CL tumors were compared to that of all other breast tumors using Fisher’s exact test with a 5% level of significance. To identify chromosomal regions with a statistically high frequency of copy number alterations (CNAs), we used the GISTIC algorithm [54]. The altered genes were compared to those described in CL cases from a mouse model of P53null tumors [55]. We also determined the genomic patterns of tumors using Hicks’ classification [56].
Statistical analysis
Correlations between sample groups and clinicopathologi-cal features were clinicopathologi-calculated with the Fisher’s exact test or the Student’s t-test when appropriate. Disease-free survival (DFS) was calculated from the date of diagnosis to the
date of first event (loco-regional or metastatic relapse, death), and follow-up was measured to the date of last news for event-free patients. Breast cancer patients with metastasis at diagnosis were excluded from DFS analysis. Survival curves were obtained using the Kaplan-Meier method and compared with the log-rank test. Prognostic analyses used the Cox regression method. Univariate analyses tested classical clinicopathological features: age, pathological tumor size (pT≤ 20 mm vs >20), axillary lymph node involvement (pN positive vs negative), SBR grade (1 vs 2–3), ESR1, PGR and ERBB2 status (negative versus positive), triple-negative status (yes versus no), and pathological subtype. We also analyzed the pathological response after neoadjuvant treatment which was available in 6 public sets [18,19,23,25,34,39]. All statistical tests were two-sided at the 5% level of significance. Analyses were done using the survival package (version 2.30), in the R software (version 2.15.2). Our analysis adhered to the REporting recommendations for tumor MARKer prog-nostic studies (REMARK) [57]. A Sweave report describ-ing the analysis of gene expression data and the associated statistical analysis has been generated and is available as Additional file 2.
Results
Molecular subtypes
We collected public gene expression and clinicopatho-logical data of a total of 5447 distinct invasive breast carcinomas. We determined the molecular subtype of tumors in each data set separately by using the PAM50 classifier [41] and the claudin-low predictor [9]: 1494 samples were luminal A (27.4%), 1077 (19.8%) were lu-minal B, 749 (13.8%) were ERBB2-enriched, 1003 (18.4%) were basal, 451 (8.2%) normal-like, and 673 (12.4%) were CL. Seventy-eight percent of CL cases identified were ini-tially attributed by the PAM50 classifier to the basal (53%) and normal-like (25%) subtypes. Only 11% were luminal A, 7% ERBB2-enriched and 4% luminal B.
For validation of the claudin-low predictor that we applied, we compared our findings with those described by Prat and colleagues in three data sets common with ours [9,11,18] and found 98.5% of concordant classifi-cation (Cl vs non-CL) out of the 337 tested samples (332 samples accurately classified), with a specificity of our predictor equal to 100% (all 32 CL samples according to our predictor were CL according to Prat’s predictor) and a sensitivity equal to 86% (5 out of 305 non-CL samples according to our predictor were CL according to Prat’s predictor).
Clinicopathological characteristics
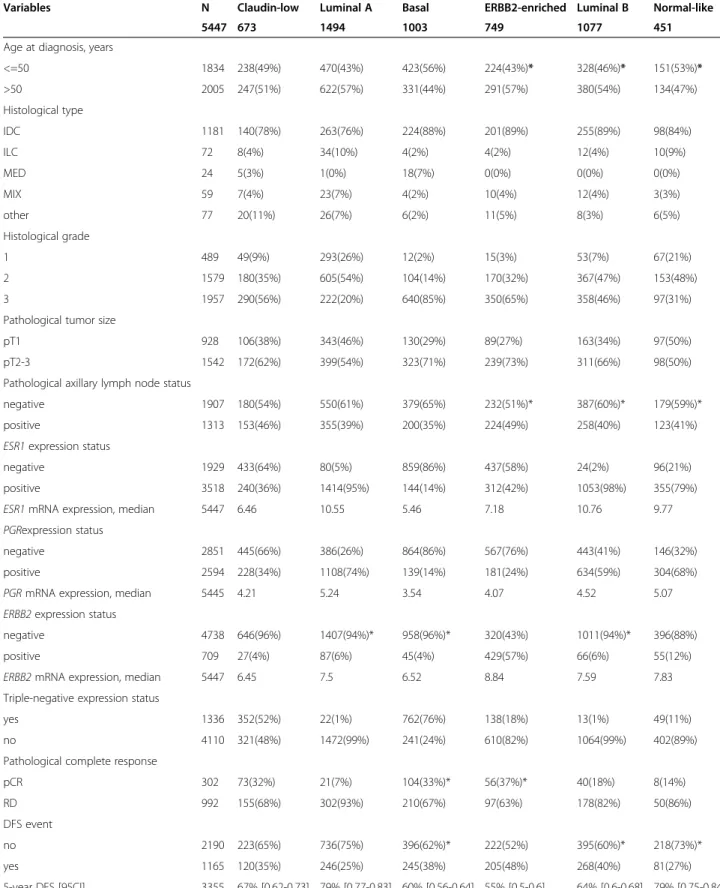
Results, both descriptive and comparative, are shown in Table 1. Each variable was compared between the CL subtype and each of the other subtypes. Forty-nine
Table 1 Clinicopathological characteristics of invasive breast cancers according to the molecular subtypes
Variables N Claudin-low Luminal A Basal ERBB2-enriched Luminal B Normal-like 5447 673 1494 1003 749 1077 451 Age at diagnosis, years
<=50 1834 238(49%) 470(43%) 423(56%) 224(43%)* 328(46%)* 151(53%)* >50 2005 247(51%) 622(57%) 331(44%) 291(57%) 380(54%) 134(47%) Histological type IDC 1181 140(78%) 263(76%) 224(88%) 201(89%) 255(89%) 98(84%) ILC 72 8(4%) 34(10%) 4(2%) 4(2%) 12(4%) 10(9%) MED 24 5(3%) 1(0%) 18(7%) 0(0%) 0(0%) 0(0%) MIX 59 7(4%) 23(7%) 4(2%) 10(4%) 12(4%) 3(3%) other 77 20(11%) 26(7%) 6(2%) 11(5%) 8(3%) 6(5%) Histological grade 1 489 49(9%) 293(26%) 12(2%) 15(3%) 53(7%) 67(21%) 2 1579 180(35%) 605(54%) 104(14%) 170(32%) 367(47%) 153(48%) 3 1957 290(56%) 222(20%) 640(85%) 350(65%) 358(46%) 97(31%) Pathological tumor size
pT1 928 106(38%) 343(46%) 130(29%) 89(27%) 163(34%) 97(50%) pT2-3 1542 172(62%) 399(54%) 323(71%) 239(73%) 311(66%) 98(50%) Pathological axillary lymph node status
negative 1907 180(54%) 550(61%) 379(65%) 232(51%)* 387(60%)* 179(59%)* positive 1313 153(46%) 355(39%) 200(35%) 224(49%) 258(40%) 123(41%) ESR1 expression status
negative 1929 433(64%) 80(5%) 859(86%) 437(58%) 24(2%) 96(21%) positive 3518 240(36%) 1414(95%) 144(14%) 312(42%) 1053(98%) 355(79%) ESR1 mRNA expression, median 5447 6.46 10.55 5.46 7.18 10.76 9.77 PGRexpression status
negative 2851 445(66%) 386(26%) 864(86%) 567(76%) 443(41%) 146(32%) positive 2594 228(34%) 1108(74%) 139(14%) 181(24%) 634(59%) 304(68%) PGR mRNA expression, median 5445 4.21 5.24 3.54 4.07 4.52 5.07 ERBB2 expression status
negative 4738 646(96%) 1407(94%)* 958(96%)* 320(43%) 1011(94%)* 396(88%) positive 709 27(4%) 87(6%) 45(4%) 429(57%) 66(6%) 55(12%) ERBB2 mRNA expression, median 5447 6.45 7.5 6.52 8.84 7.59 7.83 Triple-negative expression status
yes 1336 352(52%) 22(1%) 762(76%) 138(18%) 13(1%) 49(11%) no 4110 321(48%) 1472(99%) 241(24%) 610(82%) 1064(99%) 402(89%) Pathological complete response
pCR 302 73(32%) 21(7%) 104(33%)* 56(37%)* 40(18%) 8(14%) RD 992 155(68%) 302(93%) 210(67%) 97(63%) 178(82%) 50(86%) DFS event no 2190 223(65%) 736(75%) 396(62%)* 222(52%) 395(60%)* 218(73%)* yes 1165 120(35%) 246(25%) 245(38%) 205(48%) 268(40%) 81(27%) 5-year DFS [95CI] 3355 67% [0.62-0.73] 79% [0.77-0.83] 60% [0.56-0.64] 55% [0.5-0.6] 64% [0.6-0.68] 79% [0.75-0.84]
IDC: invasive ductal carcinoma; ILC: invasise lobular carcinoma; MED: medullary carcinoma; MIX: mixed; pCR: pathological complete response; RD: residual disease; DFS: disease-free survival; OR: odd ratio; 95CI: 95% confidence interval.
percent of patients with CL tumor were 50-year old or younger. Patients with CL tumor were younger than those with luminal A, ERBB2-enriched or luminal B tumors, and older than patients with basal tumors. Most CL cases were ductal carcinomas (78%). Other histological types included lobular carcinomas (4%), carcinomas of mixed histology (4%), and medullary carcinoma (3%). As ex-pected, most of the metaplastic carcinomas were CL (5 out of 7: 71%). Histological grade of CL tumors was often high (grade 3: 56%) or intermediate (grade 2: 35%), with grade 1 observed in only 9% of cases. Differences with the other subtypes were very significant with the basal subtype, which contained more grade 3 samples, and with the luminal A subtype, which contained less grade 3, and significant but to a lesser extent with the three other subtypes (intermediate between ERBB2-enriched and luminal B subtypes).
Thirty-eight percent of CL tumors measured 2 cm or less (pT1), a percentage intermediate between that of highly proliferative subtypes (basal, ERBB2-enriched, and luminal B) and that of less proliferative ones (luminal A and normal-like). Forty-six percent of CL samples pre-sented pathological axillary lymph node involvement at diagnosis. This ratio was significantly lower in basal (35%) and luminal A (40%) samples. Most tumors (77%) with lymph node involvement were larger than 2 cm. However, the positive correlation between pT (pT1 vs pT2-3) and the axillary lymph node status (negative vs positive) was weaker in CL tumors (OR = 2.58) and basal tumors (OR = 2.20) than in luminal A (OR = 3.60) or normal-like (OR = 6.69) tumors.
Sixty-four percent and 66% of CL samples were classified as negative for ESR1 and PGR respectively. As expected, differences were highly significant when compared with the two luminal and the normal-like subtypes, which were much more frequently positive for ESR1 and PGR. A small difference was observed with the ERBB2-enriched subtype. More unexpected was the strong difference observed with the basal subtype, which contained many more tumors negative for ESR1 and PGR. Ninety-six percent of CL tu-mors were negative for ERBB2, representing the highest percentage among all subtypes. The difference was not significant with the basal subtype, but significant with the ERBB2-enriched and normal-like subtypes. Fifty-two percent of CL tumors were triple negative (TN), sig-nificantly less than basal tumors (76%) and more than ERBB2-enriched samples (18%) and luminal A and B samples (1% each). Twenty-seven percent of TN breast cancers (TNBC) belonged to the CL subtype.
DNA copy number profiles
Most of the 28 CL samples profiled using aCGH displayed several gains and losses suggesting a high genomic in-stability. Because basal tumors are also known to be highly
instable, we compared their genomic profile to those of CL samples: no difference could be observed with many gains and losses in both subtypes (Figure 1A). In the same way, supervised analysis of CNAs between CL and non-CL samples did not find any genomic region specifically gained or lost in CL tumors. To identify the most gained or lost regions, we used the GISTIC algorithm. Out of the 10 most gained regions we found 7p11.2 including EGFR, 17q12 (ERBB2), 17q21.32 (HOXB family), 4q13.3 (CXCL2, 3, 5 and 6), 11q13-q14 (PAK1) and 17q21.33 (MYST2, PDK2). Some of the most lost regions were 8p23-p12 (DOK2, FGFR1), 4p16.3 (SPON2, FGFRL1), 17q21.2-q21.31 (STAT3) and 17p13.1-p12 (TP53, MAP2K4). Except TP53, none of these genes were identified in aCGH analyses performed on P53 null mice tumors [55].
Breast cancers can be classified in three classes accord-ing to their genomic patterns [56]. Usaccord-ing this classifica-tion, we observed 29%, 21% and 50% of simplex, firestorm and sawtooth CL tumors, respectively. By comparing the genomic patterns between molecular subtypes, we found that CL samples displayed the smallest percentage of firestorm profiles, the largest percentage of sawtooth profiles, and a percentage of simplex profiles inter-mediate between that of non-aggressive (luminal A and normal-like) and aggressive (basal, ERBB2-enriched and lu-minal B) subtypes. Based on these percentages, CL tumors were different from ERBB2-enriched tumors (p = 4.45 E-04, Fisher’s exact test) and luminal B tumors (p = 1.34 E-03) with more complex sawtooth tumors (Additional file 3: Table S2), whereas they were not different from basal BCs (p = 0.24; Figure 1B).
Transcriptional profiles
We compared the mRNA expression of different genes and pathways in CL versus other subtypes. As expected, CL tumors showed low expression of ESR1, PGR and ERBB2 genes (Table 1) and low expression of associated genes as demonstrated by the low expression of the lu-minal metagene (Figure 2) and the ER, PR and ERBB2 ac-tivation pathways signatures (Additional file 4: Figure S1). Regarding these genes and signatures, significant dif-ferences existed between CL and the other subtypes, including the basal subtype. CL BCs also differed from basal BCs in other aspects. Expression of the proliferation-related metagene in CL tumors was lower than in basal tumors, but higher than in luminal A and normal-like tumors (Figure 2 and Additional file 5: Table S3). CL tumors displayed lower expression of MYC, PI3K, and β-catenin activation pathways when compared to basal cases, with activity levels close to those of luminal A tumors for MYC and PI3K (Additional file 4: Figure S1). By contrast, they showed higher expression than basal tu-mors of EGFR, SRC, TGFβ and STAT3 activation pathways. We also analyzed the expression of immune response GES
[42]. CL tumors overexpressed T-cells, B-cells and gran-ulocytes metagenes as compared to the other subtypes (Figure 2). They also highly expressed the IFNγ activa-tion pathway with similar level than that of basal cases (Additional file 4: Figure S1).
We then focused on the expression of genes associated with epithelial-to-mesenchymal transition (EMT). As shown in Additional file 6: Figure S2, CL tumors dis-played the lowest expression of genes coding for epi-thelial cell-cell adhesion molecules (CDH1, claudin 3, claudin 4, claudin 7 and occludin) and the highest ex-pression of vimentin, SNAI1 and 2, TWIST1 and 2, and ZEB1 and 2, known to be transcriptional repressors of CDH1. This EMT pattern was confirmed using a GES associated with EMT [43]: CL tumors had the highest expression of the core-EMT metagene when compared to the other subtypes (Figure 2).
Following the hypothesis that the molecular subtypes are emerging at different stages of mammary cell differ-entiation [45], we evaluated the differdiffer-entiation degree of
CL tumors. Using a previously published differentiation score [9], we observed that most of the CL cases (96%) presented a score between those of mammary stem cells and those of luminal progenitors (Figure 2). Only 4% had a score close to those of mature luminal cells. This pattern of differentiation was similar, although lightly inferior, in basal tumors (92% between mammary stem cells and luminal progenitors) and very different in the other subtypes. Only 35% of ERBB2-enriched and nearly 15% of luminal samples had a low differentiation score close the stem cell profile.
We then classified all samples according to a GES of breast cancer stem cells (CD44+/CD24-/low -mammo-spheres-forming cells) [10]. CL tumors were strongly associated with the signature (Figure 2), suggesting enrich-ment in stem cell features. Similarly, the expression of gene markers of tumor-initiating cells (ALDH1A1, CD29, INPP5D) was different between the CL subtype and the other subtypes, including the basal subtype (data not shown).
A
B
Complex firestorm Complex sawtooth Simplex 39% 36% 25% 21% 50% 29% p=0.24 Claudin-low Basal Not significant Basal Claudin-low Frequency (%) F requency (%) 1 3 5 7 9 11 13 15 17 19 21 2 4 6 8 10 12 14 16 18 20 22 p-v alue (-log10, FDR) Chromosomes P <0.05 Chromosomes Claudin-lowvs. Basal 100 50 0 50 100 100 50 0 50 100 2.0 1.5 1.0 0.5 0.0Figure 1 Comparative genomic analysis of claudin-low and basal breast cancers. A) Frequency plots of DNA copy number alterations in claudin-low samples (N = 28) and basal samples (N = 61). Frequencies (vertical axis, from 0 to 100%) are plotted as a function of chromosome location (from 1pter on the left to 22qter on the right). Vertical lines indicate chromosome boundaries. Positive and negative values indicate frequencies of tumors showing copy number increase and decrease, respectively, with gains (in red), amplifications (dark red), losses (in green) and deletions (dark green). Bottom: supervised analysis comparing the genomic profiles of CL versus basal cases. The difference was assessed with the Fisher’s exact test. The blue line indicates the limit of significance (p = 0.05). B) Genomic patterns of CL and basal tumors using Hicks’ classification [56]. The difference between the subtypes was assessed with the Pearson's Chi-squared test.
Disease-free survival and prognostic features
Clinical outcome was available for 3682 out of 5447 patients with 5-year DFS rate equal to 67% (CI95, 66–69), including 343 out of 673 with CL BC. In the CL subtype, the median follow-up was 72 months for the 251 event-free patients. A total of 130 patients (34%) displayed a DFS event. Similarly to the basal subtype (and differently from the luminal A subtype), most of the relapses oc-curred in the first three years (Figure 3A), with median times to relapse of 19 months and 17 months for CL and basal tumors, respectively. The 5-year DFS rate was 67% (CI95, 62–73; N = 343) in the CL subtype (Figure 3B), intermediate between that observed in ERBB2-enriched BC patients (55% 5-year DFS, p = 2.3 E-03, log-rank test; N = 426) and luminal A BC patients (79% 5-year DFS, p = 6.7 E-07, log-rank test; N = 982) and normal-like BC patients (79% 5-year DFS, p = 4.7 E-04, log-rank test; N = 299). The prognosis of CL cases was not different from that of luminal B samples (64% 5-year DFS; p = 0.56, log-rank test; N = 663), and was better although not significantly different from that of basal tumors (60% 5-year DFS rate; p = 0.11, log-rank test; N = 641). Unfortu-nately, the site of first metastatic relapse was not informed in most of the cases studied.
We then performed prognostic analyses in the CL subtype by assessing the prognostic impact of the usual clinicopathological features. In univariate analysis, the well-known unfavorable clinicopathological features (pT > 2 cm, grade 2–3, pN-positive, low ESR1 expression,
Figure 2 Comparison of gene expression signatures across molecular subtypes. Box plots of expression metagenes and scores across molecular subtypes: luminal, proliferation, immune, and core-EMT metagenes, differentiation score (mL, mature luminal; pL, porogenitor luminal; MaSC, mammary stem cells), stem cells score. P-values (t-test) of comparisons between CL and each of the other subtypes are shown as follows: *,≤5%; **, ≤1%; ***, ≤0.1%. p=0.11 Basal (N=641) Claudin-low (N=343) Luminal A (N=982) Luminal B (N=663) ERBB2-enriched (N=426) Normal-like (N=299)
A
B
0 50 100 150 200 250 0 5 10 15 R e lap se fr equency (%) Basal (N=641) Claudin-low (N=343) Luminal A (N=982)Time from diagnosis (months) Time from diagnosis (months)
Disease-fr ee surviv al 1.0 0.8 0.6 0.4 0.2 0.0 0 20 40 60 80 100 120
Figure 3 DFS according to molecular subtypes. A) Frequencies of relapses according to time from diagnosis between luminal A, basal and CL breast cancers. B) Kaplan-Meier DFS curves in the 6 subtypes (p-value for comparison between CL and basal tumors is shown, log-rank test).
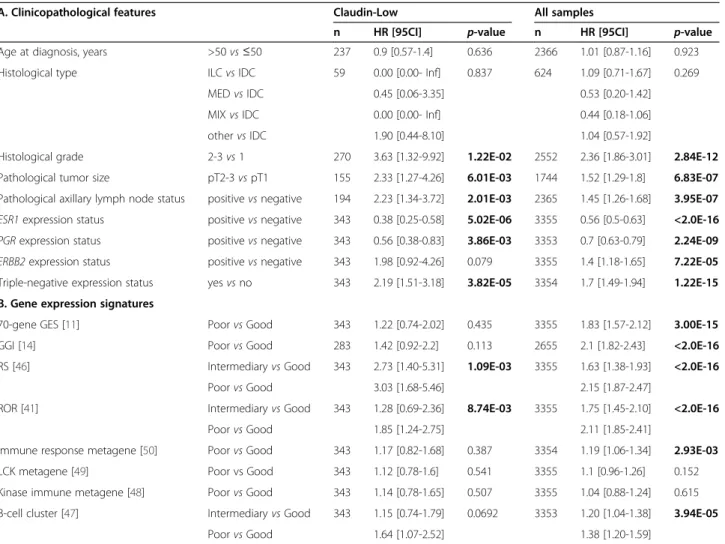
low PGR expression, and ERBB2 overexpression) were associated with shorter DFS in patients with CL tumor (Table 2). Comparison with the results observed in the whole BC series and in each of the other subtype (Additional file 7: Table S4) revealed that the prognostic features were the same in the CL subtype and in the whole series, totally different between the CL and the other pro-liferative subtypes (basal, ERBB2-enriched and luminal B). The largest similarity was observed with the luminal A subtype.
We also compared the prognostic value of 8 prognostic GES in the different subtypes (Table 2 and Additional file 7: Table S4). Whereas 6 signatures (4 proliferation-related and 2 immunity-proliferation-related) showed prognostic value in the whole series of samples, only two conserved their prognostic value in CL tumors (Table 2): the RS (HR = 3 when comparing high risk to low risk cases, p = 1.1 E-03) and the ROR (HR = 1.85, p = 8.7E-04). There was a trend for the B-cell cluster (HR = 1.6 when comparing poor vs good-prognosis groups cases, p = 0.07). The 2 other
proliferation-related signatures (70-gene GES and GGI) and the 3 other immunity-related signatures (immune response, LCK, and kinase immune metagenes) had no prognostic value in the CL population. By contrast, the results were very different in the other subtypes (Additional file 7: Table S4). For example, most of the immunity-related signatures were significant in the basal and ERBB2-enriched subtypes, whereas none of the proliferation-related classifiers had a prognostic value in this population in contrast with the luminal A subtype. Results were also different in the luminal B subtype, where 3 proliferation-related and 2 immunity-related signatures showed prognostic value. Altogether, these results suggest that CL tumors have different prog-nostic features than the other subtypes.
Pathological response to chemotherapy and predictive features
Pathological response to neoadjuvant chemotherapy was available for 1294 patients out of 5447 patients with a
Table 2 Univariate Cox regression analysis for DFS
A. Clinicopathological features Claudin-Low All samples
n HR [95CI] p-value n HR [95CI] p-value Age at diagnosis, years >50 vs≤50 237 0.9 [0.57-1.4] 0.636 2366 1.01 [0.87-1.16] 0.923 Histological type ILC vs IDC 59 0.00 [0.00- Inf] 0.837 624 1.09 [0.71-1.67] 0.269
MED vs IDC 0.45 [0.06-3.35] 0.53 [0.20-1.42] MIX vs IDC 0.00 [0.00- Inf] 0.44 [0.18-1.06] other vs IDC 1.90 [0.44-8.10] 1.04 [0.57-1.92]
Histological grade 2-3 vs 1 270 3.63 [1.32-9.92] 1.22E-02 2552 2.36 [1.86-3.01] 2.84E-12 Pathological tumor size pT2-3 vs pT1 155 2.33 [1.27-4.26] 6.01E-03 1744 1.52 [1.29-1.8] 6.83E-07 Pathological axillary lymph node status positive vs negative 194 2.23 [1.34-3.72] 2.01E-03 2365 1.45 [1.26-1.68] 3.95E-07 ESR1 expression status positive vs negative 343 0.38 [0.25-0.58] 5.02E-06 3355 0.56 [0.5-0.63] <2.0E-16 PGR expression status positive vs negative 343 0.56 [0.38-0.83] 3.86E-03 3353 0.7 [0.63-0.79] 2.24E-09 ERBB2 expression status positive vs negative 343 1.98 [0.92-4.26] 0.079 3355 1.4 [1.18-1.65] 7.22E-05 Triple-negative expression status yes vs no 343 2.19 [1.51-3.18] 3.82E-05 3354 1.7 [1.49-1.94] 1.22E-15 B. Gene expression signatures
70-gene GES [11] Poor vs Good 343 1.22 [0.74-2.02] 0.435 3355 1.83 [1.57-2.12] 3.00E-15 GGI [14] Poor vs Good 283 1.42 [0.92-2.2] 0.113 2655 2.1 [1.82-2.43] <2.0E-16 RS [46] Intermediary vs Good 343 2.73 [1.40-5.31] 1.09E-03 3355 1.63 [1.38-1.93] <2.0E-16
Poor vs Good 3.03 [1.68-5.46] 2.15 [1.87-2.47]
ROR [41] Intermediary vs Good 343 1.28 [0.69-2.36] 8.74E-03 3355 1.75 [1.45-2.10] <2.0E-16 Poor vs Good 1.85 [1.24-2.75] 2.11 [1.85-2.41]
Immune response metagene [50] Poor vs Good 343 1.17 [0.82-1.68] 0.387 3354 1.19 [1.06-1.34] 2.93E-03 LCK metagene [49] Poor vs Good 343 1.12 [0.78-1.6] 0.541 3355 1.1 [0.96-1.26] 0.152 Kinase immune metagene [48] Poor vs Good 343 1.14 [0.78-1.65] 0.507 3355 1.04 [0.88-1.24] 0.615 B-cell cluster [47] Intermediary vs Good 343 1.15 [0.74-1.79] 0.0692 3353 1.20 [1.04-1.38] 3.94E-05
Poor vs Good 1.64 [1.07-2.52] 1.38 [1.20-1.59]
IDC: invasive ductal carcinoma; ILC: invasise lobular carcinoma; MED: medullary carcinoma; MIX: mixed; HR: hazard ratio; 95CI: 95% confidence interval. P-values < 0.05 are represented in boldface.
pCR rate equal to 23%. Among the 228 CL samples with data available, the pCR rate was 32% (Table 1), higher than in luminal A (7%, p < E-04, Fisher’s exact test; N = 323), lu-minal B (18%, p = 1.1 E-03; N = 218), and normal-like tu-mors (14%, p = 5.4 E-03; N = 58), and similar to the rate observed in basal (33%, p = 0.85; N = 314) and ERBB2-enriched cases (37%, p = 0.38; N = 153).
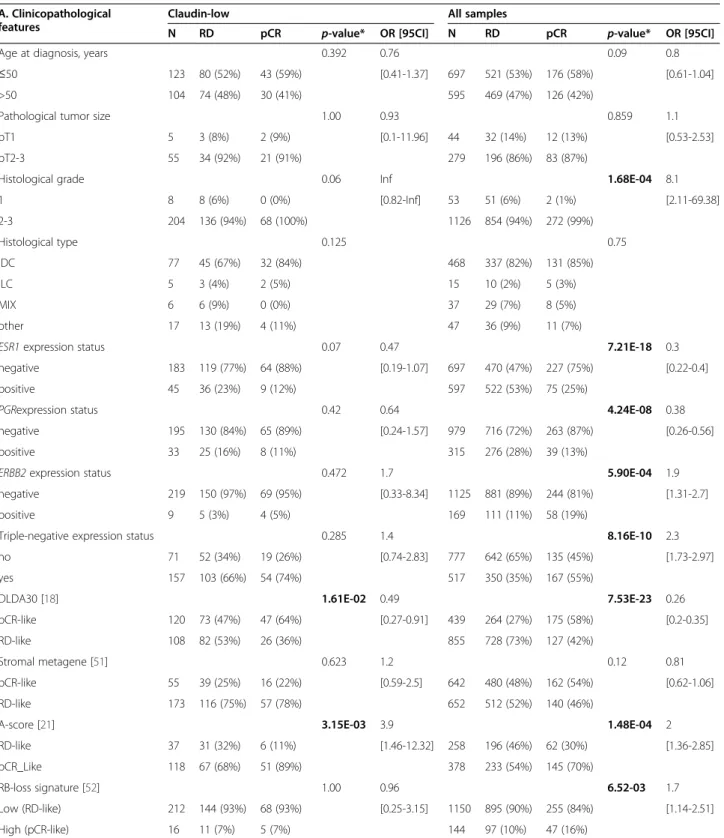
Analysis of predictive value of clinicopathological features in CL tumors (Table 3) showed that pCR rates tended to be higher in high grade tumors (p = 0.06, Fisher’s exact test) and in samples with low ESR1 expres-sion (p = 0.07). By contrast (Additional file 8: Table S5), ESR1 expression level did not tend to have predictive value in the basal and ERBB2-enriched subtypes. We also tested the predictive value of 4 GES published as predictive of pathological response in breast cancer treated by anthracycline-based chemotherapy. Only two were associated with pCR in CL tumors: the DLDA30 predictor (p = 1.6 E-02, Fisher’s exact test), and the A-score (p = 3.2 E-03), which also predicted pCR in the basal and ERBB2-enriched subtypes. By contrast, the stromal metagene and the RB-loss signature failed to predict pCR in CL tumors, whereas they pdicted pCR in basal and ERBB2-enriched cancers, re-spectively. Finally, 3 out of 4 signatures were associated with pCR in the whole series of 1294 samples.
Discussion
We provide a comprehensive characterization of a series of 673 CL BCs collected though a meta-analysis of public gene expression data. This represents the largest series reported so far in the literature, with nearly 9-fold more samples than in the pioneering study [9]. We de-fined the CL breast tumors using the published cell line-based CL predictor [9], which in our hands gave a very high degree of concordance (98.5%) with the predictor originally reported in a common set of 337 samples, suggesting that the CL subtype that we define here overlaps the CL subtype originally described. The sub-type of non-CL samples was defined using the classical PAM50 classifier [41]. Using these standard classifiers, we observed the expected incidence of each subtype. The incidence of CL tumors was 12.4%, similar to the 7 to 14% incidence reported by Prat and colleagues in 3 distinct small databases [9]. In our analysis, the PAM50 classifier attributed most of the current CL tumors to the basal and normal-like subtypes (53% and 25%, respect-ively) as previously described [9]. The large number of samples in each subtype provided an unprecedented op-portunity to describe the characteristics of CL tumors and to perform prognostic and predictive analyses specifically in this subtype, comparatively with the other subtypes. Also for the first time, we present genomic data of human CL tumors.
Only one published study [9] has described so far the clinicopathological characteristics of CL samples, but in-formation was relatively limited: pathological size, grade, axillary lymph node status and IHC ER status were avail-able for 76 cases, and PR and ERBB2 status for 55 cases. Our percentages of CL tumors with pT2-T3 size (62%), with pN- status (54%) and with grade 3 (56%) are close to those reported by Prat (65%, 47% and 62% respect-ively). Differences are more important and thus unex-pected regarding the hormone receptors and ERBB2 status. In Prat’s study, 79%, 77% and 84% of CL samples were IHC ER-negative (out of 71 informative samples tested at the protein level with IHC), PR-negative (out of 40 informative samples) and ERBB2-negative (out of 45 informative samples) respectively, versus 64%, 66% and 96% in our transcriptional analysis, respectively (Figure 4). Similarly, the percentage of IHC TN samples was 67% in Prat’s study (out of 39 informative samples) versus 52% in ours (out of 673 samples tested at the mRNA level with DNA microarrays). These discordances may be due to various reasons. The first one may be the difference of technology used to define the ER, PR, ERBB2 and TN status (IHC versus mRNA expression profile), even if differences are known to be limited [58]. Thanks to the simultaneous availability of IHC ER, PR and ERBB2 status for 2259 breast cancer samples of our pooled series, including 294 CL samples, we could redefine the TN status at the protein level as did Prat and colleagues. We found results similar or very close to those observed at the mRNA level in the whole series of 673 samples: 52% of CL samples were TN, 63% were ER-negative, 68% were PR-negative and 89% were ERBB2-negative, versus 52% 64%, 66% and 96% respectively in our tran-scriptional analysis. Of note, the results remained exactly the same after exclusion of the Prat’s samples. The second and likely main reason for discrepancy lies in the large quantitative difference in series analyzed: we defined the ER and TN status of CL samples in a series of 673 samples, whereas Prat et al. defined the ER status on three small series of 32 (UNC337), 21 samples (NKI295) and 18 samples (MDACC), and the TN status on two small series of 21 (UNC337) and 18 samples (MDACC) with relative large variations across series regarding the percentage of ER-negative cases (from 67 to 88%) and TN cases (from 61 to 71%). Prat and colleagues did not compare statistically the clinicopatho-logical features of the CL subtype with those of the other subtypes, likely because of the series size limitation. In our analysis, CL BCs displayed only one feature common with basal tumors (ERBB2 status), whereas differences were significant regarding all the other features: age at diagnosis (less young patients in CL cases), pathological type (less often ductal or medullary, but more often metaplastic in CL), grade (less often grade 3 in CL), tumor size (less
Table 3 Univariate Fisher’s exact test analysis for pathological complete response according to clinicopathological and molecular features
A. Clinicopathological features
Claudin-low All samples
N RD pCR p-value* OR [95CI] N RD pCR p-value* OR [95CI] Age at diagnosis, years 0.392 0.76 0.09 0.8 ≤50 123 80 (52%) 43 (59%) [0.41-1.37] 697 521 (53%) 176 (58%) [0.61-1.04] >50 104 74 (48%) 30 (41%) 595 469 (47%) 126 (42%)
Pathological tumor size 1.00 0.93 0.859 1.1 pT1 5 3 (8%) 2 (9%) [0.1-11.96] 44 32 (14%) 12 (13%) [0.53-2.53] pT2-3 55 34 (92%) 21 (91%) 279 196 (86%) 83 (87%)
Histological grade 0.06 Inf 1.68E-04 8.1 1 8 8 (6%) 0 (0%) [0.82-Inf] 53 51 (6%) 2 (1%) [2.11-69.38] 2-3 204 136 (94%) 68 (100%) 1126 854 (94%) 272 (99%) Histological type 0.125 0.75 IDC 77 45 (67%) 32 (84%) 468 337 (82%) 131 (85%) ILC 5 3 (4%) 2 (5%) 15 10 (2%) 5 (3%) MIX 6 6 (9%) 0 (0%) 37 29 (7%) 8 (5%) other 17 13 (19%) 4 (11%) 47 36 (9%) 11 (7%)
ESR1 expression status 0.07 0.47 7.21E-18 0.3 negative 183 119 (77%) 64 (88%) [0.19-1.07] 697 470 (47%) 227 (75%) [0.22-0.4] positive 45 36 (23%) 9 (12%) 597 522 (53%) 75 (25%)
PGRexpression status 0.42 0.64 4.24E-08 0.38 negative 195 130 (84%) 65 (89%) [0.24-1.57] 979 716 (72%) 263 (87%) [0.26-0.56] positive 33 25 (16%) 8 (11%) 315 276 (28%) 39 (13%)
ERBB2 expression status 0.472 1.7 5.90E-04 1.9 negative 219 150 (97%) 69 (95%) [0.33-8.34] 1125 881 (89%) 244 (81%) [1.31-2.7] positive 9 5 (3%) 4 (5%) 169 111 (11%) 58 (19%)
Triple-negative expression status 0.285 1.4 8.16E-10 2.3 no 71 52 (34%) 19 (26%) [0.74-2.83] 777 642 (65%) 135 (45%) [1.73-2.97] yes 157 103 (66%) 54 (74%) 517 350 (35%) 167 (55%)
DLDA30 [18] 1.61E-02 0.49 7.53E-23 0.26 pCR-like 120 73 (47%) 47 (64%) [0.27-0.91] 439 264 (27%) 175 (58%) [0.2-0.35] RD-like 108 82 (53%) 26 (36%) 855 728 (73%) 127 (42%)
Stromal metagene [51] 0.623 1.2 0.12 0.81 pCR-like 55 39 (25%) 16 (22%) [0.59-2.5] 642 480 (48%) 162 (54%) [0.62-1.06] RD-like 173 116 (75%) 57 (78%) 652 512 (52%) 140 (46%)
A-score [21] 3.15E-03 3.9 1.48E-04 2 RD-like 37 31 (32%) 6 (11%) [1.46-12.32] 258 196 (46%) 62 (30%) [1.36-2.85] pCR_Like 118 67 (68%) 51 (89%) 378 233 (54%) 145 (70%)
RB-loss signature [52] 1.00 0.96 6.52-03 1.7 Low (RD-like) 212 144 (93%) 68 (93%) [0.25-3.15] 1150 895 (90%) 255 (84%) [1.14-2.51] High (pCR-like) 16 11 (7%) 5 (7%) 144 97 (10%) 47 (16%)
*, Fisher’s exact test.
IDC: invasive ductal carcinoma; ILC: invasise lobular carcinoma; MIX: mixed; pCR: pathological complete response; RD: residual disease; OR: odds ratio; 95CI: 95% confidence interval.
often pT2-3 in CL), lymph node status (more often posi-tive in CL), ER and PR status (less often negaposi-tive in CL), and triple-negative status (less frequent in CL).
To our knowledge, the genomic profiles of CL tumors have been reported only in two studies that described the CNA patterns of a total of 5 CL murine p53-null tumors [8,55]. Based on the analysis of 28 samples, we showed that CL tumors have a high genomic instability with many gains and losses, frequent complex sawtooth patterns, and the smallest percentage of firestorm profiles. This profile is close to what has been already published concerning basal cases [53], and no significant difference could be identified with basal tumors. It is of note that the main regions we identified as gained or lost in CL samples were not described in genomic analyses of previously pub-lished murine models [55]. This suggests that, like for the basal subtype, CL tumorigenesis may be driven by several oncogenic events, and not by a single driver as it can be observed in ERBB2-enriched tumors [59].
At the transcriptional level, we found that the CL subtype differs from the other subtypes in many aspects (Figure 4). We confirmed that CL tumors lack luminal differentiation markers, and show enrichment for EMT markers, immune response genes, and cancer stem cell–like features. They also have a relative low expres-sion of the P53 pathway suggesting apoptosis inhib-ition. They differ from basal BC at several levels. Both have lower expression of ESR1, PGR, ERBB2 genes and ER, PR and ERBB2 activation pathways than the other subtypes, but the expression of ER and PR genes and pathways is higher in CL tumors than in basal tumors. CL BCs are also less proliferative than basal cancers. They overexpress genes associated with immune response and
stroma and have higher expression of EMT-related genes and signatures, thus confirming previous results. We also confirmed that CL tumors are the most undifferentiated ones at the molecular level along the normal mammary epithelial differentiation hierarchy (differentiation score close the stem cell profile) and are the most enriched in stem cell features, followed by basal tumors. CL and basal tumors are also distinguished by the expression of several pathway activation signatures; for examples, basal cancers displayed higher activity of MYC and PI3K pathways as already reported [60,61], whereas CL tumors showed higher activity of EGFR, SRC and TGFβ pathways as reported by others [7] with therapeutic possibilities.
Regarding prognosis, the DFS, available for 343 patients with CL BC, was poor with 67% 5-year DFS, close to that reported by Prat and colleagues in their 58-patients series [9]. Compared with the other subtypes, the 5-year DFS was inferior to that observed in the two good-prognosis subtypes (luminal A and normal-like), similar to that ob-served in the luminal B subtype, and tended to be better than that observed in the two other poor-prognosis sub-types (basal and ERBB2-enriched), even if the difference (7%) with basal tumors was not significant. The earlier timing of relapse compared with the luminal A subtype, similarly to that observed in the basal subtype, agreed with the proliferative nature of CL tumors. It is now recognized that the prognostic features are somewhat different be-tween the different subtypes [62,63]. This has never been explored to date in CL BCs. Most of the clinico-pathological prognostic variables tested in CL samples were significant (pT, grade, pN, ESR1 and PGR expres-sion), as observed in the whole series and the luminal A subtype. Unexpectedly, in term of prognostic features, the
A
B
Figure 4 Radar charts comparing clinicopathological, genomic and transcriptional features through the 6 main molecular subtypes. Each axis of the diagrams represents a scale of proportions for a specific feature, ranging from 0% to 100%. The proportion of a given feature in a given molecular subtype is reported on the corresponding axis. A) Clinicopathological features. B) Probabilities of pathway activation calculated according to [44].
subtype most different from CL was the basal subtype, and the most similar was the luminal A subtype, the less proliferative one. We also analyzed the prognostic value of 8 published signatures, 4 related to cell proliferation, known to be strongly prognostic in ER-positive samples, and 4 to immunity, known to be strongly prognostic in ER-negative samples. Similarly to the results observed with the clinicopathological variables, proliferation-related classifiers useful to predict luminal A tumors prognosis had (or tended to have) a prognostic value in CL samples, whereas immunity-related GES, described to be relevant in basal and HER2-enriched BCs, did not.
The profile of chemosensitivity of CL tumors was assessed in 228 cases. The pCR rate after neoadjuvant chemotherapy was close (32%) to that of basal (33%) and ERBB2-enriched tumors (37%), and significantly higher than the rates observed for luminal A (7%), luminal B (18%), and normal-like tumors (14%). Similar obser-vations have been reported by Prat and colleagues [9] in a smaller series of 133 samples including 18 CL, with higher pCR rates in the CL (39%), basal (79%) and ERBB2-enriched (39%) cases. As discussed above with the prognostic features, the clinicopathological features predictive for pCR in the CL subtype (grade and ESR1 status) were predictive in the whole series of samples and the luminal A subtype, but were not predictive in the ER-negative subtypes (basal and ERBB2-enriched). The predictive value of 4 previously published predictive GES was also different between CL and the other subtypes.
Conclusions
In conclusion, we revealed many differences between CL and the other molecular subtype of breast cancers, notably the basal subtype. Differences are present at all tested levels, including the molecular and clinicopathological characteristics, the clinical outcome and the prognostic features. The strength of our study lies in both its com-prehensiveness and the number of samples analyzed. Limitations are those of any retrospective multicenter study, including potential selection bias and the un-availability of certain clinicopathological variables. Our results suggest that CL tumors represent a different subtype. They also reveal some unexpected findings that warrant further study to better understand this yet mysterious subtype. The most important ones concern the relatively high numbers of ER-positive tumors and non-TN tumors within the CL subtype: 36% and 48% respectively versus only 14% and 24% in the basal sub-type and 95% and 99% in the luminal A subsub-type. This difference in a major feature of breast cancer (ER status) suggests that the so-defined CL subtype is much more heterogeneous than basal and luminal A subtypes. Such a mixture of ER-negative and ER-positive samples likely explains the intermediate/mixed pattern of CL subtype
between the basal and the luminal A subtypes in terms of clinicopathological and molecular characteristics, survival, prognostic features, and response to chemotherapy.
Additional files
Additional file 1: Table S1. Description of the 32 breast cancer data sets. Additional file 2: Sweave report of gene expression data and associated statistics.
Additional file 3: Table S2. Genomic patterns of the molecular subtypes using the Hicks’ classification [56].
Additional file 4: Figure S1. Comparison of probabilities of pathway activation across molecular subtypes. Box plots of probabilities of activation of 12 pathways from [44]. P-values (t-test) of comparisons between CL and each of the other subtypes are shown as follows: *,≤5%; **, ≤1%; ***, ≤0.1%.
Additional file 5: Table S3. Odd ratios and p-values of comparison of gene expression signatures across molecular subtypes.
Additional file 6: Figure S2. Comparison of mRNA expression levels of genes associated with EMT across molecular subtypes. Expression values are log2-scaled. P-values (t-test) of comparisons between CL and each of the other subtypes are shown as follows: *,≤5%; **, ≤1%; ***, ≤0.1%. Additional file 7: Table S4. Univariate Cox regression analysis for DFS in all subtypes.
Additional file 8: Table S5. Univariate analysis for pathological complete response according to clinicopathological and molecular features in all subtypes.
Abbreviations
CL:Claudin-low; BC: Breast cancer; EMT: Epithelial to mesenchymal transition; ER: Estrogen receptor; PR: Progesterone receptor; DFS: Disease-free survival; pCR: Pathological complete response; GES: Gene expression signature; TN: Triple-negative; RMA: Robust multichip average; IHC: Immunohistochemistry; IPC: Institut Paoli-Calmettes; GGI: Genomic grade index; RS: Recurrence score; ROR: Risk of relapse; DLDA-30: Diagonal Linear Discriminant Analysis–30; CGH: Comparative genomic hybridization; CNA: Copy number alterations.
Competing interests
The authors declare that they have no competing interests. Authors’ contributions
RS and FB designed the concept of the study. FB, RS and PV were responsible for provision of study patients. RS and PF were responsible for samples and data gathering, nucleic acids extraction and microarray experiments. JA, AG and MC were responsible for array-CGH experiments, and analysis. RS, PF and FB were responsible for statistical analysis and final interpretation. RS, FB and DB wrote the final manuscript. All authors read and approved the final manuscript.
Acknowledgements
Our work is supported by the Institut National du Cancer (INCa) Translational Research Grant 2007 (FB), Translational Research Grant 2009 (DB) and Biologic Research Grant 2010 « IVOIRES » (FB), the Ligue Nationale Contre le Cancer (label DB) and SIRIC (INCa-DGOS-Inserm 6038 grant).
Author details
1Department of Molecular Oncology, Centre de Recherche en Cancérologie
de Marseille, UMR1068 Inserm, Institut Paoli-Calmettes (IPC), Marseille, France.
2Department of Medical Oncology, Institut Paoli-Calmettes (IPC), Marseille,
France.3Faculté de Médecine, Université Aix-Marseille, Marseille, France.
Received: 8 April 2014 Accepted: 22 September 2014 Published: 2 October 2014
References
1. Viale G: The current state of breast cancer classification. Ann Oncol 2012, 23(Suppl 10):x207–x210.
2. Perou CM, Sørlie T, Eisen MB, van de Rijn M, Jeffrey SS, Rees CA, Pollack JR, Ross DT, Johnsen H, Akslen LA, Fluge O, Pergamenschikov A, Williams C, Zhu SX, Lønning PE, Børresen-Dale AL, Brown PO, Botstein D: Molecular portraits of human breast tumours. Nature 2000, 406:747–752. 3. Veer LJ V’t, Dai H, van de Vijver MJ, He YD, Hart AAM, Mao M, Peterse
HL, van der Kooy K, Marton MJ, Witteveen AT, Schreiber GJ, Kerkhoven RM, Roberts C, Linsley PS, Bernards R, Friend SH: Gene expression profiling predicts clinical outcome of breast cancer. Nature 2002, 415:530–536.
4. Sørlie T, Perou CM, Tibshirani R, Aas T, Geisler S, Johnsen H, Hastie T, Eisen MB, van de Rijn M, Jeffrey SS, Thorsen T, Quist H, Matese JC, Brown PO, Botstein D, Lønning PE, Børresen-Dale AL: Gene expression patterns of breast carcinomas distinguish tumor subclasses with clinical implications. Proc Natl Acad Sci U S A 2001, 98:10869–10874. 5. Hu Z, Fan C, Oh DS, Marron JS, He X, Qaqish BF, Livasy C, Carey LA,
Reynolds E, Dressler L, Nobel A, Parker J, Ewend MG, Sawyer LR, Wu J, Liu Y, Nanda R, Tretiakova M, Ruiz Orrico A, Dreher D, Palazzo JP, Perreard L, Nelson E, Mone M, Hansen H, Mullins M, Quackenbush JF, Ellis MJ, Olopade OI, Bernard PS, et al.: The molecular portraits of breast tumors are conserved across microarray platforms. BMC Genomics 2006, 7:96. 6. Farmer P, Bonnefoi H, Becette V, Tubiana-Hulin M, Fumoleau P, Larsimont D,
Macgrogan G, Bergh J, Cameron D, Goldstein D, Duss S, Nicoulaz A-L, Brisken C, Fiche M, Delorenzi M, Iggo R: Identification of molecular apocrine breast tumours by microarray analysis. Oncogene 2005, 24:4660–4671. 7. Lehmann BD, Bauer JA, Chen X, Sanders ME, Chakravarthy AB, Shyr Y, Pietenpol JA: Identification of human triple-negative breast cancer subtypes and preclinical models for selection of targeted therapies. J Clin Invest 2011, 121:2750–2767.
8. Herschkowitz JI, Simin K, Weigman VJ, Mikaelian I, Usary J, Hu Z, Rasmussen KE, Jones LP, Assefnia S, Chandrasekharan S, Backlund MG, Yin Y, Khramtsov AI, Bastein R, Quackenbush J, Glazer RI, Brown PH, Green JE, Kopelovich L, Furth PA, Palazzo JP, Olopade OI, Bernard PS, Churchill GA, Van Dyke T, Perou CM: Identification of conserved gene expression features between murine mammary carcinoma models and human breast tumors. Genome Biol 2007, 8:R76.
9. Prat A, Parker JS, Karginova O, Fan C, Livasy C, Herschkowitz JI, He X, Perou CM: Phenotypic and molecular characterization of the claudin-low intrinsic subtype of breast cancer. Breast Cancer Res 2010, 12:R68. 10. Creighton CJ, Li X, Landis M, Dixon JM, Neumeister VM, Sjolund A, Rimm
DL, Wong H, Rodriguez A, Herschkowitz JI, Fan C, Zhang X, He X, Pavlick A, Gutierrez MC, Renshaw L, Larionov AA, Faratian D, Hilsenbeck SG, Perou CM, Lewis MT, Rosen JM, Chang JC: Residual breast cancers after conventional therapy display mesenchymal as well as tumor-initiating features. Proc Natl Acad Sci U S A 2009, 106:13820–13825.
11. Van de Vijver MJ, He YD, van’t Veer LJ, Dai H, Hart AAM, Voskuil DW, Schreiber GJ, Peterse JL, Roberts C, Marton MJ, Parrish M, Atsma D, Witteveen A, Glas A, Delahaye L, van der Velde T, Bartelink H, Rodenhuis S, Rutgers ET, Friend SH, Bernards R: A gene-expression signature as a predictor of survival in breast cancer. N Engl J Med 2002, 347:1999–2009.
12. Schmidt M, Böhm D, von Törne C, Steiner E, Puhl A, Pilch H, Lehr H-A, Hengstler JG, Kölbl H, Gehrmann M: The humoral immune system has a key prognostic impact in node-negative breast cancer. Cancer Res 2008, 68:5405–5413.
13. Wang Y, Klijn JGM, Zhang Y, Sieuwerts AM, Look MP, Yang F, Talantov D, Timmermans M, Meijer-van Gelder ME, Yu J, Jatkoe T, Berns EMJJ, Atkins D, Foekens JA: Gene-expression profiles to predict distant metastasis of lymph-node-negative primary breast cancer. Lancet 2005, 365:671–679. 14. Sotiriou C, Wirapati P, Loi S, Harris A, Fox S, Smeds J, Nordgren H, Farmer P, Praz
V, Haibe-Kains B, Desmedt C, Larsimont D, Cardoso F, Peterse H, Nuyten D, Buyse M, Van de Vijver MJ, Bergh J, Piccart M, Delorenzi M: Gene
expression profiling in breast cancer: understanding the molecular basis of histologic grade to improve prognosis. J Natl Cancer Inst 2006, 98:262–272. 15. Ivshina AV, George J, Senko O, Mow B, Putti TC, Smeds J, Lindahl T, Pawitan
Y, Hall P, Nordgren H, Wong JEL, Liu ET, Bergh J, Kuznetsov VA, Miller LD: Genetic reclassification of histologic grade delineates new clinical subtypes of breast cancer. Cancer Res 2006, 66:10292–10301. 16. Desmedt C, Piette F, Loi S, Wang Y, Lallemand F, Haibe-Kains B, Viale G,
Delorenzi M, Zhang Y, d’ Assignies MS, Bergh J, Lidereau R, Ellis P, Harris AL,
Klijn JGM, Foekens JA, Cardoso F, Piccart MJ, Buyse M, Sotiriou C: Strong time dependence of the 76-gene prognostic signature for node-negative breast cancer patients in the TRANSBIG multicenter independent validation series. Clin Cancer Res 2007, 13:3207–3214.
17. Miller LD, Smeds J, George J, Vega VB, Vergara L, Ploner A, Pawitan Y, Hall P, Klaar S, Liu ET, Bergh J: An expression signature for p53 status in human breast cancer predicts mutation status, transcriptional effects, and patient survival. Proc Natl Acad Sci U S A 2005, 102:13550–13555. 18. Hess KR, Anderson K, Symmans WF, Valero V, Ibrahim N, Mejia JA, Booser
D, Theriault RL, Buzdar AU, Dempsey PJ, Rouzier R, Sneige N, Ross JS, Vidaurre T, Gómez HL, Hortobagyi GN, Pusztai L: Pharmacogenomic predictor of sensitivity to preoperative chemotherapy with paclitaxel and fluorouracil, doxorubicin, and cyclophosphamide in breast cancer. J Clin Oncol 2006, 24:4236–4244.
19. Bonnefoi H, Potti A, Delorenzi M, Mauriac L, Campone M, Tubiana-Hulin M, Petit T, Rouanet P, Jassem J, Blot E, Becette V, Farmer P, André S, Acharya CR, Mukherjee S, Cameron D, Bergh J, Nevins JR, Iggo RD: Validation of gene signatures that predict the response of breast cancer to neoadjuvant chemotherapy: a substudy of the EORTC 10994/BIG 00–01 clinical trial. Lancet Oncol 2007, 8:1071–1078.
20. Guedj M, Marisa L, de Reynies A, Orsetti B, Schiappa R, Bibeau F, MacGrogan G, Lerebours F, Finetti P, Longy M, Bertheau P, Bertrand F, Bonnet F, Martin AL, Feugeas JP, Bièche I, Lehmann-Che J, Lidereau R, Birnbaum D, Bertucci F, de Thé H, Theillet C: A refined molecular taxonomy of breast cancer. Oncogene 2012, 31:1196–1206.
21. Desmedt C, Di Leo A, de Azambuja E, Larsimont D, Haibe-Kains B, Selleslags J, Delaloge S, Duhem C, Kains J-P, Carly B, Maerevoet M, Vindevoghel A, Rouas G, Lallemand F, Durbecq V, Cardoso F, Salgado R, Rovere R, Bontempi G, Michiels S, Buyse M, Nogaret J-M, Qi Y, Symmans F, Pusztai L, D’Hondt V, Piccart-Gebhart M, Sotiriou C: Multifactorial approach to predicting resist-ance to anthracyclines. J Clin Oncol 2011, 29:1578–1586.
22. Expression Project for Oncology. [http://www.ncbi.nlm.nih.gov/geo/query/ acc.cgi?acc=GSE2109]
23. Korde LA, Lusa L, McShane L, Lebowitz PF, Lukes L, Camphausen K, Parker JS, Swain SM, Hunter K, Zujewski JA: Gene expression pathway analysis to predict response to neoadjuvant docetaxel and capecitabine for breast cancer. Breast Cancer Res Treat 2010, 119:685–699.
24. Minn AJ, Gupta GP, Siegel PM, Bos PD, Shu W, Giri DD, Viale A, Olshen AB, Gerald WL, Massagué J: Genes that mediate breast cancer metastasis to lung. Nature 2005, 436:518–524.
25. Miller WR, Larionov AA, Renshaw L, Anderson TJ, White S, Murray J, Murray E, Hampton G, Walker JR, Ho S, Krause A, Evans DB, Dixon JM: Changes in breast cancer transcriptional profiles after treatment with the aromatase inhibitor, letrozole. Pharmacogenet Genomics 2007, 17:813–826.
26. Klein A, Wessel R, Graessmann M, Jürgens M, Petersen I, Schmutzler R, Niederacher D, Arnold N, Meindl A, Scherneck S, Seitz S, Graessmann A: Comparison of gene expression data from human and mouse breast cancers: identification of a conserved breast tumor gene set. Int J Cancer 2007, 121:683–688.
27. Hoeflich KP, O’Brien C, Boyd Z, Cavet G, Guerrero S, Jung K, Januario T, Savage H, Punnoose E, Truong T, Zhou W, Berry L, Murray L, Amler L, Belvin M, Friedman LS, Lackner MR: In vivo antitumor activity of MEK and phosphatidylinositol 3-kinase inhibitors in basal-like breast cancer models. Clin Cancer Res 2009, 15:4649–4664.
28. Marty B, Maire V, Gravier E, Rigaill G, Vincent-Salomon A, Kappler M, Lebigot I, Djelti F, Tourdès A, Gestraud P, Hupé P, Barillot E, Cruzalegui F, Tucker GC, Stern M-H, Thiery J-P, Hickman JA, Dubois T: Frequent PTEN genomic alterations and activated phosphatidylinositol 3-kinase pathway in basal-like breast cancer cells. Breast Cancer Res 2008, 10:R101. 29. Chin K, DeVries S, Fridlyand J, Spellman PT, Roydasgupta R, Kuo W-L, Lapuk A,
Neve RM, Qian Z, Ryder T, Chen F, Feiler H, Tokuyasu T, Kingsley C, Dairkee S, Meng Z, Chew K, Pinkel D, Jain A, Ljung BM, Esserman L, Albertson DG, Wald-man FM, Gray JW: Genomic and transcriptional aberrations linked to breast cancer pathophysiologies. Cancer Cell 2006, 10:529–541.
30. Yu K, Ganesan K, Tan LK, Laban M, Wu J, Zhao XD, Li H, Leung CHW, Zhu Y, Wei CL, Hooi SC, Miller L, Tan P: A precisely regulated gene expression cassette potently modulates metastasis and survival in multiple solid cancers. PLoS Genet 2008, 4:e1000129.
31. Bos PD, Zhang XH-F, Nadal C, Shu W, Gomis RR, Nguyen DX, Minn AJ, van de Vijver MJ, Gerald WL, Foekens JA, Massagué J: Genes that mediate breast cancer metastasis to the brain. Nature 2009, 459:1005–1009.
32. Zhang Y, Sieuwerts AM, McGreevy M, Casey G, Cufer T, Paradiso A, Harbeck N, Span PN, Hicks DG, Crowe J, Tubbs RR, Budd GT, Lyons J, Sweep FCGJ, Schmitt M, Schittulli F, Golouh R, Talantov D, Wang Y, Foekens JA: The 76-gene signature defines high-risk patients that benefit from adjuvant tamoxifen therapy. Breast Cancer Res Treat 2009, 116:303–309.
33. Barry WT, Kernagis DN, Dressman HK, Griffis RJ, Hunter JD, Olson JA, Marks JR, Ginsburg GS, Marcom PK, Nevins JR, Geradts J, Datto MB: Intratumor heterogeneity and precision of microarray-based predictors of breast cancer biology and clinical outcome. J Clin Oncol 2010, 28:2198–2206. 34. Silver DP, Richardson AL, Eklund AC, Wang ZC, Szallasi Z, Li Q, Juul N, Leong
C-O, Calogrias D, Buraimoh A, Fatima A, Gelman RS, Ryan PD, Tung NM, De Nicolo A, Ganesan S, Miron A, Colin C, Sgroi DC, Ellisen LW, Winer EP, Garber JE: Efficacy of neoadjuvant Cisplatin in triple-negative breast cancer. J Clin Oncol 2010, 28:1145–1153.
35. Chen D-T, Nasir A, Culhane A, Venkataramu C, Fulp W, Rubio R, Wang T, Agrawal D, McCarthy SM, Gruidl M, Bloom G, Anderson T, White J, Quackenbush J, Yeatman T: Proliferative genes dominate malignancy-risk gene signature in histologically-normal breast tissue. Breast Cancer Res Treat 2010, 119:335–346.
36. Popovici V, Chen W, Gallas BG, Hatzis C, Shi W, Samuelson FW, Nikolsky Y, Tsyganova M, Ishkin A, Nikolskaya T, Hess KR, Valero V, Booser D, Delorenzi M, Hortobagyi GN, Shi L, Symmans WF, Pusztai L: Effect of training-sample size and classification difficulty on the accuracy of genomic predictors. Breast Cancer Res 2010, 12:R5.
37. Iwamoto T, Bianchini G, Booser D, Qi Y, Coutant C, Shiang CY-H, Santarpia L, Matsuoka J, Hortobagyi GN, Symmans WF, Holmes FA, O’Shaughnessy J, Hellerstedt B, Pippen J, Andre F, Simon R, Pusztai L: Gene pathways associated with prognosis and chemotherapy sensitivity in molecular subtypes of breast cancer. J Natl Cancer Inst 2011, 103:264–272. 38. Tabchy A, Valero V, Vidaurre T, Lluch A, Gomez H, Martin M, Qi Y, Barajas-Figueroa
LJ, Souchon E, Coutant C, Doimi FD, Ibrahim NK, Gong Y, Hortobagyi GN, Hess KR, Symmans WF, Pusztai L: Evaluation of a 30-gene paclitaxel, fluorouracil, doxorubicin, and cyclophosphamide chemotherapy response predictor in a multicenter randomized trial in breast cancer. Clin Cancer Res 2010, 16:5351–5361.
39. Hatzis C, Pusztai L, Valero V, Booser DJ, Esserman L, Lluch A, Vidaurre T, Holmes F, Souchon E, Wang H, Martin M, Cotrina J, Gomez H, Hubbard R, Chacón JI, Ferrer-Lozano J, Dyer R, Buxton M, Gong Y, Wu Y, Ibrahim N, Andreopoulou E, Ueno NT, Hunt K, Yang W, Nazario A, DeMichele A, O’Shaughnessy J, Hortobagyi GN, Symmans WF: A genomic predictor of response and survival following taxane-anthracycline chemotherapy for invasive breast cancer. JAMA 2011, 305:1873–1881.
40. Irizarry RA, Hobbs B, Collin F, Beazer-Barclay YD, Antonellis KJ, Scherf U, Speed TP: Exploration, normalization, and summaries of high density oligonucleotide array probe level data. Biostat Oxf Engl 2003, 4:249–264. 41. Parker JS, Mullins M, Cheang MCU, Leung S, Voduc D, Vickery T, Davies S, Fauron C, He X, Hu Z, Quackenbush JF, Stijleman IJ, Palazzo J, Marron JS, Nobel AB, Mardis E, Nielsen TO, Ellis MJ, Perou CM, Bernard PS: Supervised risk predictor of breast cancer based on intrinsic subtypes. J Clin Oncol 2009, 27:1160–1167.
42. Palmer C, Diehn M, Alizadeh AA, Brown PO: Cell-type specific gene expression profiles of leukocytes in human peripheral blood. BMC Genomics 2006, 7:115.
43. Taube JH, Herschkowitz JI, Komurov K, Zhou AY, Gupta S, Yang J, Hartwell K, Onder TT, Gupta PB, Evans KW, Hollier BG, Ram PT, Lander ES, Rosen JM, Weinberg RA, Mani SA: Core epithelial-to-mesenchymal transition interactome gene-expression signature is associated with claudin-low and metaplastic breast cancer subtypes. Proc Natl Acad Sci U S A 2010, 107:15449–15454. 44. Gatza ML, Lucas JE, Barry WT, Kim JW, Wang Q, Crawford MD, Datto MB, Kelley
M, Mathey-Prevot B, Potti A, Nevins JR: A pathway-based classification of human breast cancer. Proc Natl Acad Sci U S A 2010, 107:6994–6999. 45. Lim E, Vaillant F, Wu D, Forrest NC, Pal B, Hart AH, Asselin-Labat M-L, Gyorki
DE, Ward T, Partanen A, Feleppa F, Huschtscha LI, Thorne HJ, Fox SB, Yan M, French JD, Brown MA, Smyth GK, Visvader JE, Lindeman GJ: Aberrant luminal progenitors as the candidate target population for basal tumor development in BRCA1 mutation carriers. Nat Med 2009, 15:907–913. 46. Paik S, Shak S, Tang G, Kim C, Baker J, Cronin M, Baehner FL, Walker MG,
Watson D, Park T, Hiller W, Fisher ER, Wickerham DL, Bryant J, Wolmark N: A multigene assay to predict recurrence of tamoxifen-treated, node-negative breast cancer. N Engl J Med 2004, 351:2817–2826.
47. Bianchini G, Qi Y, Alvarez RH, Iwamoto T, Coutant C, Ibrahim NK, Valero V, Cristofanilli M, Green MC, Radvanyi L, Hatzis C, Hortobagyi GN, Andre F, Gianni L, Symmans WF, Pusztai L: Molecular anatomy of breast cancer stroma and its prognostic value in estrogen receptor-positive and -negative cancers. J Clin Oncol 2010, 28:4316–4323.
48. Sabatier R, Finetti P, Mamessier E, Raynaud S, Cervera N, Lambaudie E, Jacquemier J, Viens P, Birnbaum D, Bertucci F: Kinome expression profiling and prognosis of basal breast cancers. Mol Cancer 2011, 10:86.
49. Rody A, Holtrich U, Pusztai L, Liedtke C, Gaetje R, Ruckhaeberle E, Solbach C, Hanker L, Ahr A, Metzler D, Engels K, Karn T, Kaufmann M: T-cell metagene predicts a favorable prognosis in estrogen receptor-negative and HER2-positive breast cancers. Breast Cancer Res 2009, 11:R15. 50. Teschendorff AE, Miremadi A, Pinder SE, Ellis IO, Caldas C: An immune
response gene expression module identifies a good prognosis subtype in estrogen receptor negative breast cancer. Genome Biol 2007, 8:R157. 51. Farmer P, Bonnefoi H, Anderle P, Cameron D, Wirapati P, Wirapati P, Becette
V, André S, Piccart M, Campone M, Brain E, Macgrogan G, Petit T, Jassem J, Bibeau F, Blot E, Bogaerts J, Aguet M, Bergh J, Iggo R, Delorenzi M: A stroma-related gene signature predicts resistance to neoadjuvant chemotherapy in breast cancer. Nat Med 2009, 15:68–74. 52. Ertel A, Dean JL, Rui H, Liu C, Witkiewicz AK, Knudsen KE, Knudsen ES:
RB-pathway disruption in breast cancer: differential association with disease subtypes, disease-specific prognosis and therapeutic response. Cell Cycle Georget Tex 2010, 9:4153–4163.
53. Adélaïde J, Finetti P, Bekhouche I, Repellini L, Geneix J, Sircoulomb F, Charafe-Jauffret E, Cervera N, Desplans J, Parzy D, Schoenmakers E, Viens P, Jacquemier J, Birnbaum D, Bertucci F, Chaffanet M: Integrated profiling of basal and luminal breast cancers. Cancer Res 2007, 67:11565–11575. 54. Beroukhim R, Getz G, Nghiemphu L, Barretina J, Hsueh T, Linhart D, Vivanco
I, Lee JC, Huang JH, Alexander S, Du J, Kau T, Thomas RK, Shah K, Soto H, Perner S, Prensner J, Debiasi RM, Demichelis F, Hatton C, Rubin MA, Garraway LA, Nelson SF, Liau L, Mischel PS, Cloughesy TF, Meyerson M, Golub TA, Lander ES, Mellinghoff IK, et al.: Assessing the significance of chromosomal aberrations in cancer: methodology and application to glioma. Proc Natl Acad Sci U S A 2007, 104:20007–20012.
55. Herschkowitz JI, Zhao W, Zhang M, Usary J, Murrow G, Edwards D, Knezevic J, Greene SB, Darr D, Troester MA, Hilsenbeck SG, Medina D, Perou CM, Rosen JM: Comparative oncogenomics identifies breast tumors enriched in functional tumor-initiating cells. Proc Natl Acad Sci 2011, 109:2778–2783.
56. Hicks J, Krasnitz A, Lakshmi B, Navin NE, Riggs M, Leibu E, Esposito D, Alexander J, Troge J, Grubor V, Yoon S, Wigler M, Ye K, Børresen-Dale A-L, Naume B, Schlict-ing E, Norton L, Hägerström T, Skoog L, Auer G, Månér S, Lundin P, Zetterberg A: Novel patterns of genome rearrangement and their association with sur-vival in breast cancer. Genome Res 2006, 16:1465–1479.
57. McShane LM, Altman DG, Sauerbrei W, Taube SE, Gion M, Clark GM: Reporting recommendations for tumor marker prognostic studies (REMARK). J Natl Cancer Inst 2005, 97:1180–1184.
58. Gong Y, Yan K, Lin F, Anderson K, Sotiriou C, Andre F, Holmes FA, Valero V, Booser D, Pippen JE, Vukelja S, Gomez H, Mejia J, Barajas LJ, Hess KR, Sneige N, Hortobagyi GN, Pusztai L, Symmans WF: Determination of oestrogen-receptor status and ERBB2 status of breast carcinoma: a gene-expression profiling study. Lancet Oncol 2007, 8:203–211.
59. Di Fiore PP, Pierce JH, Kraus MH, Segatto O, King CR, Aaronson SA: erbB-2 is a potent oncogene when overexpressed in NIH/3 T3 cells. Science 1987, 237:178–182.
60. The Cancer Genome Atlas Network: Comprehensive molecular portraits of human breast tumours. Nature2012, 490:61–70.
61. Chandriani S, Frengen E, Cowling VH, Pendergrass SA, Perou CM, Whitfield ML, Cole MD: A core MYC gene expression signature is prominent in basal-like breast cancer but only partially overlaps the core serum response. PLoS One 2009, 4:e6693.
62. Bertucci F, Birnbaum D: [Genomics and clinical research for breast cancer]. Médecine Sci MS 2012, 28 Spec No 1:14–18.
63. Bertucci F, Finetti P, Birnbaum D: Basal breast cancer: a complex and deadly molecular subtype. Curr Mol Med 2012, 12:96–110.
doi:10.1186/1476-4598-13-228
Cite this article as: Sabatier et al.: Claudin-low breast cancers: clinical, pathological, molecular and prognostic characterization. Molecular Cancer 2014 13:228.