Chemometric-assisted QuEChERS
extraction method for post-harvest
pesticide determination in fruits
and vegetables
Minmin Li
1,2,*, Chao Dai
1,*, Fengzhong Wang
1, Zhiqiang Kong
1,2, Yan He
1, Ya Tao Huang
1&
Bei Fan
1An effective analysis method was developed based on a chemometric tool for the simultaneous quantification of five different post-harvest pesticides (2,4-dichlorophenoxyacetic acid (2,4-D), carbendazim, thiabendazole, iprodione, and prochloraz) in fruits and vegetables. In the modified QuEChERS (quick, easy, cheap, effective, rugged and safe) method, the factors and responses for optimization of the extraction and cleanup analyses were compared using the Plackett–Burman (P–B) screening design. Furthermore, the significant factors (toluene percentage, hydrochloric acid (HCl) percentage, and graphitized carbon black (GCB) amount) were optimized using a central composite design (CCD) combined with Derringer’s desirability function (DF). The limits of quantification (LOQs) were estimated to be 1.0 μg/kg for 2,4-D, carbendazim, thiabendazole, and prochloraz, and 1.5 μg/ kg for iprodione in food matrices. The mean recoveries were in the range of 70.4–113.9% with relative standard deviations (RSDs) of less than 16.9% at three spiking levels. The measurement uncertainty of the analytical method was determined using the bottom-up approach, which yielded an average value of 7.6%. Carbendazim was most frequently found in real samples analyzed using the developed method. Consequently, the analytical method can serve as an advantageous and rapid tool for determination of five preservative pesticides in fruits and vegetables.
Over the last few decades, there has been a worldwide trend toward the consumption of more vegetables and fruits, as they are important sources of vitamins and fiber, contributing to a healthy lifestyle and prevention of diseases1. Owing to the obvious effects of sterilization and antisepsis, preservative pesticides are largely applied to fruits and vegetables from post-harvest to storage or long distance transport; however, there is a risk that toxic residues from the applied pesticides will be accumulated in foodstuffs. The most popular post-harvest pesticides in developing countries include 2,4-dichlorophenoxyacetic acid (2,4-D), carbendazim, thiabendazole, iprodi-one, and prochloraz2,3, which are also widely used in agricultural practices. In particular, 2,4-D is widely used in Chinese agriculture to eliminate weeds in crops.
Regulations have established legal maximum residue levels (MRLs) for these pesticides in fruits and vegeta-bles. Using citrus as an example, the MRLs in citrus fruits (such as oranges) in China for 2,4-D, carbendazim, thiabendazole, and prochloraz are 1.0, 5.0, 10.0, and 10.0 mg/kg, respectively; however, no MRL has been estab-lished for iprodione in citrus fruits4. Under the European Union (EU) regulation (EC) No. 396/2005, the MRLs in oranges for 2,4-D, carbendazim, thiabendazole, iprodione, and prochloraz are 1.0, 0.2, 5.0, 0.01, and 10.0 mg/ kg, respectively5. The European Food Safety Authority’s (EFSA) annual report for 2013 showed that 2,4-D, car-bendazim, thiabendazole, iprodione, and prochloraz residues were detected at or below the MRL in 0.0%, 2.6%, 0.72%, 6.8%, and 0.03% of plant products analyzed, respectively. Moreover, MRL exceedances were most fre-quently recorded for carbendazim (0.2%)6. Furthermore, one of the most frequently detected pesticides in orange 1Institute of Food Science and Technology, Chinese Academy of Agricultural Sciences/Key Laboratory of Agro-Products Processing/Laboratory of Agro-Agro-Products Quality Safety Risk Assessment, Ministry of Agriculture, Beijing 100193, P.R. China. 2Functional and Evolutionary Entomology, Gembloux Agro-Bio-Tech, University of Liège, Passage des Déportés 2, 5030 Gembloux, Belgium. *These authors contributed equally to this work. Correspondence and requests for materials should be addressed to Z.K. (email: kongzhiqiang@caas.cn) or B.F. (email: fanbeicaas@163.com)
Received: 17 August 2016 Accepted: 11 January 2017 Published: 22 February 2017
OPEN
samples was thiabendazole (25.9%)7. Therefore, monitoring of these pesticides in fruits and vegetables is impor-tant to ensure food safety.
Some methods for the individual determination of 2,4-D, carbendazim, thiabendazole, iprodione, and prochloraz in food matrices have been previously reported using gas chromatography coupled to mass spectrom-etry (GC–MS)8,9, high-performance liquid chromatography (HPLC)10,11, and liquid chromatography coupled to tandem mass spectrometry (LC–MS)3,12. However, simultaneous determination of these five compounds in food samples is currently not available. In particular, as the physicochemical properties of 2,4-D differ from those of many other pesticides, owing to its highly solubility in water and high melting point13,14, simultaneous determi-nation of pesticide residues with 2,4-D often proves difficult. Liquid chromatography coupled with tandem mass spectrometry (LC–MS/MS) has proved to be a powerful and widely used technique for the analysis of pesticides at trace concentration levels because of its high selectivity, precision, and sensitivity14. Despite these advantages of LC-MS/MS, an important drawback of electrospray ionization that has been considered more frequently in recent years is the matrix effect. The matrix effect can severely compromise the quantitative analysis of trace-level compounds, as well as method reproducibility15. Various approaches have been proposed for minimizing or elim-inating the matrix effect, such as improving chromatographic selectivity to avoid coelution of compounds and matrix components16, using different mobile phase strengths or modifiers17, and modifying sample preparation procedures to remove interferences18. Dilution is an easy and effective method to remove interfering compounds, and the development of new-generation commercial analytical instruments with high sensitivity makes this approach feasible15,19.
The QuEChERS (quick, easy, cheap, effective, rugged and safe) method, which was developed by Anastassiades
et al.20, has proved to be an attractive pretreatment method for pesticide multiresidue analysis in fruits and veg-etables. Nevertheless, in many analytical methods, the importance of interactions between factors is often not taken into account. Hence, conventional optimization strategies for analytical methods often fail to achieve exact specifications. Chemometrics applies four main techniques, including screening, optimization, time-saving, and quantitation, to analytical methods21, with some limitations22. A Plackett-Burman (P–B) experimental design is used to identify the most important factors early in the experimentation phase when complete knowledge about the system is usually unavailable23. Developed in 1946 by statisticians Robin L. Plackett and J.P. Burman24, it is one of most widely used chemometric methods used for screening of factors because it is both economic and efficient25. The P–B design methodology is a powerful and practical tool for rapidly determining key variables in a multivariable system26. Central composite design (CCD) combines a two-level factorial design with a star design and centre points. The star and factorial points can lie equidistant from the centre, or the star points can lie within the space of the factorial design or they can lie on the faces of the factorial design points27. The use of CCD allowed the determination of the levels of various parameters to be carried out with simultaneous evolution of the interrelation between each parameter28. This method has been successfully applied in the optimization of medium composition29. The desirability function approach is one of the most widely used methods in industry for the optimization of multiple response processes, and the useful class of desirability functions was proposed by Derringer and Suich30. In addition, the so-called “Derringer’s desirability function” (DF) is a powerful strategy for simultaneous optimization of different objective functions (responses)25,31.
In this study, the chemometric methods including P–B design, CCD, and DF statistical techniques were used to modify QuEChERS method for the analysis of 2,4-D, carbendazim, thiabendazole, iprodione, and prochloraz in fruits and vegetables using ultra high performance liquid chromatography coupled with tandem mass spec-trometry (UHPLC–MS/MS), and sample dilution was investigated to diminish the matrix effect. Moreover, the effectiveness and applicability of the developed method were evaluated in real samples.
Results and Discussion
Optimization of chromatographic and MS/MS conditions.
To ensure a satisfactory chromatographic separation of the five studied pesticides, a series of experiments were carried out with different columns (Agilent ZORBAX SB-C18, Poroshell120 SB-C18, and Poroshell120 EC-C18 columns), to improve the peak shape and resolution from the interfering and noise peaks. The Poroshell 120 EC-C18 (2.1 × 50 mm, 2.7 μ m) column were selected as it showed higher efficiency and a shorter equilibrium time compared with the other columns, which may be due to the inner solid core and porous silica outer layer applied to the EC-C18 bonded phase32,33. Various mobile phase compositions employed in reversed phase chromatography and electrospray ionisation (ESI) meth-ods (i.e., water–acetonitrile and water–methanol with different concentrations of formic acid and ammonium formate added to the aqueous phase) were investigated using the gradient program with a 0.4 mL min−1 flow rate. Higher sensitivity with good peak shape was attained when water–methanol was used without any formic acid or ammonium formate. Although, formic acid in water improves the formation of protonated adducts, it can inhibit the negative ESI mode during UHPLC–ESI-MS/MS analysis. As shown in Supplementary Figure 1, there was no interference at the retention times of the analytes, and the analysis time for the five pesticides was less than 5.0 min. The compounds were eluted in the following order: carbendazim (1.218 min), prochloraz (1.371 min), 2,4-D (2.688 min), thiabendazole (4.041), and iprodione (4.941 min).In this study, the multi-reaction monitoring (MRM) mode was used to perform the analysis, and the five tar-get compounds presented comparable ionization in both positive and negative modes. ESI in positive mode was selected for the determination of carbendazim, thiabendazole, iprodione, and prochloraz, as somewhat higher responses were obtained, whereas the response signal for 2,4-D was higher in the negative mode. All of the com-pounds had abundant [M + H]+ ions ([M − H]− ions for 2,4-D), which were usually selected as the precursor ions. According to the European Commission Decision 2002/657/EC34, confirmation and identification is based on the accumulation of identification points (IPs). The spectrum derived from a LC-MS/MS method achieves four IPs (1.0 IP for the precursor ion, and 1.5 IP for each of the two product ions), which allows the identity of most compounds to be confirmed. Identification was conducted based on the retention time, the two selected
ion transitions, and their relative abundance. The molecular weights, precursor ions, product ions, fragmentor voltages, and collision energies for the five analytes are listed in Supplementary Table 1.
Optimization of sample pretreatment procedure.
The QuEChERS procedure is the combination of an extraction step for pesticides in fruits and vegetables and a cleanup step that removes sugars, lipids, and organic acids. During these two steps, many factors that can affect the extraction efficiency. To evaluate and optimize the parameters that affect the QuEChERS procedure, a screening design (P–B design) was used to determine the significant factors and an optimization design (CCD) was used to estimate the best experimental conditions.Screening design.
In this work, the P–B design was generated to screen the most important factors that affect the QuEChERS efficiency and the recovery of the five pesticide residues. As 2,4-D is a relatively strong acid (pKa = 3) and more stable at low pH values35, it is important to maintain pH control in the extraction solvent. Moreover, as the dissociated form of 2,4-D is highly polar, it is soluble in aqueous solutions and less soluble in water-immiscible organic solvents36, whereas carbendazim, thiabendazole, iprodione, and prochloraz are readily soluble in most organic solvents (i.e., methanol, acetonitrile, and acetone). Therefore, the addition of toluene to the extraction solvent was examined to improve the recoveries. In this study, five factors, namely, the extrac-tion soluextrac-tion composiextrac-tion (i.e., toluene percentage, X1, 0–100%), HCl percentage in the extraction solution (X2, 0–0.5%), primary secondary amine (PSA) amount (X3, 0–50 mg), octadecylsilane (C18) amount (X4, 0–20 mg), and graphitized carbon black (GCB) amount (X5, 0–20 mg) were studied (Supplementary Table 2). The main effect of each factor was investigated in 15 runs (12 + 3 center points), and analysis of variance (ANOVA) and at-test at a 95% confidence level were employed37. To reduce the effect of uncontrolled variables, the P–B experi-ments were run in a random manner. The effects of the factors in the P–B design are illustrated in a standardized Pareto chart (Fig. 1); the length of the bar is proportional to the absolute value of the main effect, while the vertical line indicates the 95% confidence level. As illustrated in Fig. 1, the GCB amount was the most significant variable, yielding a negative effect for all target analytes, except 2,4-D and thiabendazole. The percentage of HCl was the next most significant variable, followed by the percentage of toluene, and these variables exerted a positive effect. Therefore, for the optimization step, all other factors were fixed, while the GCB amount, percentage of HCl, and percentage of toluene were considered for further optimization.
Optimization design.
The screening experiment obtained using the P–B design indicated that the PSA amount and C18 amount do not affect the extraction efficiency to any significant extent. Therefore, they were eliminated from further studies. The GCB amount, percentage of HCl, and percentage of toluene, which are the significant variables, were further optimized using second-order CCD with a response surface methodology. ANOVA for the response surface model was carried out to assess the accuracy and quality of the fitted model using the coefficient of determination (R2) values. The regression analysis results indicated that the quadratic model contribution was statistically significant (p < 0.05). The lack-of-fit (LOF) test was not significant (p > 0.05), demonstrating that the model fitted the response well. R2 values of 0.9659, 0.9331, 0.9447, 0.8478, and 0.9380 were obtained for 2,4-D, carbendazim, thiabendazole, iprodione, and prochloraz, respectively, which indicated that the fitted models were adequate to describe the relationship between the response and the variables. The regression coefficients and the probability values of each variable in the model are shown in Supplementary Table 3. The percentage of toluene (X1) and the GCB amount (X3) had the most significant effects on the extraction yields at the 95% confidence level, with the exception of iprodione and thiabendazole, respectively. The HCl percentage (X2) only affected the recoveries of 2,4-D, iprodione, and prochloraz. Among the quadratic terms, X12 was sig-nificant for 2,4-D, thiabendazole, and prochloraz, whereas X22 and X32 were only significant for prochloraz and iprodione, respectively. The interaction terms were not significant for any of the responses, with the exception of X1 X 2 and X2 X 3 for 2,4-D. To evaluate the trends in toluene percentage, HCl percentage, and GCB amount, three-dimensional (3D) response surface plots for the five analytes were constructed, as shown in Fig. 2.The desirability profiles obtained from the predicted values using the Statistica 10.0 software were used for the optimization process. The scale in the range of 0.0 (undesirable) to 1.0 (very desirable) should be maximized by efficient selection and optimization of the variables. The CCD optimization design matrix (Fig. 3) shows that the maximum recoveries of 2,4-D (95.8% with a desirability of 1.0), carbendazim (90.0% with a desirability of 1.0), thiabendazole (99.0% with a desirability of 1.0), iprodione (90.4% with a desirability of 1.0), and prochloraz (101.5% with a desirability of 1.0) were achieved under the following conditions: extraction solvent of 1:1 acetoni-trile:toluene (v/v) containing 0.25% HCl and 0 mg GCB.
Method validation.
The method was validated in accordance with the SANCO/12571/201338, which is a method validation procedure for pesticide residue analysis in food that includes the following parameters: accu-racy, precision, linearity, matrix effects, and limit of quantifications (LOQs).Linearity.
Linearity was evaluated using standard solutions, which were diluted using methanol, and matrix-matched calibration curves for eight blank sample extracts (citrus, apple, mango, lychee, tomato, cucum-ber, green pepper, and eggplant) with concentration gradients of 0.1, 1, 5, 10, 50, 100, and 200 μ g/L for 2,4-D, car-bendazim, thiabendazole, and prochloraz, and 0.25, 1, 5, 10, 50, 100, and 200 μ g/L for iprodione. The calibration method greatly influences the quantitative determination results. Good linearity was observed for all the target pesticides with R2 values greater than 0.9900 for the blank extracts and the pure solvent-based solutions without dilution and with 10-fold dilution (0.9940–0.9999).Matrix effect.
When using ESI, the presence of matrix components can affect the ionization of the target compounds39. The matrix effect was detected by comparing the slopes of the calibration curves for the blank sample extracts (without dilution and with 10-fold dilution) with those for pure solvent. Signal suppression orenhancement can seriously compromise quantitation of a target compound at trace levels, and greatly affect the reproducibility and accuracy of the method15. Signal enhancement occurs if the percentage difference between the slopes of the calibration curves is positive, whereas if the difference is negative, signal suppression occurs. The magnitude of this percentage indicates the extent of the matrix effect. No matrix effect is considered to occur when the value is between − 20% and 20% because this variation is similar to the repeatability values. However, values below − 50% or above 50% are considered to correspond to strong matrix effects, and others are recognized as medium matrix effects.
For the extracts without dilution, 2,4-D, carbendazim, and thiabendazole in citrus, carbendazim in cucum-ber, thiabendazole and iprodione in lychee, and iprodione in eggplant exhibited strong matrix effects. This is because of the complexity of the interfering compounds in citrus, cucumber, lychee, and eggplant matrices. Using LC-Q-TOF-MS, Ferrer et al.15 identified one interfering compound as nobiletin, which was mainly present in citrus peel. The dilution of the sample extracts with pure solvent was assayed to examine signal suppression fol-lowing reduction of the matrix load. As shown in Fig. 4, the matrix effect of citrus and eggplant improved 100% and 80%, respectively, after 10-fold dilution. Moreover, more than 20% improvement was obtained for the other samples. Meanwhile, each pesticide showed completely different behavior, an illustrative example of which is thiabendazole (Table 1). In citrus or in lychee, thiabendazole shows high signal suppression or enhancement, but the matrix effect was significantly decreased with dilution; however, even without dilution, the matrix effect in apple is negligible. Some pesticides will interact with complex components of the matrix sample at very low
Figure 1. Standardized Pareto charts obtained from the Plackett–Burman design. (A) 2,4-D, (B) carbendazim,
Figure 2. Response surfaces of the recoveries of (A) 2,4-D, (B) carbendazim, (C) thiabendazole, (D) iprodione,
and (E) prochloraz estimated from the central composite design by plotting the (i) toluene percentage (%) versus HCl percentage (%), (ii) toluene percentage (%) versus GCB amount (g), and (iii) and HCl percentage (%) versus GCB amount (g).
concentrations, resulting in signal suppression, even though the extracts are highly diluted. As the average signal for some pesticides after dilution was still half that of the solvent standards, matrix-matched calibration was required using blank extracts diluted 10-fold with methanol.
Limits of quantification and recovery study.
The LOQs were determined according to the lowest con-centration level validated (1.0 μ g/kg for 2,4-D, carbendazim, thiabendazole, and prochloraz, and 1.5 μ g/kg for iprodione) in food matrices with satisfactory recoveries of between 70% and 120% and. relative standard devia-tions (RSDs) of less than 20%. The recovery (trueness and precision) and repeatability (intra-day and inter-day)Figure 3. Profiles of predicated values and desirability functions for the extraction recovery of (A) 2,4-D, (B)
carbendazim, (C) thiabendazole, (D) iprodione, and (E) prochloraz. The dashed lines indicate the values after optimization.
Pesticides Matrix Regression equation* R2 (%)ME & LOQ #
(μg/kg)
Spiked level
LOQ 10 × LOQ 100 × LOQ
Recovery RSDa RSDb Recovery RSDa RSDb Recovery RSDa RSDb
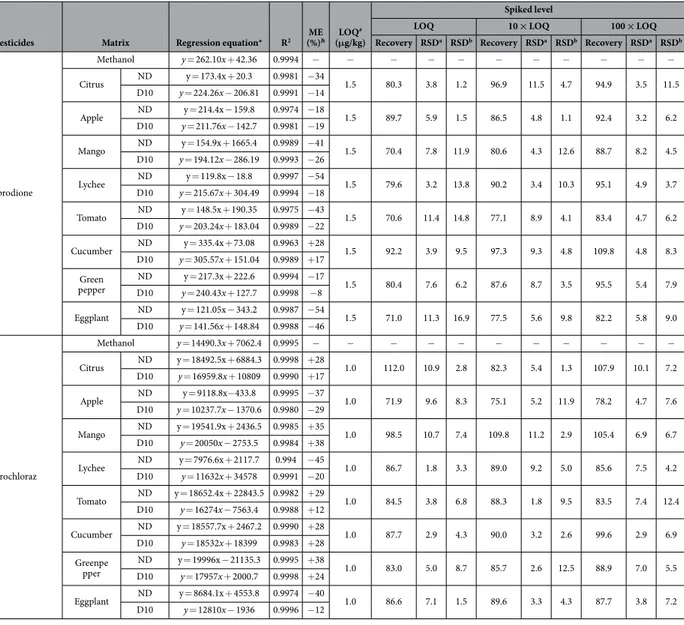
2,4-D Methanol y = 1991.1x + 325.61 0.9995 − − − − − − − − − − − Citrus ND@ y = 3175.9x − 158.4 0.9996 + 60 1.0 91.9 1.8 4.4 96.5 1.9 3.1 98.6 3.6 7.6 D10Δ y = 2562.4x + 56054 0.9988 + 29 Apple ND y = 2190x + 5653.1 0.9984 + 10 1.0 89.2 2.1 6.2 92.1 2.3 1.9 96.6 4.1 6.4 D10 y = 1923.4x − 447.11 0.9989 − 3 Mango ND y = 2847.7x + 3979.9 0.9965 + 43 1.0 89.4 11.7 2.9 87.7 8.4 14.9 93.5 5.1 8.5 D10 y = 2038.9x − 1135.1 0.9957 + 17 Lychee ND y = 1193.1x − 1987.2 0.9995 − 40 1.0 70.6 4.3 5.9 79.2 4.2 2.5 76.5 5.1 7.6 D10 y = 1551.9x + 10058 0.9985 − 22 Tomato ND y = 1592.8x + 8706.1 0.9988 − 21 1.0 71.3 4.5 8.7 78.1 5.2 1.2 72.2 3.7 9.4 D10 y = 1510.7x + 261.61 0.9974 − 24 Cucumber ND y = 2449.5x + 18404.2 0.9974 + 23 1.0 90.6 11.1 4.7 94.9 5.6 12.7 95.8 2.5 7.5 D10 y = 2035.4x − 1566 0.9962 + 2 Green pepper ND y = 1353.9x − 1499.5 0.9991 − 32 1.0 73.5 4.4 6.8 76.4 3.6 3.8 76.1 6.7 10.3 D10 y = 1602.5x + 269.23 0.9982 − 20 Eggplant ND y = 1164x − 1134.1 0.9995 − 42 1.0 79.8 4.1 9.3 78.9 2.5 5.0 73.9 3.2 7.2 D10 y = 1436x − 390.65 0.9975 − 28 Carbendazim Methanol y = 176731x + 99055 0.9998 − − − − − − − − − − − Citrus ND y = 268161.8x + 4949.8 0.9968 + 52 1.0 86.9 1.2 10.1 81.8 0.6 4.5 74.9 4.8 7.1 D10 y = 223223x + 27773 0.9991 + 26 Apple ND y = 236215.6x + 2005.6 0.9992 + 34 1.0 105.5 1.5 5.5 100.5 1.3 6.0 104.7 1.5 2.2 D10 y = 190466x − 15186 0.9956 + 8 Mango ND y = 229750.3x − 453.5 0.9998 + 30 1.0 84.9 2.8 6.7 83.7 1.4 10.4 82.9 1.1 10.6 D10 y = 217618x + 200102 0.9985 + 23 Lychee ND y = 128246.2x + 9190.9 0.9979 − 27 1.0 75.9 2.3 4.9 84.0 3.8 7.4 102.7 1.9 7.8 D10 y = 136591x − 2053.7 0.9965 − 23 Tomato ND y = 215811.8x − 5433.4 0.9994 + 22 1.0 79.6 1.6 5.3 84.8 1.5 1.8 86.3 1.1 6.3 D10 y = 208961x − 78290 0.9981 + 18 Cucumber ND y = 266631.1x + 4290 0.9989 + 51 1.0 85.6 1.3 8.2 88.9 1.0 10.2 84.4 1.4 7.7 D10 y = 218324x − 79646 0.9974 + 24 Green pepper D10ND y = 226515.7x + 4113.7 0.9994 + 28y = 193792x − 39174 0.9986 + 10 1.0 83.8 1.1 1.5 89.4 2.1 1.0 85.6 2.8 11.6 Eggplant ND y = 243354.1x + 1266.9 0.9959 + 38 1.0 101.7 8.9 3.6 107.0 6.5 4.3 96.8 2.4 3.8 D10 y = 194680x − 105142 0.9987 + 10 Thiabendazole Methanol y = 122380x + 15957 0.9993 − − − − − − − − − − − Citrus ND y = 196255.6x − 953.8 0.9999 + 60 1.0 107.4 4.5 5.9 104.6 0.9 3.5 86.1 10.9 4.1 D10 y = 160230x + 16940 0.9990 + 31 Apple ND y = 126499x + 1470.3 0.9992 + 3 1.0 78.2 6.1 2.5 87.8 4.4 3.7 102.2 4.1 14.6 D10 y = 118125x + 20244 0.9979 − 3 Mango ND y = 104799.2x + 664.2 0.9988 − 14 1.0 96.3 11.9 8.7 109.2 7.7 5.2 106.4 5.8 9.9 D10 y = 100496x − 9439.5 0.9976 − 18 Lychee ND y = 59966x − 633.4 0.9996 − 51 1.0 102.8 6.6 13.9 107.5 4.4 5.2 108.2 10.2 8.4 D10 y = 71458x − 21003 0.9986 − 42 Tomato ND y = 142960.8x + 1786.3 0.9978 + 17 1.0 81.8 9.8 5.8 92.3 6.0 12.8 96.4 9.4 10.2 D10 y = 129274x − 25846 0.9983 + 6 Cucumber ND y = 134170.4x + 300.1 0.9993 + 10 1.0 81.8 7.5 4.6 99.8 4.5 2.9 101.0 5.1 1.6 D10 y = 130301x − 20946 0.9999 + 6 Greenpepper ND y = 89537.4x − 654.9 0.9985 − 27 1.0 97.3 7.7 13.8 113.9 5.8 3.9 108.7 10.8 10.2 D10 y = 108280x − 23063 0.9982 − 12 Eggplant ND y = 89113.6x − 934.8 0.9942 − 27 1.0 97.1 4.2 3.1 107.7 3.8 5.9 91.5 1.5 6.3 D10 y = 110845x − 7371.8 0.9994 − 9 Continued
of the described method were determined in spiked blanks at three concentration levels (LOQ, 10 × LOQ, and 100 × LOQ) in five replications. Excellent average recoveries in the range of 70.4–113.9% were obtained at all spiking levels. Moreover, good repeatability with intra-day (n = 5) and inter-day (n = 15) RSDs for the proposed method ranging from 0.6 to 11.9% and from 1.2 to 16.9%, respectively, were also obtained (Table 1). The recovery assay results illustrate that this method has good precision and accuracy for all five compounds analyzed in citrus, apple, mango, lychee, tomato, cucumber, green pepper, and eggplant.
Uncertainty.
The uncertainty associated with an analytical methodology describes the range around a reported or experimental result within which the true value can be expected to lie with a defined level of proba-bility40. In this study, the measurement uncertainty was determined for all compounds at three spiked levels using the bottom-up approach based on the in-house validation data, in accordance with EURACHEM/CITAC41. The main sources of uncertainty were identified and quantified, and the combined uncertainty (Uc) was calculated as follows:= + + +
Uc (U12 U U U )
22 32 42 1/2
Uncertainty U1, which is associated with the preparation of standards and stock solutions, is concentration-dependent and was calculated by the propagation of errors approach. Uncertainty U2, which is associated with the calibration curve, represents the contribution of estimating the analyte concentration from the calibration curve. Uncertainty U3, which is associated with the precision, is expressed as the RSD obtained
Pesticides Matrix Regression equation* R2 (%)ME & LOQ #
(μg/kg)
Spiked level
LOQ 10 × LOQ 100 × LOQ
Recovery RSDa RSDb Recovery RSDa RSDb Recovery RSDa RSDb
Iprodione Methanol y = 262.10x + 42.36 0.9994 − − − − − − − − − − − Citrus ND y = 173.4x + 20.3 0.9981 − 34 1.5 80.3 3.8 1.2 96.9 11.5 4.7 94.9 3.5 11.5 D10 y = 224.26x − 206.81 0.9991 − 14 Apple ND y = 214.4x − 159.8 0.9974 − 18 1.5 89.7 5.9 1.5 86.5 4.8 1.1 92.4 3.2 6.2 D10 y = 211.76x − 142.7 0.9981 − 19 Mango ND y = 154.9x + 1665.4 0.9989 − 41 1.5 70.4 7.8 11.9 80.6 4.3 12.6 88.7 8.2 4.5 D10 y = 194.12x − 286.19 0.9993 − 26 Lychee ND y = 119.8x − 18.8 0.9997 − 54 1.5 79.6 3.2 13.8 90.2 3.4 10.3 95.1 4.9 3.7 D10 y = 215.67x + 304.49 0.9994 − 18 Tomato ND y = 148.5x + 190.35 0.9975 − 43 1.5 70.6 11.4 14.8 77.1 8.9 4.1 83.4 4.7 6.2 D10 y = 203.24x + 183.04 0.9989 − 22 Cucumber ND y = 335.4x + 73.08 0.9963 + 28 1.5 92.2 3.9 9.5 97.3 9.3 4.8 109.8 4.8 8.3 D10 y = 305.57x + 151.04 0.9989 + 17 Green pepper ND y = 217.3x + 222.6 0.9994 − 17 1.5 80.4 7.6 6.2 87.6 8.7 3.5 95.5 5.4 7.9 D10 y = 240.43x + 127.7 0.9998 − 8 Eggplant ND y = 121.05x − 343.2 0.9987 − 54 1.5 71.0 11.3 16.9 77.5 5.6 9.8 82.2 5.8 9.0 D10 y = 141.56x + 148.84 0.9988 − 46 Prochloraz Methanol y = 14490.3x + 7062.4 0.9995 − − − − − − − − − − − Citrus ND y = 18492.5x + 6884.3 0.9998 + 28 1.0 112.0 10.9 2.8 82.3 5.4 1.3 107.9 10.1 7.2 D10 y = 16959.8x + 10809 0.9990 + 17 Apple ND y = 9118.8x− 433.8 0.9995 − 37 1.0 71.9 9.6 8.3 75.1 5.2 11.9 78.2 4.7 7.6 D10 y = 10237.7x − 1370.6 0.9980 − 29 Mango ND y = 19541.9x + 2436.5 0.9985 + 35 1.0 98.5 10.7 7.4 109.8 11.2 2.9 105.4 6.9 6.7 D10 y = 20050x − 2753.5 0.9984 + 38 Lychee ND y = 7976.6x + 2117.7 0.994 − 45 1.0 86.7 1.8 3.3 89.0 9.2 5.0 85.6 7.5 4.2 D10 y = 11632x + 34578 0.9991 − 20 Tomato ND y = 18652.4x + 22843.5 0.9982 + 29 1.0 84.5 3.8 6.8 88.3 1.8 9.5 83.5 7.4 12.4 D10 y = 16274x − 7563.4 0.9988 + 12 Cucumber ND y = 18557.7x + 2467.2 0.9990 + 28 1.0 87.7 2.9 4.3 90.0 3.2 2.6 99.6 2.9 6.9 D10 y = 18532x + 18399 0.9983 + 28 Greenpe pper D10ND y = 19996x − 21135.3 0.9995 + 38y = 17957x + 2000.7 0.9998 + 24 1.0 83.0 5.0 8.7 85.7 2.6 12.5 88.9 7.0 5.5 Eggplant ND y = 8684.1x + 4553.8 0.9974 − 40 1.0 86.6 7.1 1.5 89.6 3.3 4.3 87.7 3.8 7.2 D10 y = 12810x − 1936 0.9996 − 12
Table 1. Linear regression parameters and recoveries for 2,4-D, carbendazim, thiabendazole, iprodione, and prochloraz in various matrices. @Matrix with no dilution. ΔMatrix with 10 times dilution. *The calibration range was 0.1–200 μ g/kg for all preservative except 0.25–200 μ g/kg for iprodione; &Matrix effect; #Limits of quantification.
from repeatability or intermediate precision assays for different concentration levels. Uncertainty U4, which is associated with the accuracy, is the recovery percentage obtained from recovery assays. The expanded uncertainty (Uexp) was obtained from the combined uncertainty by multiplying by a coverage factor k = 2 to ensure a level of confidence of 95%, as follows:
= ×
Uexp k Uc
The results obtained for each individual source of uncertainty, the combined uncertainty Uc, and the expanded uncertainty Uexp are summarized in Table 2. The Uexp values were 8.5%, 5.9%, 7.7%, 7.5%, and 8.4% for 2,4-D, carbendazim, thiabendazole, iprodione, and prochloraz, respectively, which yielded an average value of 7.6%. This uncertainty is distinctly lower than the maximum threshold value of 50% recommended by SANCO/12571/201338, which clearly demonstrates the fitness for purpose of the developed method.
Monitoring and safety evaluation of market samples.
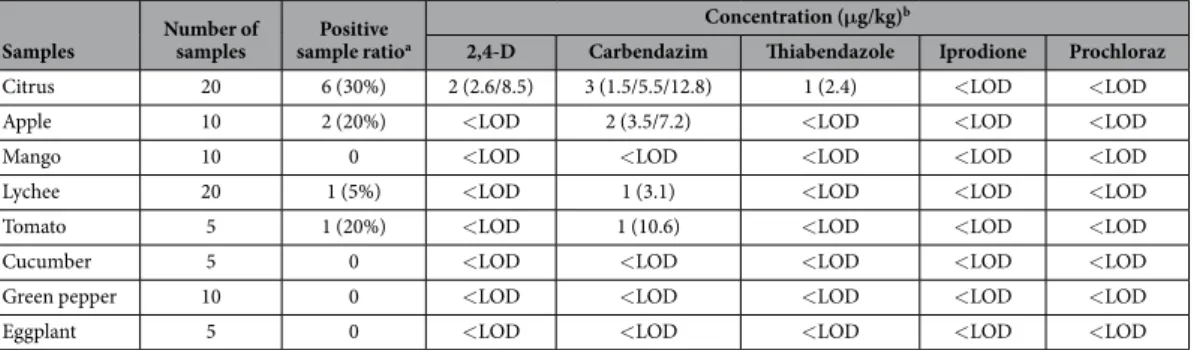
The effectiveness and applicability of this method for measuring trace levels of the target compounds were evaluated by randomly analyzing 85 real sam-ples (20 citrus, 10 apple, 10 mango, 20 lychee, 5 tomato, 5 cucumber, 10 green pepper, and 5 eggplant samsam-ples) obtained from different local markets in Beijing (China). The determined concentrations of detected pesticides (Table 3) show that 88% of the samples were blank or contained pesticides at levels lower than the LOQs, while 12% of the samples contained one or more of the pesticides studied. Three different pesticides were detected in some of these samples, and carbendazim was most commonly found in the samples. The highest pesticide residue concentration was found for carbendazim in citrus at 12.8 μ g/kg. Moreover, citrus had the highest positive sample ratio for detected pesticide residues, mainly containing carbendazim, thiabendazole, and 2,4-D. These results are in agreement with previous literature reports, in which the majority of orange samples analyzed contained these pesticide residues14,15. It is important to note that all detected pesticides were below the MRLs established by Chinese and European MRL regulations4,5. Hence, the presence of these pesticides at these levels in some of the samples does not pose a threat to the consumer.Conclusion
An effective method for the simultaneous quantification of 2,4-D, carbendazim, thiabendazole, iprodione, and prochloraz in fruits and vegetables was developed using QuEChERS and UHPLC–MS/MS. The extraction and cleanup steps of the QuEChERS method were optimized using chemometrics, with the significant factors deter-mined using a P–B screening design and subsequently optimized using CCD combined with DF. The optimum extraction solution consisted of acetonitrile:toluene (1:1, v/v) with 0.25% HCl and 0 mg GCB. The develop method was validated with good accuracy, linearity, LOQs, recoveries, and measurement uncertainty. Matrix-matched calibration was required to compensate for matrix effects. The successful application of the developed method to real samples confirmed its reliability and efficacy for routine pesticide residue monitoring in vegetable and fruit samples.
Uncertainty 2,4-D Carbendazim Thiabendazole Iprodione Prochloraz
U1 0.0015 0.0015 0.0015 0.0021 0.0015 U2 0.0302 0.0205 0.0232 0.0027 0.0285 U3 0.0035 0.0048 0.0045 0.0027 0.0059 U4 0.0298 0.0213 0.0303 0.0371 0.0306 Uc 0.0425 0.0299 0.0385 0.0374 0.0423 Uexp (%) 8.5 5.9 7.7 7.5 8.4
Table 2. Uncertainty (Uc) and expanded uncertainty (Uexp) in different matrices for 2,4-D, carbendazim,
thiabendazole, and prochloraz at 1.0–100 μg/kg and iprodione at 1.5–150 μg/kg.
Samples Number of samples sample ratioPositive a
Concentration (μg/kg)b
2,4-D Carbendazim Thiabendazole Iprodione Prochloraz
Citrus 20 6 (30%) 2 (2.6/8.5) 3 (1.5/5.5/12.8) 1 (2.4) < LOD < LOD Apple 10 2 (20%) < LOD 2 (3.5/7.2) < LOD < LOD < LOD Mango 10 0 < LOD < LOD < LOD < LOD < LOD Lychee 20 1 (5%) < LOD 1 (3.1) < LOD < LOD < LOD Tomato 5 1 (20%) < LOD 1 (10.6) < LOD < LOD < LOD Cucumber 5 0 < LOD < LOD < LOD < LOD < LOD Green pepper 10 0 < LOD < LOD < LOD < LOD < LOD Eggplant 5 0 < LOD < LOD < LOD < LOD < LOD Table 3. Concentrations of 2,4-D, carbendazim, thiabendazole, iprodione, and prochloraz in vegetable and fruit samples obtained from Beijing markets. aNumber of positive sample (positive sample ratio). bNumber of detectable sample (concentration of pesticide).
Materials and Methods
Reagents and materials.
Analytical standards of 2,4-D (99.0% purity), carbendazim (99.0% purity), thi-abendazole (98.3% purity), iprodione (99.5% purity), and prochloraz (99.0% purity) were obtained from Dr. Ehrenstorfer (LGC Standards, Augsburg, Germany). HPLC-grade acetonitrile and methanol were purchased from Honeywell International Inc. (Morris Plains, NJ, USA). Analytical-grade acetonitrile, hydrochloric acid (HCl), sodium chloride (NaCl), and anhydrous magnesium sulfate (anhydrous MgSO4) for pesticide residue analyses were obtained from Beijing Chemical Reagent Company (Beijing, China). Primary secondary amine (PSA, 40 μ m), octadecylsilane (C18, 40 μ m), and graphitized carbon black (GCB, 400 mesh) sorbents were pur-chased from Agela Technologies Inc. (Tianjin, China). Ultra-pure water was obtained from Wahaha Group Co., Ltd. (Hangzhou, China).UHPLC–MS/MS analysis.
Chromatographic separation was carried out using an Agilent 1290 LC system (Agilent Technologies, Santa Clara, CA) consisting of a four-channel on-line degasser, a standard binary pump, and an Agilent Poroshell120 EC-C18 column (2.1 × 50 mm, 2.7 μ m particle size). The mobile phase consisted of ultra-pure water (eluent A) and methanol (eluent B). The gradient elution program was 10% B at injection time, linear increase to 50% B in 1.0 min, further increase to 95% B in 1.5 min, and then maintain for 4.4 min before returning to the initial conditions of 10% B (90% A) in 0.1 min. The flow rate was 0.4 mL min−1, and all compounds were eluted within 5.0 min. The temperature of the sample vial holder was set at 5 °C and the column temperature was maintained at 40 °C to decrease viscosity. The injected volume was 1 μ L.An Agilent 6495 triple quadrupole mass spectrometer (Agilent Technologies, Santa Clara, CA, USA) equipped with a conventional ESI source was used to quantify the five compounds of interest. Nitrogen (99.95%) and argon (99.99%) were used as the nebulizer gas and the collision gas, respectively, and the pressure in the T-Wave cell was 3.2 × 10⁻⁵ MPa. The positive and negative ionization switching modes and MRM were used for the detection of the five compounds, and the MS/MS conditions were optimized for the target compounds. The conditions were typically as follows: source temperature, 200 °C; capillary voltage, 3.0 kV; and desolvation temperature, 370 °C. A cone gas flow of 50 L h−1 and a desolvation gas flow of 600 L h−1 were used. Infusion experiments were con-ducted for each compound to optimize the intensity in both positive and negative ionization modes. All other MS parameters were optimized individually for each target compound, and the optimized parameters are listed in Supplementary Table 1. MassHunter software (Agilent, Santa Clara, CA, USA) was used to collect and analyze the data.
Sample preparation.
The QuEChERS procedure is the combination of an extraction step for pesticides in fruits and vegetables and a cleanup step that removes sugars, lipids, and organic acids. And some modifica-tions to the original QuEChERS method have been introduced to ensure efficient extraction of pH-dependent compounds in the vegetables and fruits. Initially, each chopped and homogenized sample (20.0 g) was placed in a 50 mL centrifuge tube, then a mixture of 20.0 mL of acetonitrile:toluene (1:1, v/v, containing 0.25% HCl) was added, and the sample was vortexed for 3 min. Subsequently, 5.0 g of NaCl was added, the tubes were immediately vortexed intensively for 2 min, and then centrifuged at 5000 r min−1 for 5 min. Next, 0.1 mL of the upper layer was transferred into a single-use centrifuge tube, diluted with 0.9 mL of methanol, and filtered through a 0.22 μ m nylon syringe filter prior to UHPLC–MS/MS injection.Validation procedure.
Linearity, recovery, precision (as repeatability and reproducibility, relative stand-ard deviation (RSD)), matrix effects, limit of quantification (LOQ), and measurement uncertainty were investi-gated to determine the accuracy and precision of the analytical method, as described by SANCO/12571/201338. Quantification and performance were determined by comparison with the peak areas of matrix-matched standard solutions. The linearity was analyzed in solvent and matrix without and with 10-fold dilution, using matrix-matched calibration curves with concentration gradients of 0.1, 1, 5, 10, 50, 100, and 200 μ g/L for 2,4-D, carbendazim, thiabendazole, and prochloraz, and 0.25, 1, 5, 10, 50, 100, and 200 μ g/L for iprodione. The ME (matrix effect) was examined using the following equation:= − ×
ME(%) [slope(matrix) slope(solvent)]/slope(solvent) 100
where slope (matrix) and slope (solvent) are obtained from the calibration curves42. To study the performance of the method with a reduced matrix effect, solutions without dilution of the blank extracts and with 10-fold dilution of the blank extracts were prepared.
Matrix-matched calibration curves were used to correct for ion suppression/enhancement effects. As a result, the recoveries were analyzed at three levels: LOQ, 10 × LOQ, and 100 × LOQ. The LOQ was set as the minimum concentration that can be quantified with acceptable accuracy and precision38.
Experimental design.
An experimental P–B design can provide important information about each variable to allow screening of the main variables that affect the extraction recovery with relatively few experiments26,43. The five factors or independent variables (X1 to X5) considered in this study represent the extraction solution composi-tion, HCl percentage, PSA amount, C18 amount, and GCB amount, respectively. All variables were investigated at two levels designated as + 1 (high) and − 1 (low). Supplementary Table 2 shows the levels of each factor used in the experimental design. The design also includes three central points to estimate the experimental error (pure error)44. Then, the significant factors, such as GCB amount, percentage of HCl, and percentage of toluene, were opti-mized by using a CCD, and a quadratic model between the dependent and independent variables was built. CCD is one of the most popular response-surface designs used to fit quadratic models, and was first described by Box and Wilson45. To fit quadratic polynomials, CCD combines a 2f factorial design with additional points (starpoints) and at least one point at the center of the experimental region to obtain properties such as rotatability or orthogonality46. Subsequently, the specific values of the three most significant variables were identified using DF, which can convert multiple responses into a single response, as follows30,47.
∏
= = d D i n i n 1 1/where n is the number of responses and di is the partial desirability function of each response. The experimental
designs were carried out and the results were evaluated using StatSoft Statistica 10.0 (StatSoft, Tulsa, OK, USA).
References
1. Christia, C., Bizani, E., Christophoridis, C. & Fytianos, K. Pesticide residues in fruit samples: comparison of different QuEChERS methods using liquid chromatography–tandem mass spectrometry. Environ. Sci. Pollut. Res. 22, 13167–13178 (2015).
2. Chen, W., Jiao, B., Su, X., Zhao, Q. & Sun, D. Dissipation and residue of 2,4-D in citrus under field condition. Environ. Monit. Assess. 187, 1–8 (2015).
3. Wang, S., Xu, Y., Pan, C., Jiang, S. & Liu, F. Application of matrix solid-phase dispersion and liquid chromatography–mass spectrometry to fungicide residue analysis in fruits and vegetables. Anal. Bioanal. Chem. 387, 673–685 (2007).
4. National Food Safety Standard-Maximum Residue Limits for Pesticides in Food, National Health and Family Planning Commission of the People’s Republic of China, Ministry of Agriculture of the People’s Republic of China, Beijing, 2014, GB 2763–2014. 5. European Commission EU pesticides database, http://ec.europa.eu/sanco_pesticides/public/index.cfm (Accessed: 10 August 2009). 6. EFSA. The 2013 European Union report on pesticide residues in food. EFSA J. 13, 4038 (2015).
7. EFSA. The 2011 European Union report on pesticide residues in food. EFSA J. 12, 3694 (2014).
8. Williams, K. J., James, C. R., Thorpe, S. A. & Reynolds, S. L. Two Analytical Methods for the Measurement of 2,4-D in Oranges: an ELISA Screening Procedure and a GC-MS Confirmatory Procedure. Pestic. Sci. 50, 135–140 (1997).
9. Ramírez Restrepo, A., Gallo Ortiz, A. F., Hoyos Ossa, D. E. & Peñuela Mesa, G. A. QuEChERS GC–MS validation and monitoring of pesticide residues in different foods in the tomato classification group. Food Chem. 158, 153− 161 (2014).
10. Lin, L. et al. Determination of imidacloprid, carbendazim and thiabendazole residues in vegetables and fruits by HPLC. Adv. Mater.
Res. 781, 1392–1396 (2013).
11. Subhani, Q., Huang, Z., Zhu, Z. & Zhu, Y. Simultaneous determination of imidacloprid and carbendazim in water samples by ion chromatography with fluorescence detector and post-column photochemical reactor. Talanta 116, 127–132 (2013).
12. Sack, C., Vonderbrink, J., Smoker, M. & Smith, R. E. Determination of Acid Herbicides Using Modified QuEChERS with Fast Switching ESI+/ESI− LC-MS/MS. J. Agric. Food Chem. 63, 9657–9665 (2015).
13. Walters, J. Environmental fate of 2,4-dichlorophenoxyacetic acid. Environmental monitoring and pest management. Department of Pesticide Regulation, Sacramento, CA 95814–3510 (1999).
14. Uclés, A. et al. Application of zirconium dioxide nanoparticle sorbent for the clean-up step in post-harvest pesticide residue analysis.
Talanta 144, 51–61 (2015).
15. Ferrer, C., Martínez-Buene, M. J., Lozano, A. & Fernández-Alba, A. R. Pesticide residue analysis of fruit juices by LC–MS/MS direct injection. One year pilot survey. Talanta 83, 1552–1561 (2011).
16. Bogialli, S. et al. Simple and rapid assay for analyzing residues of carbamate insecticides in bovine milk: hot water extraction followed by liquid chromatography–mass spectrometry. J. Chromatogr. A 1054, 351–357 (2004).
17. Kmellár, B., Pareja, L., Ferrer, C., Fodor, P. & Alba, A. R. F. Study of the effects of operational parameters on multiresidue pesticide analysis by LC-MS/MS. Talanta 84, 262–273 (2011).
18. Chung, S. W. & Chan, B. T. Validation and use of a fast sample preparation method and liquid chromatography–tandem mass spectrometry in analysis of ultra-trace levels of 98 organophosphorus pesticide and carbamate residues in a total diet study involving diversified food types. J. Chromatogr. A 1217, 4815–4824 (2010).
19. Stahnke, H., Kittlaus, S., Kempe, G. & Alder, L. Reduction of matrix effects in liquid chromatography-electrospray ionization-mass spectrometry by dilution of sample extracts: How much dilution is needed? Anal. Chem. 84, 1474–1482 (2012).
20. Anastassiades, M., Lehotay, S. J., Štajnbaher, D. & Schenck, F. J. Fast and easy multiresidue method employing acetonitrile extraction/ partitioning and “dispersive solid-phase extraction” for the determination of pesticide residues in produce. J. AOAC Int. 86, 412–431 (2003).
21. Brown, S. D., Sum, S. T., Despagne, F. & Lavine, B. K. Chemometrics. Anal. Chem. 68, 21–62 (1996).
22. Li, S. et al. Chemometric-assisted QuEChERS extraction method for the residual analysis of thiacloprid, spirotetramat and spirotetramat’s four metabolites in pepper: application of their dissipation patterns. Food Chem. 192, 893–899 (2016).
23. Manbohi, A. & Ahmadi, S. H. In-tube magnetic solid phase microextraction of some fluoroquinolones based on the use of sodium dodecyl sulfate coated Fe3O4 nanoparticles packed tube, Anal. Chim. Acta 885, 114–121 (2015).
24. Plackett, R. L. & Burman, J. P. The design of optimum multifactorial experiments. Biometrica 33, 305–325 (1944).
25. Candiotia, L. V., De Zanb, M. M., Cámara, M. S. & Goicoechea, H. C. Experimental design and multiple response optimization. Using the desirability function in analytical methods development. Talanta 124, 123–138 (2014).
26. Khodadoust, S., Ghaedi, M. & Hadjmohammadi, M. R. Dispersive nano solid material-ultrasound assisted microextraction as a novel method for extraction and determination of bendiocarb and promecarb: Response surface methodology. Talanta 116, 637–646 (2013).
27. Hibbert, D. B. Experimental design in chromatography: a tutorial review. J. Chromatogr. B 910, 2–13 (2012). 28. Montgomery D. C. Design and analysis of experiment. 3rd ed. New York: John Wiley and Sons; 1991.
29. Monzón, C. M., Teglia, C. M., Del, M. R. & Goicoechea, H. C. Chemometric optimization and validation of a novel dispersive liquid− liquid microextraction− HPLC method for gliclazide, glibenclamide and glimepiride quantitation in serum samples.
Microchem. J. 127, 113–119 (2016).
30. Derringer, G. & Suich, R. Simultaneous optimization of several response variables. J. Qual.Technol. 12, 214–219 (1980).
31. Almeida Bezerra, M., Erthal Santelli, R., Padua Oliveira, E., Silveira Villar, L. & Escaleira, L. A. Response surface methodology (RSM) as a tool for optimization in analytical chemistry. Talanta 76, 965–977 (2008).
32. Gritti, F. & Guiochon, G. Repeatability of the efficiency of columns packed with sub-3 μ m core–shell particles: Part III. 2.7 μ m Poroshell 120 EC-C18 particles in 4.6 mm and 2.1 mm × 100 mm column formats. J. Chromatogr. A 1252, 56–66 (2012). 33. Hayes, R., Ahmed, A., Edge, T. & Zhang, H. Core–shell particles: Preparation, fundamentals and applications in high performance
liquid chromatography. J. Chromatogr. A 1357, 36–52 (2014).
34. Nguyen, T. D., Lee, B. S., Lee, B. R., Lee, D. M. & Lee, G. H. A multiresidue method for the determination of 109 pesticides in rice using Quick Easy Cheap Effective Rugged and Safe (QuEChERS) sample preparation method and gas chromatography/mass spectrometry with temperature control and vacuum concentration. Rapid Commun. Mass Spectrom. 21, 3115–3122 (2007). 35. Garabrant, D. H. & Philbert, M. A. Review of 2,4-Dichlorophenoxyacetic Acid (2,4-D) Epidemiology and Toxicology. Crit. Rev.
36. Xiong, W. et al. Separation and Quantitation of Three Acidic Herbicide Residues in Tobacco and Soil by Dispersive Solid-Phase Extraction and UPLC–MS/MS. J. Chromatogr. Sci. 52, 1326–1331 (2014).
37. Vander Heyden, Y. et al. Ruggedness tests on the high-performance liquid chromatography assay of the United States Pharmacopeia XXII for tetracycline hydrochloride. A comparison of experimental designs and statistical interpretations. Anal. Chim. Acta 312, 245–262 (1995).
38. Method validation and control procedures for pesticide residues analysis in food and feed. European Commission, Directorate of General Health and Consumer Protection. Document no. SANCO/12571/2013.
39. Dams, R., Huestis, M. A., Lambert, W. E. & Murphy, C. M. Matrix effect in bioanalysis of illicit drugs with LC–MS/MS: influence of ionization type, sample prepara-tion, and biofluid. J. Am. Soc. Mass Spectrom. 14, 1290–1294 (2003).
40. Abreu, S. D., Caboni, P., Cabras, P., Alves, A. & Garau, V. L. A comparison of a gas chromatographic with electron-capture detection and a gas chromatographic with mass spectrometric detection screening methods for the analysis of famoxadone in grapes and wines. J. Chromatogr. A 1103, 362–367 (2006).
41. Eurachem/CITAC guide: Quantifying Uncertainty in Analytical Measurement, Ellison, S.L.R.; Williams, A. (eds), 3th ed., 2012. 42. Jang, J. et al. A matrix sensitive gas chromatography method for the analysis of pymetrozine in red pepper: Application to dissipation
pattern and PHRL. Food Chem. 146, 448–454 (2014).
43. Khodadoust, S. & Hadjmohammadi, M. Determination of N-methylcarbamate insecticides in water samples using dispersive liquid-liquid microextraction and HPLC with the aid of experimental design and desirability function. Anal. Chim. Acta 699, 113–119 (2011).
44. Stalikas, C., Fiamegos, Y., Sakkas, V. & Albanis, T. Developments on chemometric approaches to optimize and evaluate microextraction. J. Chromatogr. A 1216, 175–189 (2009).
45. Box, G. E. P. & Wilson, K. B. On the experimental attainment of optimum conditions. J. R. Stat. Soc. Ser. B 13, 1–45 (1951). 46. Khodadoust, S. & Ghaedi, M. Optimization of dispersive liquid–liquidmicroextraction with central composite design for
preconcentration ofchlordiazepoxide drug and its determination by HPLC-UV. J. Sep. Sci. 36, 1734–1742 (2013).
47. Chen, Z. et al. Response surface methodology for the enantioseparation ofdinotefuran and its chiral metabolite in bee products andenvironmental samples by supercritical fluidchromatography/tandem mass spectrometry. J. Chromatogr. A 1410, 181–189 (2015).
Acknowledgements
This work was supported by the National Natural Science Foundation of China (31301477 and 31401580), with thanks to the University of Liège-Gembloux Agro-Bio Tech, and more specifically the research platform AgricultureIsLife, for funding of this research project.
Author Contributions
B.F. and Z.K. designed the experiments; M.L. and C.D. performed the experiments; Y.H. and Y.T.H. analyzed the data; M.L., C.D. and F.W. co-wrote the manuscript; all the authors reviewed the manuscript.
Additional Information
Supplementary information accompanies this paper at http://www.nature.com/srep Competing financial interests: The authors declare no competing financial interests.
How to cite this article: Li, M. et al. Chemometric-assisted QuEChERS extraction method for post-harvest
pesticide determination in fruits and vegetables. Sci. Rep. 7, 42489; doi: 10.1038/srep42489 (2017).
Publisher's note: Springer Nature remains neutral with regard to jurisdictional claims in published maps and
institutional affiliations.
This work is licensed under a Creative Commons Attribution 4.0 International License. The images or other third party material in this article are included in the article’s Creative Commons license, unless indicated otherwise in the credit line; if the material is not included under the Creative Commons license, users will need to obtain permission from the license holder to reproduce the material. To view a copy of this license, visit http://creativecommons.org/licenses/by/4.0/