HAL Id: hal-03094017
https://hal.archives-ouvertes.fr/hal-03094017
Submitted on 28 May 2021
HAL is a multi-disciplinary open access
archive for the deposit and dissemination of
sci-entific research documents, whether they are
pub-lished or not. The documents may come from
teaching and research institutions in France or
abroad, or from public or private research centers.
L’archive ouverte pluridisciplinaire HAL, est
destinée au dépôt et à la diffusion de documents
scientifiques de niveau recherche, publiés ou non,
émanant des établissements d’enseignement et de
recherche français ou étrangers, des laboratoires
publics ou privés.
Dominique Savary, Arnaud Lesimple, Francois Beloncle, François Morin,
François Templier, A Broc, Laurent Brochard, J Richard, Alain Mercat
To cite this version:
Dominique Savary, Arnaud Lesimple, Francois Beloncle, François Morin, François Templier, et al..
Re-liability and limits of transport-ventilators to safely ventilate severe patients in special surge situations.
Annals of Intensive Care, SpringerOpen, 2020, 10 (1), �10.1186/s13613-020-00782-5�. �hal-03094017�
Savary et al. Ann. Intensive Care (2020) 10:166 https://doi.org/10.1186/s13613-020-00782-5
RESEARCH
Reliability and limits of transport-ventilators
to safely ventilate severe patients in special
surge situations
Dominique Savary
1,2*, Arnaud Lesimple
3,4, François Beloncle
5, François Morin
1, François Templier
1,
Alexandre Broc
6, Laurent Brochard
7,8, Jean‑Christophe Richard
5,9and Alain Mercat
5Abstract
Background: Intensive Care Units (ICU) have sometimes been overwhelmed by the surge of COVID‑19 patients. Extending ICU capacity can be limited by the lack of air and oxygen pressure sources available. Transport ventilators requiring only one O2 source may be used in such places.
Objective: To evaluate the performances of four transport ventilators and an ICU ventilator in simulated severe respiratory conditions.
Materials and methods: Two pneumatic transport ventilators, (Oxylog 3000, Draeger; Osiris 3, Air Liquide Medical Systems), two turbine transport ventilators (Elisee 350, ResMed; Monnal T60, Air Liquide Medical Systems) and an ICU ventilator (Engström Carestation—GE Healthcare) were evaluated on a Michigan test lung. We tested each ventila‑ tor with different set volumes (Vtset = 350, 450, 550 ml) and compliances (20 or 50 ml/cmH2O) and a resistance of 15
cmH2O/l/s based on values described in COVID‑19 Acute Respiratory Distress Syndrome. Volume error (percentage of Vtset) with P0.1 of 4 cmH2O and trigger delay during assist‑control ventilation simulating spontaneous breathing activ‑ ity with P0.1 of 4 cmH2O and 8 cmH2O were measured.
Results: Grouping all conditions, the volume error was 2.9 ± 2.2% for Engström Carestation; 3.6 ± 3.9% for Osiris 3; 2.5 ± 2.1% for Oxylog 3000; 5.4 ± 2.7% for Monnal T60 and 8.8 ± 4.8% for Elisee 350. Grouping all conditions (P0.1 of
4 cmH2O and 8 cmH2O), trigger delay was 50 ± 11 ms, 71 ± 8 ms, 132 ± 22 ms, 60 ± 12 and 67 ± 6 ms for Engström
Carestation, Osiris 3, Oxylog 3000, Monnal T60 and Elisee 350, respectively.
Conclusions: In surge situations such as COVID‑19 pandemic, transport ventilators may be used to accurately control delivered volumes in locations, where only oxygen pressure supply is available. Performances regarding triggering function are acceptable for three out of the four transport ventilators tested.
Keywords: COVID‑19, Acute Respiratory Distress Syndrome, Respiratory failure, Mechanical ventilation, Respiratory mechanics
© The Author(s) 2020. This article is licensed under a Creative Commons Attribution 4.0 International License, which permits use, sharing, adaptation, distribution and reproduction in any medium or format, as long as you give appropriate credit to the original author(s) and the source, provide a link to the Creative Commons licence, and indicate if changes were made. The images or other third party material in this article are included in the article’s Creative Commons licence, unless indicated otherwise in a credit line to the material. If material is not included in the article’s Creative Commons licence and your intended use is not permitted by statutory regulation or exceeds the permitted use, you will need to obtain permission directly from the copyright holder. To view a copy of this licence, visit http://creat iveco mmons .org/licen ses/by/4.0/.
Introduction
During the COVID 19 pandemic, several hospitals experienced the greatest shortage of ventilators ever seen since the heroic times of the polio epidemic in the
1950s. In this context, alternative solutions including ventilator sharing, use of anesthesia ventilators and use of homecare ventilators have been considered to man-age intubated patients with severe lung failure outside the walls of the ICU [1–3]. To be able to replace ICU ventilators in the early phase, ventilators must be rela-tively easy for the users, able to accurately control the delivered volume and provide assist control ventilation
Open Access
*Correspondence: dominique.savary@chu‑angers.fr
1 Emergency Department, University Hospital of Angers, 4, Rue Larrey,
49933 Angers Cedex 9, France
(ACV) in difficult mechanical conditions. Importantly, they must allow to vary FiO2 without requiring two
pressurized sources of gas (i.e., wall air and oxygen at 50 psi). Of note, this is one of the main limits of the homecare ventilators that makes them incompatible for very hypoxemic patients. Several transport ventila-tors are based on pneumatic systems and Venturi sys-tems for gas mixing. Others use an internal turbine for pressurization; but need a pressurized gas source of oxygen to reach high FiO2 values. Pneumatic
trans-port ventilators have been used for decades both for in- and out-of-hospital transport. Their robustness and their relative technological simplicity could potentially facilitate massive industrial production. They represent interesting solutions in this context and could fulfill the mentioned requirements. The general view on these ventilators is, however, that their limitations make them acceptable only for a short period like transport but make them incompatible with the safe delivery of difficult ventilation for very sick patients over pro-longed periods. Undoubtedly, they have limited capaci-ties regarding ventilation modes and monitoring, but knowing whether their reliability is sufficient for deliv-ering lung protective ventilation in patients with ARDS merited to be tested with these objectives in mind. Indeed, discarding their use in a context of surge could limit the extension of beds outside the walls of the ICU for mechanically ventilated patients. Performances of turbine ventilators are often excellent and have been well described [4, 5]. By contrast, limits of pneumatic ventilators have not been specifically tested with the appropriate settings in realistic conditions simulating
the respiratory mechanics of patients with COVID-19 induced ARDS [6–9].
The aim of the present study was to evaluate the relia-bility and the limitations of ventilation provided by these different technologies mimicking patients with COVID-19 induced ARDS in simulated bench conditions of pas-sive and partially assisted situation.
Materials and methods
Performances during volume-controlled (VC) and ACV were evaluated with different conditions of simulated res-piratory mechanics reproducing patients with COVID-19 induced ARDS. All experiments have been performed in the Ventilatory Laboratory of the Angers University Hospital, medical ICU.
Ventilators
Brands
Four transport ventilators necessitating only one O2
pressurized gas source were included in the study. Two pneumatic transport ventilators using Venturi systems to mix air to oxygen were tested: the Oxylog 3000 (Draeger, Lubeck, Germany) and the Osiris 3 (Air Liquide Medical Systems, Antony, France). Two turbine transport venti-lators, necessitating additional oxygen only to increase FiO2 were also tested: the Elisee 350 (ResMed, Sydney,
Australia) and the Monnal T60 (Air Liquide Medical Sys-tems, Antony France). Performances of these ventilators were compared to a standard ICU ventilator: Engström Carestation (GE healthcare, Madison, USA). The charac-teristics of the five ventilators are given in Table 1.
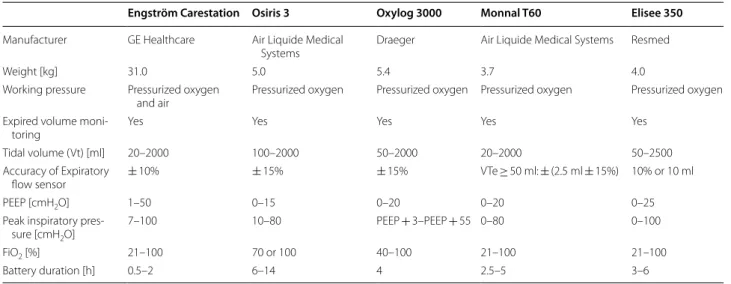
Table 1 General characteristics of the ventilators
PEEP positive end expiratory pressure, FiO2 fraction of inspired oxygen
Engström Carestation Osiris 3 Oxylog 3000 Monnal T60 Elisee 350
Manufacturer GE Healthcare Air Liquide Medical
Systems Draeger Air Liquide Medical Systems Resmed
Weight [kg] 31.0 5.0 5.4 3.7 4.0
Working pressure Pressurized oxygen
and air Pressurized oxygen Pressurized oxygen Pressurized oxygen Pressurized oxygen Expired volume moni‑
toring Yes Yes Yes Yes Yes
Tidal volume (Vt) [ml] 20–2000 100–2000 50–2000 20–2000 50–2500 Accuracy of Expiratory
flow sensor ± 10% ± 15% ± 15% VTe ≥ 50 ml: ± (2.5 ml ± 15%) 10% or 10 ml
PEEP [cmH2O] 1–50 0–15 0–20 0–20 0–25
Peak inspiratory pres‑
sure [cmH2O] 7–100 10–80 PEEP + 3–PEEP + 55 0–80 0–100
FiO2 [%] 21–100 70 or 100 40–100 21–100 21–100
Page 3 of 10 Savary et al. Ann. Intensive Care (2020) 10:166
Working principle and settings
In the two pneumatic transport ventilators tested (Oxy-log 3000 and Osiris 3), the working pressure that gener-ates ventilation comes from the high-pressure oxygen supply. These ventilators based on a “Venturi-distributor” technology work as flow generator.
With the Oxylog 3000, the air-O2 mixing is
regu-lated from 40 to 100% via a Venturi system coupled with a proportional inspiratory valve that also permits to directly set the volume (Vtset). The inspiratory flow
depends on both the respiratory rate (RR) and the Inspiratory:Expiratory (I:E) ratio. In other words, for a given set volume, changing RR and/or I:E ratio keep the set Vt but modifies inspiratory flow. The monitoring of the expired Vt is available via a specific flow sensor inserted between the endotracheal tube and the patient circuit.
With the Osiris 3, only two positions are available for FiO2: 100% or 70%. A Venturi effect is used to obtain a
FiO2 of 70% by mixing ambient air and O2 source.
Inspir-atory flow is delivered through a distributor. For a given combination of I:E ratio and respiratory rate, the Vt is set by directly adjusting a Vt knob that also regulates the inspiratory flow. The monitoring of the expired Vt is available via a specific flow sensor inserted between the endotracheal tube and the patient circuit.
The Elisee 350 and T60 are two turbine-based venti-lators which need oxygen only to adjust FiO2. On those
ventilators, the Vt and the inspiratory flow are directly set on the screen. Changing the respiratory rate does not affect neither Vt nor inspiratory flow. The monitoring of the expired Vt is available via a flow sensor close to the expiratory valve.
The Engström Carestation is a classical high-quality ICU ventilator requiring two sources of pressurized gas for oxygen and air (usually wall pressure at 50–55 psi). The monitoring of the expired Vt is available via a flow sensor located close to the expiratory valve.
Volume delivered and PEEP with different respiratory mechanics
We assessed the volume effectively delivered (Vtemeasured)
by the ventilators in different conditions of respiratory mechanics simulated on a Michigan test lung (Michigan Instruments, Kentwood, MI, USA). A linear pneumot-achograph (PNT 3700 series, Shawnee, USA) and a pres-sure transducer (SD160 series: Biopac systems, Goleta, CA, USA) were used to measure flow and airway pres-sure between the test lung and the patient circuit. Signals were converted with an analog digital converter (MP150; Biopac systems, Goleta, CA, USA) at a sample rate of 200 Hz, and stored in a laptop using a dedicated software
(Acknowledge, Biopac Systems). Vtemeasured was obtained
from numerical integration of the flow signal. All the tests were done in ATPD conditions and not corrected for BTPS conditions.
Three set volumes (Vtset) were tested: 350 ml, 450 ml
and 550 ml, which approximately cover 6 ml/kg of Pre-dicted Body Weight (PBW) for 161 to 199 cm height in male adult patients and 166 to 203 cm height in female adult patients. We also tested 300 mL on the Osiris 3. The different respiratory mechanics conditions tested were compliance of 50 ml/cmH2O and 20 ml/cmH2O, both
combined with a resistance of 15 cmH2O/L/s. The
com-binations of compliance and resistance tested were based on recently described COVID-19 respiratory mechanics [6–9].
Assist Control Ventilation (ACV) mode was selected and similar ventilator settings were applied for each ven-tilator (respiratory rate 30 cycles/min).
The pneumatic transport ventilators were set with an Inspiratory:Expiratory ratio of 1:3 (I:E), whereas a flow of 60 l/min was adjusted on the Engström Carestation, Elisee 350 and Monnal T60. For every condition tested, inspiratory flow was measured.
The three set volumes were tested with FiO2 100% and
70% as follows: FiO2 was selected, Vtset was adjusted on
the ventilator and Vtemeasured was recorded and averaged
over 5 cycles after stabilization. As Osiris 3 does not have an oxygen sensor to monitor oxygen content, FiO2 was
measured on this ventilator when air-O2 mix was selected
with a PF300 gas analyzer (IMT Medical, Buchs, Switzer-land) in different conditions (Vt = 350–450–550 ml and Compliance = 20–50 ml/cmH2O).
The performances of Venturi-based ventilation in terms of volume delivery could be altered by set inspira-tory flow values [10]. To assess in the Osiris 3 the impact of the inspiratory flow on Vteerror, we tested a Vtset of
450 ml obtained with different inspiratory flows achieved by changing respiratory rate (RR). ACV mode with air-O2 mix was selected, a resistance of 15 cmH2O/l/s and
a compliance of 20 ml/cmH2O were applied and we set
a I:E ratio of 1:3. The lowest RR (6 cycles/min) was cho-sen and was progressively increased by 4 cycles/min until reaching the maximum RR of 40 cycles/min. Vtset had to
be adjusted in consequence at each RR increment to keep its value at 450 ml. Vteerror was estimated at each step.
Two levels of PEEP were applied (10 cmH2O and
15 cmH2O) and the accuracy of the effective PEEP
(PEEPmeasured) was assessed.
Volume error and PEEP end‑points
The relative volume error (Vteerror), which is the
differ-ence between the effective expired volume (Vtemeasured)
previously described over the four different conditions [4,
11]:
The relative volume error was expressed in percentage and defined as follows:
End-point for Vterror The three tidal volumes tested
were chosen to cover theoretical “6 ml/kg PBW” in adult male or female patients (350, 450 and 550 ml correspond to 6 ml/kg PBW for, respectively 58, 75 and 92 kg PBW).
Ventilation was considered safe and acceptable when Vtemeasured was within ± 0.5 ml/kg PBW, which covers
a volume between 5.5 and 6.5 ml/kg PBW. This corre-sponds to an 8% difference between set and measured Vt.
End-point for PEEP A difference between measured
PEEP and set PEEP was acceptable when less than 2 cmH2O.
Trigger performances
Assist control ventilation (ACV) with the inspiratory trigger function “on” was tested by connecting ven-tilators to the double chamber Michigan test lung to
Resistance = 15 cmH2O/l/s, Compliance
= 20 or 50ml/cmH2O, PEEP
= 10 or 15 cmH2O
Vteerror =
|Vtemeasured− Vteset|
Vteset
×100
simulate spontaneous breathing (see Fig. 1). One cham-ber of the test lung was defined as the driving lung, while the other chamber was connected to the ventila-tor being tested. A lung-coupling clip allowed a con-nection between the two chambers, so that a positive pressure created in the driving lung induced a negative pressure in the experimental lung, leading to trigger the ventilator tested.
The driving lung was connected to an Evita XL ven-tilator (Draeger, Lubeck, Germany), which was set in volume-controlled mode with constant flow. The respira-tory rate was set at 25 breaths/min. The ventilarespira-tory set-tings were chosen to achieve a moderate effort, with a decrease in airway pressure 100 ms after occlusion (P0.1)
of 4 cmH2O (consistent with P0.1 value recently described
in COVID patients [12] measured at the airway opening of the lung model [13, 14]. A level of PEEP was applied to the driving lung to obtain a perfect contact of the lung-coupling clip between the two chambers at the end of expiration.
For each ventilator tested, volume assist-control ven-tilation (ACV) mode was selected, with a tidal volume of 450 ml, a respiratory rate of 20 cycles/min and a PEEP of 10 cmH2O. I:E ratio was set at 1:3 for Osiris
3 and Oxylog 3000, while a flow of 60 l/min was set on Elisee 350, Monnal T60 and the Engström Carestation ICU ventilator. Inspiratory triggers were set at their most responsive position while avoiding auto-trigger-ing. The trigger of the Osiris 3 was set at − 0.5 cmH2O.
Fig. 1 Illustration of bench test to simulate spontaneous breathing to assess trigger performances. The figure illustrates the bench test used
to simulate spontaneous breathing to assess trigger performances. A double chamber Michigan test lung was used to simulate spontaneous breathing. One chamber of the test lung was defined as the driving lung while the other chamber was connected to the ventilator being tested. A lung‑coupling clip allowed a connection between the two chambers, so that a positive pressure created in the driving lung (by the driving ventilator) induced a negative pressure in the experimental lung (“exp. Lung” on the figure), leading to trigger the ventilator tested. Of note, only one chamber of the test lung (experimental lung) is used to assess Vte error whereas the two chambers (driving lung and experimental lung) are used to simulate spontaneous breathing to assess trigger performances
Page 5 of 10 Savary et al. Ann. Intensive Care (2020) 10:166
Flow-triggered ventilators were set at 1 l/min for Eng-ström Carestation and Oxylog 3000 and 2 l/min for Monnal T60 and Elisee 350. Two respiratory mechanics were tested: C = 20 ml/cmH2O and 50 ml/cmH2O with
R = 15 cmH2O/l/s.
For each configuration, trigger performance was assessed by measuring the airway pressure changes using the flow trace to determine the start of inspira-tion [11, 15]. Negative pressure drop (∆P, cmH2O),
Triggering Delay (TD, ms) and Pressurization Delay (PD, ms) as defined in Fig. 2 were measured. The over-all Inspiratory Delay (ID) corresponds to the addition of TD and PD.
We repeated the tests for all the ventilators at a strong effort corresponding to a P0.1 of 8 cmH2O; we tested the
effect of set volume (Vtset = 350–450–550 ml),
compli-ance (C = 20–50 ml/cmH2O) and Positive End Expiratory
Pressure (PEEP = 5–10–15 cmH2O) on triggering delay
performances (see Additional file 1).
End-point Triggering function was considered as “safe
and acceptable” when TD was less than 100 ms [16].
Statistical analysis
Continuous variables were expressed as mean ± SD val-ues averaged from 5 consecutive breaths. These vari-ables were compared using an ANOVA test. The type I significance level was set at 0.05. When the global F was significant, post hoc tests were computed using a stu-dent t test with Bonferroni correction, which sets the level of significance for pairwise differences between the five ventilators at 0.005.
Results
Volume delivered and PEEP measured with different respiratory mechanics
Results obtained with a P0.1 of 4 cmH2O (moderate
effort) are displayed in Fig. 3 and mean volume errors (Vteerror) for each ventilator are shown in Table 2.
When all conditions and set volumes were included, the Engström Carestation was the most accurate venti-lator, and the Oxylog 3000 was comparable. The perfor-mance was considered as acceptable (delta Vt ± 0.5 ml/ kg PBW) except for one turbine ventilator (Elisee 350). The impact of FiO2 selection (FiO2 100% or 70%) on
volume error was significant considering all ventilators (p < 0.05, see Table 2). There was no impact of compli-ance on volume error (p > 0.05, Table 2). FiO2 measured
on Osiris 3 was 72.3 ± 1.7% across all the conditions tested. Differences between measured PEEP and set PEEP were less than 2 cmH2O as shown in Table 2 (all
conditions together).
Volume delivered at a Vtset of 300 ml for the Osiris 3
is shown in Additional file 1: Figure S1. Additional file 1: Table S1 summarizes measured inspiratory flow for each ventilator in the different experimental conditions.
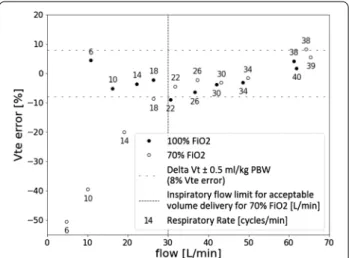
Impact of inspiratory flow on pneumatic ventilators
The effect of inspiratory flow rates on Vteerror for Osiris
3 is shown in Fig. 4. Considering a Vtset of 450 ml, the
lowest values of inspiratory flow were associated with a Vteerror higher than 8% (delta Vt ± 0.5 ml/kg PBW).
Per-formances were acceptable when inspiratory flow (result-ing from the combination of Vt, I:E ratio and respiratory rate) was strictly above 30 l/min, which corresponds to a respiratory rate higher than 18 cycles/min.
Trigger performances during ACV
Inspiratory trigger was evaluated for each ventilator and results corresponding to a moderate effort (P0.1 = 4
cmH2O) are displayed in Fig. 5. All simulated efforts
triggered a ventilatory cycle. The Triggering Delay was 42 ± 4 ms, 65 ± 5 ms, 151 ± 14 ms, 51 ± 6 ms and 64 ± 5 ms for Engström Carestation, Osiris 3, Oxylog 3000, Monnal T60 and Elisee 350, respectively (all con-ditions grouped, p < 0.05; pairwise differences between ventilators were all significant with a p-value < 0.005). The Inspiratory Delay (ID) was measured at 54 ± 5 ms for Engström Carestation, 95 ± 5 ms for Osiris 3, 217 ± 21 ms for Oxylog 3000, 72 ± 6 ms for Monnal T60 and 85 ± 7 ms for Elisee 350 and (p < 0.05; pairwise dif-ferences between ventilators were all significant with a
p-value < 0.005).
The airway pressure drop was much larger for Oxy-log 3000 (− 4.2 ± 0.3 cmH2O), than for the others:
TD PD ID ∆P Time (s) Airway pressure (cm H2 O) Time (s) Flow (L/min)
Fig. 2 Explicative figure of ventilator triggering assessment. The
figure illustrates ventilator triggering assessment. Airway pressure (Paw) and flow are displayed. Triggering delay (TD) is the delay between the onset of airway pressure drop (“patient” effort) and flow delivery by the ventilator. Pressurization delay (PD) is defined by the time at which the airway pressure comes back to the level of PEEP. The addition of TD and PD gives the inspiratory delay (ID). The drop of airway pressure (∆P) due to patient effort is also shown on the figure
− 0.9 ± 0.3 cmH2O for Engström Carestation, − 1.9 ± 0.1
cmH2O for Osiris 3, − 0.6 ± 0.1 cmH2O for Monnal T60
and − 0.8 ± 0.1 for Elisee 350 (p < 0.05; pairwise differ-ences between ventilators were all significant with a
p-value < 0.005, except between Engstrom
Carestation-Elisee 350 and Engstrom Carestation-Monnal T60).
Ventilator performances were considered acceptable (TD < 100 ms) except for one pneumatic ventilator (Oxy-log 3000).
Triggering Delays obtained with a strong effort (P0.1 = 8
cmH2O) are available in Additional file 1: Figure S2.
Grouping all conditions (P0.1 of 4 cmH2O and 8 cmH2O),
Fig. 3 Tidal Volume delivery in volume control ventilation in static conditions. a The histogram represents the mean expired volumes measured
for each ventilator according to the three Vt set in 100% FiO2. The average was computed over the four conditions of resistance (15 cmH2O/l/s), compliance (20–50 ml/cmH2O) and PEEP (10–15 cmH2O). The three tidal volumes tested were chosen to cover 6 ml/kg PBW, with 350, 450 and 550 ml corresponding to 6 ml/kg PBW for respectively 58, 75 and 92 kg PBW. Limits of acceptable ventilation are displayed with dotted lines and defined as a volume change within ± 0.5 ml/kg PBW, which corresponds to a Vt between 5.5 and 6.5 ml/kg PBW. b The histogram represents the mean expired volumes measured for each ventilator according to the three Vt set in 70% FiO2. The average was computed over the four conditions of resistance (15 cmH2O/l/s), compliance (20–50 ml/cmH2O) and PEEP (10–15 cmH2O)
Table 2 Mean volume errors and Positive End Expiratory Pressure 1 (PEEP) measured for each ventilator
Vteerror global = mean volume error including all conditions of resistance (15 cmH2O/l/s), compliance (20–50 ml/cmH2O) and PEEP (10–15 cmH2O) for both 100% FiO2 and 70% FiO2. Vteerror 100% FiO2= mean volume error including all conditions of resistance (15 cmH2O/l/s), compliance (20–50 ml/cmH2O) and PEEP (10–15 cmH2O) for 100% FiO2, Vteerror 70% FiO2= mean volume error including all conditions of resistance (15–12 cmH2O/l/s), compliance (20–50 ml/cmH2O) and PEEP (10–15 cmH2O) for 70% FiO2. Vteerror C50 = mean volume error including all conditions of 1 resistance (15 cmH2O/l/s), FiO2 (100–70%) and PEEP (10–15 cmH2O) for a compliance of
50 ml/cmH2O. teerror C20 = mean volume error including all conditions of resistance (15 cmH2O/l/s), FiO2 (100–70%) and PEEP (10–15 cmH2O) for a compliance of 20 ml/cmH2O, Mean PEEP 10 = mean PEEP measured when PEEP was set at 10 cmH2O including all conditions of resistance (15 cmH2O/l/s) and compliance (20–50 ml/ cmH2O) for both 100% FiO2 and 70% FiO2. Mean PEEP 15 = mean PEEP measured when PEEP was set at 15 cmH2O including all conditions of resistance (15 cmH2O/l/s) and compliance (20–50 ml/cmH2O) for both 100% FiO2 and 70% FiO2
*p < 0.005 when comparing each transport ventilator with the Engstrom ICU ventilator (ANOVA test: global F was significant)
Engström Carestation Osiris 3 Oxylog 3000 Monnal T60 Elisee 350
Vteerror global [%] 2.9 ± 2.2 3.6 ± 3.9 2.5 ± 2.1 5.4 ± 2.7 (*) 8.8 ± 4.8 (*) Vteerror 100% FiO2 [%] 1.0 ± 0.7 3.7 ± 3.7 (*) 2.0 ± 1.2 (*) 3.3 ± 1.4 (*) 11.9 ± 4.1 (*) Vteerror 70% FiO2 [%] 4.9 ± 1.3 3.5 ± 4.2 2.9 ± 2.7 (*) 7.5 ± 2.0 (*) 5.9 ± 3.5 Vteerror C50 [%] 3.3 ± 2.7 3.4 ± 4.0 1.6 ± 1.1 (*) 5.1 ± 3.1 (*) 10.4 ± 5.3 (*) Vteerror C20 [%] 2.6 ± 1.6 3.8 ± 3.8 3.4 ± 2.6 5.7 ± 2.2 (*) 7.0 ± 3.7 (*) Mean PEEP 10 [cmH2O] 9.9 ± 0.2 10.6 ± 0.6 (*) 11.5 ± 0.3 (*) 9.5 ± 0.5 (*) 10.3 ± 0.1 (*) Mean PEEP 15 [cmH2O] 15.1 ± 0.2 14.9 ± 0.6 (*) 15.4 ± 2.2 14.7 ± 0.1 (*) 15.4 ± 0.2 (*)
Page 7 of 10 Savary et al. Ann. Intensive Care (2020) 10:166
trigger delay was 50 ± 11 ms, 71 ± 8 ms, 132 ± 22 ms, 60 ± 12 and 67 ± 6 ms for Engström Carestation, Osiris 3, Oxylog 3000, Monnal T60 and Elisee 350, respectively. The effect of set volume, compliance and PEEP on trig-gering delay performances (at P0.1 = 8 cmH2O) are shown
in Additional file 1: Tables S2, S3 and S4, respectively.
Discussion
The results of the present bench test study comparing turbine and pneumatic transport ventilators to an ICU ventilator, can be summarized as follows: 1. Turbine ven-tilators’ performances in VC and ACV are very close to those of the ICU ventilator tested for most of the set-tings including volume delivery and reliability of PEEP. 2. For most of the severe respiratory mechanics condi-tions tested, the volume error does not exceed 0.5 ml/kg PBW except for one turbine ventilator (two conditions) and one pneumatic ventilator (one condition). Volume error delivered by the simplest pneumatic ventilator sig-nificantly increased at FiO2 70%, when inspiratory flow
was less than 30 l/min indicating a technological limit of the Venturi system. 3. Inspiratory trigger reactivity was less than 100 ms except for one pneumatic transport ventilator.
The increasing number of patients requiring mechani-cal ventilation in the context of the COVID-19 world-wide crisis, and the ventilators shortage reported in some
Fig. 4 Impact of flow on effective volume with Osiris 3 ventilator.
This figure shows the volume error of the Osiris 3 expressed in percentage of Vt set according to different inspiratory flows obtained at a constant 450 ml Vt set. Compliance, resistance and PEEP were set at 20 ml/cmH2O, 15 cmH2O/l/s and 10 cmH2O respectively. Black circles were obtained with 100% FiO2 while the white circles were obtained with 70% FiO2. Respiratory rate associated with each point is also displayed. This figure illustrates that for an inspiratory flow below 30 l/min, the Vt error is substantial with 70% FiO2. The Vt error is within ± 0.5 ml/kg PBW (which corresponds to an 8% difference between set and measured Vt) whatever the inspiratory flow when 100% FiO2 is selected
Fig. 5 Triggering characteristics in volume assist‑control ventilation for a P0.1 of 4 cmH2O. The figure illustrates the triggering efficiency for each ventilator tested during assist‑control ventilation using the Michigan test lung to simulate spontaneous breathing. A moderate effort was achieved, corresponding to a decrease in airway pressure 100 ms after occlusion (P0.1) of 4 cmH2O was achieved. A PEEP of 10 cmH2O, a compliance of 20 and 50 ml/cmH2O and a resistance of 15 cmH2O/l/s were selected. Triggering Delay (TD, ms) and Pressurization Delay (PD, ms) were computed. A definition of TD and PD is available on Fig. 1. Triggering function was considered safe and acceptable when TD was less than 100 ms. *p < 0.005 for TD when comparing each transport ventilator with the Engstrom ICU ventilator (ANOVA test: global F was significant). Δp < 0.005 for PD when comparing each transport ventilator with the Engstrom ICU ventilator (ANOVA test: global F was significant)
severely affected countries, has led to discuss the possi-bilities to manage intubated patients outside the walls of the ICU [2]. According to this dire scenario, simple and easy to set ventilators that only require one oxygen pres-sure source to function and able to reliably deliver lung protective ventilation could be considered. In addition, an assisted mode that controls the Vt with PEEP up to 15 cmH2O and FiO2 up to 100% is required to manage
patients with high elastic load and severe shunt that char-acterize potentially severe COVID-19 ARDS [1, 2].
Performances during controlled ventilation
Recent turbine transport and emergency ventilators dis-play performances which are very close to conventional ICU ventilators [5, 17]. In the context of “mass casualty”, as experienced with the COVID-19 crisis, pneumatic transport ventilators could be used to extend the possi-bility to manage intubated patients in case of ICU beds shortage. The working principle of these pneumatic ven-tilators is based on a “Venturi system” which is a simple technological solution that permits to manage ventila-tion generated by the oxygen pressurized source when a position called air-O2 mix is selected. Interestingly, the
simplicity of such pneumatic systems permits to con-sider massive industrialization faster and at a lower cost. On the opposite, the Venturi system explains the limits observed with low inspiratory flow previously described with this technology [10].
For pneumatic ventilators, in case of high impedance, a low inspiratory flow may increase significantly volume error when the air-O2 mix position is selected “on”. In
turn, manipulating I:E ratio, respiratory rate and increas-ing inspiratory flow above 30 l/min permits to reverse the Vt error that is directly explained by the working princi-ple of this ventilator (see Fig. 4). The technological adap-tations available on Oxylog 3000 (Venturi coupled with proportional inspiratory valve) solve this problem, while expired Vt monitoring available on Osiris 3 simplifies set-tings adaptation if required. Previous bench test studies have reported a Vt error with pneumatic basic transport ventilators that reached 20% of set Vt with resistive load [10, 18]. These experiments were performed with very low set inspiratory flow thus explaining the Vt reduction observed. For clinical practice, when FiO2 70% is used on
the Osiris 3, an essential recommendation is to follow these steps: first adjust the I:E ratio at 1:3 (i.e., the mini-mal available value) and the respiratory rate at 18/min or above. Secondarily, the Vt knob that also controls the inspiratory flow must be adjusted to reach the desired Vt based on Vt expired monitoring. With these recommen-dations, volume error measured on pneumatic transport ventilators at low compliance is close from turbine per-formances and acceptable.
Of note, only the ICU and turbine ventilators tested compensate for the loss in Vt due to the compression of gas inside the circuit. Nevertheless, this effect previously quantified in ICU ventilators with inspiratory–expiratory circuits is significantly less in basic transport ventilators, since they are equipped with a single limb circuit [4]. Of note, an HEPA filter can be easily adjusted on the expira-tory limb to limit risks of viral contamination.
Performances during assisted ventilation
Recent experience with COVID-19 induced ARDS reports that these patients often exhibit high respiratory drive and asynchrony that may require deep sedation and sometimes paralysis [7]. We, therefore, evaluated the behavior of the four transport ventilators during triggered breaths, especially pneumatic ones, since per-formances of their trigger have been questioned [5, 18]. The triggering performances were acceptable except for the Oxylog 3000 exhibiting the poorest triggering perfor-mances. The triggering delay was consistently longer in pneumatic ventilators but acceptable except on the Oxy-log 3000, compared to the ICU ventilator [5].
Limitations
The results obtained in vitro necessitate some caution to be translated to the clinical practice, but previous studies showed that this type of simulation predicts the results observed in clinical situations with a high fidel-ity [4, 19, 20]. The lung model gives the unique oppor-tunity to compare ventilator performances according to several simulated but standardized clinical conditions. Bench experiment also permits to accurately depict and understand advantages and limits of the different ventila-tor’s technologies as previously done [10]. The Michigan test lung (Michigan Instruments, Kentwood, MI, USA) used in the present study is a simple model that presents obvious limitations, but its reliability for Vt and trigger performances evaluation has been well demonstrated. Of note, the results have not been corrected in BTPS conditions, which may have slightly underestimated actual expired volumes [17]. Our experiment reported performances of only two pneumatic and two turbine ventilators, while several other ventilators with similar technology are available worldwide. We did not evaluate pressure support ventilation, while this approach can be useful to manage weaning of COVID-19 patients. Previ-ous studies already showed that turbine-based ventilator significantly outperform pneumatic transport ventilators during pressure mode ventilation [5, 17].
Performances of pneumatic ventilators can be viewed as “acceptable” during the initial phase of respiratory fail-ure. For patients with difficulties to be separated from
Page 9 of 10 Savary et al. Ann. Intensive Care (2020) 10:166
the ventilator, better performances may be expected for assisted ventilation.
Conclusion
The present bench study suggests that turbine technolo-gies may acceptably replace ICU ventilators, at least transiently, to extend ICU beds, where only oxygen pres-sure supply is available, in special surge situations such as COVID-19 crisis. Pneumatic transport ventilators are limited in terms of FiO2 settings, but provide acceptable
volume accuracy in severe simulated conditions. For this purpose, the respiratory rate should be set at or above 18/ min (to maintain sufficient inspiratory flow) in the Osi-ris 3 with a FiO2 of 70% [21]. A monitoring of expired
Vt available on the two pneumatic transport ventilators tested greatly facilitates adequate settings. Performances regarding triggering function are non-acceptable in one of the pneumatic transport ventilators.
Supplementary information
Supplementary information accompanies this paper at https ://doi.
org/10.1186/s1361 3‑020‑00782 ‑5.
Additional file 1. Addiional tables and figures.
Abbreviations
ACV: Assist‑Control Ventilation; ARDS: Acute Respiratory Distress Syndrome; COVID‑19: Coronavirus Disease 2019; CRS: Compliance of the respiratory sys‑
tem; FiO2: Fraction of inspired oxygen; ICU: Intensive Care Unit; PEEP: Set Posi‑
tive End‑Expiratory Pressure; SARS‑CoV‑2: Severe Acute Respiratory Syndrome Coronavirus‑2; VC: Volume control; Vt: Tidal volume.
Acknowledgements
Authors would like to greatly acknowledge Nathan Prouvez and Bilal Badat for their contribution to the bench experiments. Authors are also grateful to Marie‑Laure Evrat for having made ventilators available for the tests despite the COVID crisis.
Authors’ contributions
AL, JCR and AM contributed to the study conception and design. AL, JCR performed the experiments, the data collection and the initial data analysis. JCR, LB and AM prepared the first draft of the manuscript. All authors contrib‑ uted to the data analysis and to the critical revision of the final manuscript. All authors read and approved the final manuscript.
Funding
Not applicable.
Availability of data and materials
The datasets analyzed during the current study are available from the cor‑ responding author on reasonable request.
Ethics approval and consent to participate
Not applicable.
Consent for publication
Not applicable.
Competing interests
DS reports Grants from Fisher and Paykel and travel fees from Air Liquide Medical Systems. JCR reports part time salary for research activities (Med2Lab)
from Air Liquide Medical Systems and Vygon and grants from Creative Air Liq‑ uide, outside this work. AL is PhD student in the (Med2Lab) partially funded by Air Liquide Medical Systems. BB is research engineer in the Med2Lab funded by Air Liquide Medical Systems. AB is master student from the Telecom‑Physic‑ Strasbourg Strasbourg University France. FB reports personal fees from Löwen‑ stein Medical, travel fees from Draeger and research support from Covidien, GE Healthcare and Getinge Group, outside this work. AM reports personal fees from Draeger, Faron Pharmaceuticals, Air Liquid Medical Systems, Pfizer, Resmed and Draeger and grants and personal fees from Fisher and Paykel and Covidien, outside this work. All other authors declare no competing interests. This study did not receive any grant or financial support.
Author details
1 Emergency Department, University Hospital of Angers, 4, Rue Larrey,
49933 Angers Cedex 9, France. 2 Inserm, EHESP, University of Rennes, Irset
(Institut de Recherche en Santé, Environnement et Travail) ‑ UMR_S 1085, 49000 Angers, France. 3 CNRS, INSERM 1083, MITOVASC, Université d’Angers,
Angers, France. 4 Med2Lab, ALMS, Antony, France. 5 Critical Care Department,
Angers University Hospital, Angers, France. 6 The Telecom‑Physic‑Strasbourg,
Strasbourg University, Strasbourg, France. 7 Keenan Research Centre for Bio‑
medical Science, Li Ka Shing Knowledge Institute, St. Michael’s Hospital, Toronto, Canada. 8 Interdepartmental Division of Critical Care Medicine, Uni‑
versity of Toronto, Toronto, Canada. 9 INSERM, UMR 955 Eq 13, Toronto, Canada.
Received: 19 September 2020 Accepted: 25 November 2020
References
1. Beitler JR, Mittel AM, Kallet R, Kacmarek R, Hess D, Branson R, et al. Ventila‑ tor sharing during an acute shortage caused by the COVID‑19 pandemic. Am J Respir Crit Care Med. 2020;2:9.
2. Emanuel EJ, Persad G, Upshur R, Thome B, Parker M, Glickman A, et al. Fair allocation of scarce medical resources in the time of Covid‑19. N Engl J Med. 2020;382(21):2049–55.
3. Monti G, Cremona G, Zangrillo A, Lombardi G, Sartini C, Sartorelli M, et al. Home ventilators for invasive ventilation of patients with COVID‑19. Crit Care Resuscitation. 2020;30:5.
4. Lyazidi A, Thille AW, Carteaux G, Galia F, Brochard L, Richard JCM. Bench test evaluation of volume delivered by modern ICU ventilators during volume‑controlled ventilation. Intensive Care Med. 2010;36(12):2074–80. 5. L’Her E, Roy A, Marjanovic N. Bench‑test comparison of 26 emergency
and transport ventilators. Crit Care. 2014;18:5.
6. Pan C, Chen L, Lu C, Zhang W, Xia J‑A, Sklar MC, et al. Lung Recruitability in SARS‑CoV‑2 associated acute respiratory distress syndrome: a single‑ center, observational study. Am J Respir Crit Care Med. 2020;9:1. 7. Gattinoni L, Coppola S, Cressoni M, Busana M, Rossi S, Chiumello D.
Covid‑19 Does Not Lead to a “Typical” Acute Respiratory Distress Syn‑ drome. Am J Respir Crit Care Med. 2020;30:202003.
8. Gattinoni L, Chiumello D, Caironi P, Busana M, Romitti F, Brazzi L, et al. COVID‑19 pneumonia: different respiratory treatments for different phenotypes? Intensive Care Med. 2020. https ://doi.org/10.1007/s0013 4‑020‑06033 ‑2.
9. Grasselli G, Zangrillo A, Zanella A, Antonelli M, Cabrini L, Castelli A, et al. Baseline characteristics and outcomes of 1591 patients infected with SARS‑CoV‑2 Admitted to ICUs of the Lombardy Region, Italy. JAMA. 2020;323(16):1574.
10. Breton L, Minaret G, Aboab J, Richard J‑C. Fractional inspired oxygen on transport ventilators: an important determinant of volume delivery dur‑ ing assist control ventilation with high resistive load. Intensive Care Med. 2002;28(8):1181.
11. Boussen S, Gainnier M, Michelet P. Evaluation of ventilators used during transport of critically ill patients: a bench study. Respir Care. 2013;58(11):1911–22.
12. Gattinoni L, Marini JJ, Camporota L. The respiratory drive: an over‑ looked tile of COVID‑19 pathophysiology. Am J Respir Crit Care Med. 2020;202(8):1079–80.
13. Beloncle F, Piquilloud L, Olivier P‑Y, Vuillermoz A, Yvin E, Mercat A, et al. Accuracy of P01 measurements performed by ICU ventilators: a bench study. Ann Intensive Care. 2019;9(1):104.
14. Telias I, Junhasavasdikul D, Rittayamai N, Piquilloud L, Chen L, Ferguson ND, et al. Airway occlusion pressure as an estimate of respiratory drive and inspiratory effort during assisted ventilation. Am J Respir Crit Care Med. 2020;201(9):1086–98.
15. Richard J‑C, Carlucci A, Breton L, Langlais N, Jaber S, Maggiore S, et al. Bench testing of pressure support ventilation with three different genera‑ tions of ventilators. Intensive Care Med. 2002;28(8):1049–57.
16. Aslanian P, ElAtrous S, Isabey D, Valente E, Corsi D, Harf A, et al. Effects of flow triggering on breathing effort during partial ventilatory support. Am J Respir Crit Care Med. 1998;157(1):135–43.
17. Thille AW, Lyazidi A, Richard JCM, Galia F, Brochard L. A bench study of intensive‑care‑unit ventilators: new versus old and turbine‑based versus compressed gas‑based ventilators. Intensive Care Med. 2009;35(8):1368–76.
18. Zanetta G, Robert D, Guérin C. Evaluation of ventilators used dur‑ ing transport of ICU patients—a bench study. Intensive Care Med. 2002;28(4):443–51.
19. Carteaux G, Lyazidi A, Cordoba‑Izquierdo A, Vignaux L, Jolliet P, Thille AW, et al. Patient‑ventilator asynchrony during noninvasive ventilation. Chest. 2012;142(2):367–76.
20. Vignaux L, Tassaux D, Jolliet P. Performance of noninvasive ventilation modes on ICU ventilators during pressure support: a bench model study. Intensive Care Med. 2007;33(8):1444–51.
21. Garnier M, Quesnel C, Fulgencio J‑P, Degrain M, Carteaux G, Bonnet F, et al. Multifaceted bench comparative evaluation of latest intensive care unit ventilators. Br J Anaesth. 2015;115(1):89–98.
Publisher’s Note
Springer Nature remains neutral with regard to jurisdictional claims in pub‑ lished maps and institutional affiliations.