Damage Accumulation in Graphite/Epoxy
Laminates due to Cyclic Gradient Stress Fields
by
KENNETH JOHN BONELLO
B.S.M.E. GMI Engineering & Management Institute (1988)
SUBMITTED IN PARTIAL FULFILLMENT OF THE REQUIREMENTS FOR THE DEGREE OF
MASTER OF SCIENCE IN
AERONAUTICS AND ASTRONAUTICS AT THE
MASSACHUSETTS INSTITUTE OF TECHNOLOGY May, 1990
© Massachusetts Institute of Technology 1990
Signature of Author
Certified by
Thesis Supervisor,
Department a-eronautics'and Astronautics May 11, 1990
7/
Prof. Paul A. Lagace
Department of (eronautics and Astronautics
Accepted by
IProf. Harold Y. Wachman Chairman, Department Graduate Committee
JUN 19 1990
Damage Accumulation in Graphite/Epoxy Laminates due
to
Cyclic Gradient Stress Fields
by
Kenneth J. Bonello
Submitted to the Department of Aeronautics and Astronautics on May 11th, 1990 in partial fulfillment of the requirements for the Degree of Master of Science
Abstract
The progression of damage in gradient stress fields under cyclic loading was studied in simply-supported graphite/epoxy beam-columns.
Three layups, [454/-454/(0/90)412s, [±45/0/904]4s, and [(452/-452/0)2/905]2s, were
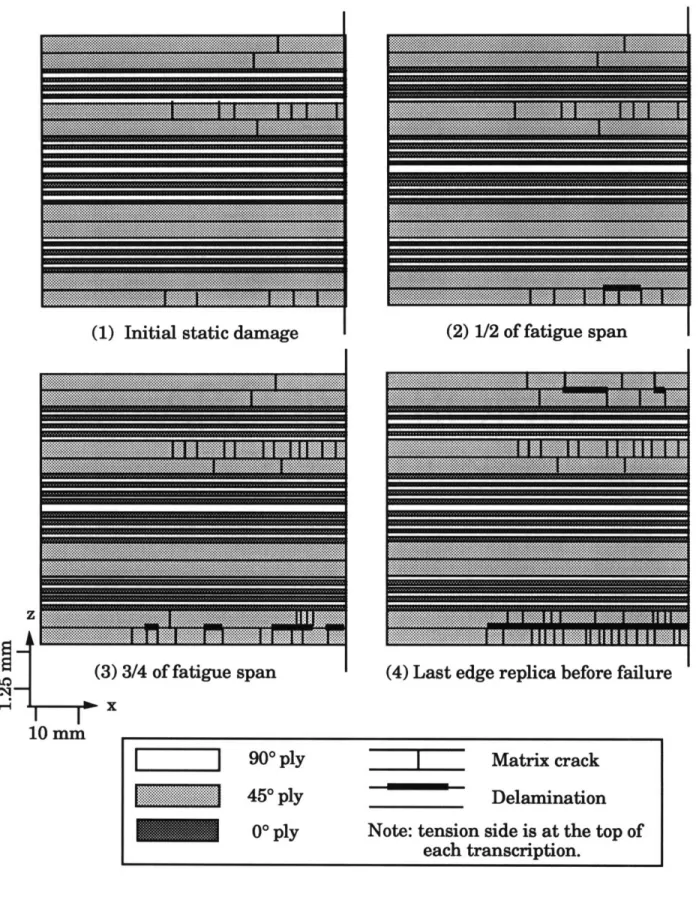
chosen to be consistent with data collected in a previous study with static loading. Specimens were loaded statically until predetermined characteristic damage levels were obtained, after which cyclic loading began. Cyclic tests were run in load control at an R ratio of ten and a frequency of 1.5 Hz. At specific intervals, cyclic loading was stopped, a static test measuring the load and the corresponding center deflection was performed, and edge replicas of the specimen's sides were taken. Cyclic loading was then resumed until the next interval or final failure. Damage histories were pieced together for each laminate type under different maximum cyclic load levels. The damage of these specimens varied both along the length and through the thickness of the specimens with two modes of damage present. Damage due to the static loading occurred on the tension side of the specimen and was controlled by matrix cracks. Delaminations initiated and grew in areas of crack saturation. Damage due to the cyclic loading also occurred on the compression side of the specimens and was controlled by delaminations which initiated and grew independently of matrix cracks, leading to sublaminate buckling. These compression side delaminations did not initiate in static tests to failure. Increasing the maximum cyclic load changed the relative growth of the two modes of damage, thus changing the failure mode. The stiffness of the specimens increased slightly with cyclic loading but steadily declined thereafter. Stiffness degradation was less than 6% until just prior to failure. Because cyclic loading revealed critical damage modes not found with static loading, cyclic loading should be used when ascertaining all possible damage modes. Using higher cyclic load levels to reduce testing time can hide critical damage modes with the potential of overestimating cyclic lifetime.
Thesis Supervisor: Paul A. Lagace
Acknowledgements
As I prepare to return to the Motor City, it occurs to me that a work such as this is hardly the effort of one person. There are many people involved, whether providing technical input and guidance to the project itself or providing friendship and support. It is these people who have been a part of my world over the last two years that have made this thesis possible.
I would not be at MIT were it not for the brilliant insightfulness of Prof. Paul Lagace. Thank you for giving me the opportunity to come to MIT and to do my research in TELAC. Your guidance, suggestions, and what seemed like endless review of this thesis have shaped it to what it is. The whole experience has been worthwhile and I learned a lot.
The experimental work would not have flowed as smoothly (if at all) without the help of Al Supple. Much thanks for your advice and patience. I would like to thank Prof. Michael Graves, Prof. John Dugundji, and Prof. James Mar for your helpful comments and questions during the final
stages of this work. I would also like to thank Ping Lee for being patient with all of my questions. I would probably be still testing without the help of my UROP, Mike Clarke. I appreciate your dedication and assistance.
An important asset of TELAC is the group of graduate students that make up the lab. Whether on a technical, academic, social, or personal basis, there is always someone willing to listen and help (or go to the
Muddy). Thank you Kevin, Chris, Pierre, Kiernan, Peter, Narendra
(Bhatman), Wilson, Adam, Randy, Claudia, Tom, Teresa (Reese), Ed, Wai Tuck, Luca, and Kim for your friendship. I would also like to thank James
(even though you're from GT) for being a friend and maintaining some reality in my life. If I forgot someone, I'm sorry, I'm just a bozo.
There are several people who were a part of my life away from the lab these last two years. From Gordon (Gordex), Abbas (Mofo), Alex (Alecchh), and Mike, to the rest of the DT, Dan, Eric, Leif, and Smoothy, I say thanks for your friendship (and may you not spend the rest of your lives in school).
Lastly, I want to thank my parents and the rest of my family for their never ending support of my goals. My accomplishments would be
meaningless without their love and understanding. I also want to
5
Foreword
This work was performed in the Technology Laboratory for Advanced Composites (TELAC) of the Department of Aeronautics and Astronautics at the Massachusetts Institute of Technology. This work was sponsored by Boeing Military Aircraft under Boeing Purchase Order 644740.
Table of Contents
INTRODUCTION 14
2 FATIGUE EFFECTS ON COMPOSITES 19
2.1 General Effects 19
2.2 Damage Growth 22
2.3 Stiffness Reduction 29
2.4 Summary 31
3 THE EXPERIMENT 33
3.1 Specimen Geometry and Test Jig 33
3.2 The Test Program 39
3.3 Specimen Manufacture 42
3.4 Instrumentation 50
3.5 Damage Detection 50
3.5.1 The Load Drop Technique 50
3.5.2 Edge Replication 53 3.6 Test Procedures 55 3.6.1 Static Tests 55 3.6.2 Cyclic Tests 59 4 RESULTS 63 4.1 [454/-454/(0/90)4]2s Laminates 63 4.1.1 Static Behavior 66 4.1.2 Cyclic Behavior 73
Table of Contents (continued)
Chapter
gae
4.2 [±45/0/(90)4]4s Laminates 85 4.2.1 Static Behavior 85 4.2.2 Cyclic Behavior 90 4.3 [(452/-452/0)2/905]2s Laminates 101 4.3.1 Static Behavior 101 4.3.2 Cyclic Behavior 108 5 DISCUSSION 124 5.1 [454/-454/(0/90)4]2s Laminate Pre-Damage 1245.2 Characteristics of Damage Accumulation 127
5.3 Static versus Cyclic Damage Growth 132
5.4 Cyclic Load Level Effects on Damage Growth and
Failure 133
5.5 Implications on Structural Certification 136
6 CONCLUSIONS AND RECOMMENDATIONS 139
REFERENCES 143
APPENDIX A Specimen Thicknesses and Widths 150
List of Figures
Figure
e
3.1 Specimen geometry. 35
3.2 Illustration of test jig. 36
3.3 Side view of jig with alignment plate. 38
3.4 Schematic of cure setup. 45
3.5 Schematic of cure cycle. 47
3.6 Locations of measurements. 49
3.7 Illustration of load increase obscuring a load drop. 52
3.8 Photograph of an edge replica of a [±4 5/0/(90)4]4s specimen
with the corresponding transcription. 56
3.9 Schematic of sequence of tests for cyclic specimens. 61
4.1 Typical load versus center deflection plot for a [±4 5/0/(9 0)4]4s
specimen. 64
4.2 A typical Southwell plot for a [±45/0/(90)4]4s specimen. 65
4.3 Transcription of a typical untested [4 54/-4 54/(0/90)4]2s
specimen. 67
4.4 Damage history of a typical [4 54/-454/(0/90)4]2s specimen
statically tested with the initial damage biased toward the
tension side. 70
4.5 Photograph of a typical failed [454/-454/(0/90)4]2s specimen
statically tested with initial damage biased toward the
tension side. 71
4.6 Damage history of a typical [454/-4 54/(0/90)4]2s specimen
statically tested with initial damage biased toward the
compression side. 72
4.7 Photograph of a typical failed [4 5 4/-4 54/(0/90)4]2s specimen
statically tested with initial damage biased toward the compression side.
List of Figures (continued)
4.8 Damage history for a typical cyclic [454/-454/(0/90)4]2s
specimen with the initial damage biased toward the tension
side. 78
4.9 Photograph of a typical failed [454/-454/(0/90)4]2s specimen
tested cyclically with the initial damage biased toward the
tension side. 80
4.10 Damage history for a typical cyclic [4 54/-4 54/(0/90)4]2s
specimen with the initial damage biased toward the
compression side. 81
4.11 Photograph of a typical failed cyclic [454/-454/(0/90)4]2s
specimen with the initial damage biased toward the
compression side. 83
4.12 Normalized Southwell buckling loads versus normalized
cycle time for [454/-454/(0/90)4]2s specimens. 84
4.13 Damage history of a typical [±4 5/0/(90)4]4s specimen statically
tested. 87
4.14 Photograph of a typical failed [±4 5/0/(90)4]4s specimen
statically tested. 89
4.15 Damage history for a typical cyclic [±4 5/0/(90)4]4s specimen
statically damaged to the first damage state. 94
4.16 Photograph of a typical failed cyclic [I45/0/(90)4]4s specimen
statically damaged to the first damage state. 95
4.17 Damage history for a typical cyclic [±4 5/0/(90)4]4s specimen
statically damaged up to the third damage state. 97
4.18 Damage history for a typical cyclic [I4 5/0/(90)4]4s specimen
statically damaged just beyond the third damage state. 98
4.19 Photograph of a typical failed cyclic [±45/0/(90)4]4s specimen
statically damaged up to the third damage state. 100
4.20 Photograph of a typical failed cyclic [±45/0/(90)4]4s specimen
List of Figures (continued)
Figure
EMae
4.21 Normalized Southwell buckling loads versus normalized
cycle time for [±45/0/(90)4]4s specimens. 103
4.22 Damage history of a typical [(452/-452/0)2/905]2s specimen
statically tested. 106
4.23 Photograph of a typical failed [(452/-452/0)2/905]2s specimen
statically tested. 107
4.24 Damage history for a typical cyclic [(452/-452/0)2/905]2s
specimen statically damaged up to the first damage state. 111
4.25 Photograph of a typical failed cyclic [(4 52/-452/0)2/905]2s
specimen statically damaged up to the first damage state. 113
4.26 Damage history for a typical cyclic [(452/-452/0)2/905]2s
specimen statically damaged just beyond the first damage
state. 115
4.27 Photograph of a typical failed cyclic [(452/-452/0)2/905]2s
specimen statically damaged past the first damage state. 116
4.28 Damage history of a typical cyclic [(452/-452/0)2/905]2s
specimen statically damaged to the third damage state with a
high cyclic load level. 118
4.29 Photograph of a typical failed cyclic [(452/-452/0)2/905]2s
specimen statically damaged to the third damage state with a
high cyclic load level. 119
4.30 Damage history for a typical cyclic [(452/-452/0)2/90512s
specimen statically damaged to the third damage state with a
low cyclic load level. 120
4.31 Photograph of a typical failed cyclic [(452/-452/0)2/905]2s
specimen statically damaged to the third damage state with a
low cyclic load level. 121
4.32 Normalized Southwell buckling loads versus normalized
cycle time for [(452/-452/0)2/905]2s specimens.
List of Tables
Table
3.1 AS4/3501-6 material properties. 40
3.2 Test matrix. 43
4.1 Description of the four characteristic damage states of the
[454/-454/(0/90)4]2s laminate. 69
4.2 Buckling load and center deflection at each characteristic
damage state and maximum load for the [454/-454/(0/90)4]2s
specimens statically tested. 75
4.3 Initial damage state, buckling load, maximum loads, and
the number of cycles to failure for each [4 54/-454/(0/90)4]2s
specimen tested cyclically. 77
4.4 Description of the four characteristic damage states of the
[±45/0/(90)4]4s laminate. 86
4.5 Buckling load and center deflection at each characteristic
damage state and maximum load for the [±4 5/0/(90)4]4s
specimens statically tested. 91
4.6 Initial damage state, buckling load, maximum loads, and
the number of cycles to failure for each [±45/0/(90)4]4s
specimen tested cyclically. 92
4.7 Description of the four characteristic damage states of the
[(452/-452/0)2/905]2s laminate. 105
4.8 Buckling load and center deflection at each characteristic
damage state and maximum load for the [(452/-452/0)2/905]2s
specimens statically tested. 109
4.9 Initial damage state, buckling load, maximum loads, and
the number of cycles to failure for each [(452/-452/0)2/905]2s
specimen tested cyclically. 110
A.1 Average thickness and width for the [4 54/-4 54/(0/90)412s
specimens. 151
A.2 Average thickness and width for the [(452/-452/0)2/905]2s
List of Tables (continued)
Table
A
A.3 Average thickness and width for the [±45/0/(90)4]4s
specimens. 153
B.1 Southwell buckling load at each static test interval for the
[454/-454/(0/90)4]2s specimens tested cyclically. 155
B.2 Southwell buckling load at each static test interval for
[±4 5/0/(90)4]4s specimens 1 to 4 tested cyclically. 156
B.3 Southwell buckling load at each static test interval for
[±45/0/(90)4]4s specimens 5 to 9 tested cyclically. 157
B.4 Southwell buckling load at each static test interval for
[(452/-452/0)2/905]2s specimens 1 to 4 tested cyclically. 158
B.5 Southwell buckling load at each static test interval for
13
Nomenclature
E Young's modulus
Ei Unidirectional ply stiffness (i=1,2,3)
Gij Shear modulus of unidirectional ply (ij=1,2,3)
I Area moment of inertia
L Specimen length
Pcr Euler bifurcation load
S Maximum shear stress
Xc Maximum longitudinal compressive stress
Xt Maximum longitudinal tensile stress
YC Maximum transverse compressive stress
Yt Maximum transverse tensile stress
Chapter 1
INTRODUCTION
The past two decades have seen increased attention given to advanced composite materials in the aircraft and spacecraft industries. The high specific strength and stiffness of advanced composites make them attractive alternative materials to the more traditional, heavier, isotropic materials. An important potential payoff is reduced gross weight thereby increasing range, payload, and/or maneuverability.
With the push for more fuel-efficient commercial aircraft, advanced composites were first used on a large scale for secondary structures on aircraft such as Boeing's 757 and 767 models. This usage allowed the industry to gain experience and confidence in the commercial production use of advanced composites in load-bearing capacities.
A milestone in advanced composites use was reached with the design and production of the Beechcraft Starship 1. This was the first aircraft with an all-composite airframe to be structurally certified by the FAA, leading the way for future large scale use of advanced composites for primary structures.
The use of composites has also seen extensive advancement in rotorcraft. The Boeing 360 is the world's largest all-composite helicopter. It features an all-composite fuselage and makes extensive use of composites in the landing gear components, transmission housing, drive shafts, rotor
controls, hubs, and blades, giving an overall weight reduction of approximately 25% over conventional materials.
Military applications are not exempt from the benefits of composite materials. Because of the "tailorability" of continuous fiber composites, components can be designed to perform to specific requirements. The Grumman/DAARPA X-29 forward swept wing aircraft could only have been achieved by aeroelastic tailoring the composite wing skins. The orientation of the individual plies allows the wings to be configured in a forward swept manner while still avoiding instabilities such as aeroelastic divergence.
In light of the extensive use of composite materials in aircraft, much is needed to be learned about their complex behavior. High safety factors are still being used, leaving a great deal of untapped potential. Their use tends to be in nearly quasi-isotropic layups, making the least efficient use of their properties. In order for composite structures to reach their potential efficiency, the limits and failure modes must be further understood.
While the behavior of composite structures under various loading and boundary conditions has been extensively studied, much of the work investigating damage growth and failure has been in non-gradient stress fields, except in the case of notched panels. Understanding the behavior of composite structures with gradient stress fields is the next step toward efficiently utilizing composites. The buckling of a panel is an example of a structure with a gradient stress field. Allowing the structure to buckle does not necessarily reduce its load-carrying capability and could increase its efficiency as long as the limit load requirements are still met. The current understanding of the postbuckled behavior of composite laminates is limited. Models of buckling loads and postbuckling behavior work well but
are complicated by boundary conditions and damage. Once damage occurs, the models of buckling behavior break down making predictions difficult. This lack of understanding of the effects of damage on the performance of composite structures hampers the use of composite structures in the postbuckled regime and in other applications as well. The final failure of buckled laminates is understood even less. The behavior of laminates in gradient stress fields, including damage initiation, damage growth, and ultimate failure, must be quantified before design criteria can be defined.
Many structures experience repeated, or cyclic, loading conditions which may involve gradient stress fields. Fatigue behavior in composite materials though, is much different than in isotropic materials. Composite materials exhibit many types of damage in the matrix, fiber, and matrix/fiber interface that cyclic loading can excite. Compared to metals, composites can better withstand micro-cracks and maintain cyclic load-carrying capabilities to final failure. It is known, though, that the fatigue strength is less than the static strength due to degradation of the structure during cyclic loading. It is important to fully understand the cyclic behavior of laminates in a gradient stress field. The process of damage initiation and damage growth with cyclic loading and the effects of damage on the fatigue performance of composites needs to be quantified.
Damage mechanisms in composites are complex and difficult to describe because they involve combinations of fiber and matrix interactions. These mechanisms can differ greatly between static and cyclic loading histories. Different modes of failure include fiber-matrix debonding, fiber fracture, matrix failure and delamination. Damage can be defined in terms of crack length, crack density, and amount of delaminations among other ways. The initiation of damage destroys the symmetry of the laminates
thereby increasing the complexity of the problem to the general anisotropic case and making analysis difficult.
An important mechanism of damage in composites occurs in the matrix. Matrix damage due to static or cyclic loading can affect the load-carrying capability of the component by altering the shear transfer mechanism between matrix and fibers. Material flaws, mostly in the form of voids and delaminations, can exist throughout a composite structure. Unlike static loading, cyclic loading can cause these matrix flaws to extend until they reach a critical size, leading to fracture.
It is thus necessary to understand the behavior of composite laminates cyclically loaded with a gradient stress field. This includes quantifying the progression of damage as well as defining failure modes. The occurrence of bending in a structure results in a gradient stress field along the length as well as through the thickness. The objective of this investigation was to understand the damage accumulation in graphite/epoxy laminates due to cyclic gradient stress fields. This will help to give insight into the cyclic behavior of composite structures operating in the postbuckled regime and for other configurations as well. Column specimens of three laminate types under simply-supported boundary conditions providing a simple gradient stress field were chosen as the medium. With the maximum stress at the center of the specimen, damage will initiate at the center away from the boundary conditions. A test program was developed to obtain damage accumulation histories for the three layups subjected to cyclic loading. Initial damage was first created
statically on the specimens. Damage accumulation and stiffness
loading until ultimate failure. The maximum cyclic load level as well as the amount of initial damage was varied.
In chapter two, a summary of previous efforts to study the general effects of fatigue on composite laminates as well as damage growth and stiffness reduction due to cyclic loading is presented. The specimen, test jig, test program, specimen manufacture, and test procedures are described in chapter three. The results of the experiments, with a section for each laminate type, are explained in chapter four. A discussion of the results follows in chapter five. Conclusions and recommendations are presented in chapter six. In Appendix A, the specimen thicknesses and widths are listed. The specimen stiffness data in the form of Southwell buckling loads at each cyclic interruption is given in Appendix B.
Chapter 2
FATIGUE EFFECTS ON COMPOSITES
Fatigue behavior of composites has been studied extensively. The effects of cyclic loading on stiffness and damage growth, along with frequency and load level effects are popular research topics. The work however, has been almost exclusive of fatigue behavior in a gradient stress field such as in a buckled structure. Since composites can carry significant loads after buckling, it is important to understand how damage modes initiate and interact in cyclic gradient stress fields and how the fatigue performance is affected by the damage. An understanding of previous work studying the general effects of cyclic loading as well as damage growth and stiffness reduction is needed before investigating the behavior of laminates subjected to cyclic gradient stress fields.
2.1
GeneralEffects
The effects of frequency and load level on the life of composites have been studied for many types of laminates. Fatigue life of composites has frequently been characterized by S-N curves. It is apparent, as more research is done, that simple characterizations such as S-N curves cannot adequately describe the fatigue behavior of composites due to the many damage types which occur and their interactions.
Much experimental work has been done to develop an understanding of composite fatigue behavior so that adequate characterizations can be developed. Using unidirectional coupon specimens, Awerbuch and Hahn [1] measured the life to failure and residual static strength over a range of peak stress levels. The effects of a proof load on the fatigue life distribution were also included. A proof load is an initial static load applied before cyclic loading begins. It was hoped that a relationship would be found between the static strength distribution of virgin coupons and their fatigue life by eliminating specimens of low static strength, but nothing conclusive was found. The data did serve as a source for statistical fatigue life predictions.
The idea that there was a relationship between static strength and fatigue life was studied by Hahn and Kim [2], with the strength-life equal rank assumption. This hypothesis contends that the specimens with the greatest static strength will also have the longest fatigue life with the lowest strength specimen being the first to fail. Evidence of a unique relationship between static strength and life through proof testing was found to exist for unidirectional glass/epoxy composites. Chou and Wang [3] compiled data from different tensile fatigue experiments and compared several strength degradation and failure models based on the equal rank assumption. None were found to satisfactorily describe every set of experimental data.
Residual strength measurements are a common method of assessing the effects of fatigue on the laminates. A surprising discovery concerning fatigue tests with notched or flawed laminates was that the static strength often increased substantially after fatigue cycling. Romani and Williams [4] show residual static strength increasing by as much as 40% after five million tension-tension cycles. A explanation of this was given by Reifsnider, Stinchcomb, and O'Brien [5] using a two process interaction.
First, a wear-in process occurs locally as the multiple damage modes which occur in a composite laminate erase the stress concentration at the discontinuity. The second process, a wear-out process, consists of a general degradation of the entire laminate by repeated loading with this second process becoming dominant later in the fatigue life. This result shows how multiple damage modes can interact and influence the behavior of a laminate.
Much of the early work on fatigue focused on the material response to cyclic tensile stresses. Inclusion of compressive loads in fatigue loading histories has been shown to significantly reduce life to specimen failure. Ryder and Walker [61 show results of tension-tension, tension-compression, and compression-compression tests of two different laminates. The slope of the S-N curves for the tension-tension tests was less steep than for the other two tests with compression loads. Tension-compression fatigue tests were found to be the most severe conditions. Rosenfeld and Huang [7] suggest that matrix strength degradation allows the fibers to buckle under the compressive loads. There tends to be more damage per cycle with compression loads, accounting for a reduced fatigue life. It is evident from the literature that fatigue testing of composites should include compression to achieve the most severe conditions.
Compressive cyclic loading in composites differs greatly from that of metals. Whereas the compressive loads in metals tend to close the gap created by a microcrack causing little tendency to extend the damage, compressive loads in composites can excite various damage modes such as fiber breaks, delamination, fiber/matrix debonding, and matrix cracking. In addition, as the literature shows, compressive cyclic loading in composites is much more critical to damage development than
tension-tension loading. Sublaminate buckling, which effectively reduces the laminate to two, or more, laminates with less stiffness, can occur with
compressive cyclic loading. More attention is needed to understand the effects of compressive cyclic loading in composites on damage and failure.
2.2 Damae Growth
Much of the work on the cyclic behavior of composites has centered on damage accumulation and failure. There are various nondestructive techniques used to experimentally study damage accumulation. In 1986, Stinchcomb [81 evaluated these techniques. Using the progressive damage due to cyclic loading as a medium for evaluation, five damage states to failure were summarized. Different damage modes were found to interact, forming a complex network of damage making up each damage state. Edge replication and microscopy are techniques to provide damage information on the exposed edge of the laminate giving through-the-thickness but not across-the-width data. The interior damage can be detected by X-ray radiography and ultrasonic methods, but determining the ply in which
damage occurs is difficult. The ultrasonic method works better for
detecting large delamination areas. Thermography is another technique
for detecting internal damage. High frequency - low amplitude or low
frequency - high amplitude mechanical vibrations excite the thermal
frequencies of particular damage modes which create internal sources of heat due to friction. Stiffness was also used to quantify the effects of damage leading to failure.
Damage in composites can be distinguished between the two constituents: matrix and fiber. With these types of damage, different modes
can exist. Talreja [9] describes the different modes caused by tensile fatigue in unidirectional composites. Cracks can be confined to the matrix only, as well as causing fiber breaks or leading to interface failure. Progressive damage is matrix dependent. Fibers can bridge matrix cracks or can break increasing matrix cracking. During fatigue loading, these various damage mechanisms can grow at different rates, interchanging their dominance. In the same work, Talreja introduces damage mechanism maps for composites as a way of characterizing fatigue behavior that is more useful than the usual S-N curves. The critical damage mechanisms are plotted as regions using strain as a variable versus the logarithm of the number of cycles. This characterization shows the ranges of dominance of multiple damage mechanisms.
Reaching a better understanding of the initiation, growth, and interaction of different damage modes, requires detailed damage accumulation studies using nondestructive techniques. Graves [10] conducted an investigation of damage progression in four graphite/epoxy laminates. The experiments included compression-compression fatigue of four-point bending specimens with holes. Visual and tactile inspections made at various intervals of cyclic testing allowed a progressive damage sequence to be developed for each laminate type. It was found that stacking sequence and ply orientation both play a significant role in fatigue life. A more precise nondestructive evaluation technique needs to be used to gain a better understanding of the actual damage mechanisms.
The effects of cyclic loads on composites can be further established by comparing the fatigue damage and failure modes with static modes. Mar, Graves, and Maass [11] found that the failure modes in fatigue generally differ from that in static tests for balanced graphite/epoxy notched
composites subjected to compression-compression fatigue. Interlaminar stresses at the free edge degrades the compressive strength leading to delaminations. Daken and Mar [12] investigated the development of splitting in notched unidirectional specimens under tension-tension cyclic loading. Splitting was found to relieve stress concentrations at the notch and developed at cyclic loads well below the static splitting stress, suggesting a degradation of properties with cyclic loading.
In another effort, Mar [13] reinforces the difference in failure modes between cyclic and static loading histories. He proposes that the research emphasis should be on the propagation of damage under cyclic loads and the amount of damage which will cause catastrophic failure. Experiments
and analyses should be aimed at understanding the damage initiation and accumulation in the epoxy material and at the fiber/matrix interface.
Further work on multiple damage modes was conducted by Fanucci and Mar [14] in their investigation of the damage initiation and propagation in graphite/epoxy laminates with circular holes during compressive fatigue. Sandwich specimens were used to avoid buckling. Damage initiation and progression were monitored using Moire interferometry, a method of optically producing surface contour lines. They found that different damage modes can occur in the same laminate under various conditions reinforcing the idea that cyclic behavior of composites cannot be characterized by general tests. Final failure was preceded by a rapid growth of damage area, suggesting that a warning of specimen failure may be obtained by monitoring cyclic damage.
While it is necessary to understand what different damage modes develop and interact to influence failure, it is also important to understand the method by which each mode progresses. The growth of damage in
terms of transverse cracks was investigated by Reifsnider et al [151. It was discovered that at a sufficiently large number of cycles, patterns of cracking would develop to saturation and remain stable under the same loading. These patterns, labelled as characteristic damage states, are dependent on the laminate configuration.
Much of the work in damage growth due to cyclic loading has dealt with delamination crack growth since there are severe implications on the integrity of the laminate with this damage mode. For non-gradient stress fields, Ye [16] found that increasing matrix strength and ductility increases the critical loads for delamination onset, while reducing the delamination growth under cyclic loading.
There are several standardized tests for quantifying delamination crack growth based on strain energy release rate [17]. This approach equates the energy created by the formation of new fracture surfaces with the strain energy release in the fracture process. Each of these tests evaluate a different mode of crack growth depending on the loading condition. Empirical models of damage growth due to loading can be developed from these tests. Hwang and Han [18] investigated the effects of fiber bridging on Mode I cyclic loading. A modified Paris power law was derived to interpret fatigue crack growth under the influence of fiber bridging which increases the critical load and fracture energy. Under constant cyclic strain energy release rate loading, the crack growth rate decreases due to the fiber bridging.
Varying the cyclic load level can affect crack growth. A delamination crack growth threshold was found for Mode I and mixed mode (I and II) cyclic loading [19,20]. Above the threshold growth rate, crack propagation rate was expressed as a power function of the stress intensity range. Below
this threshold growth rate, there was very little or negligible crack growth with low stress intensity ranges. Mode II crack growth rates under reversed cyclic loading were found to obey a power law depending on the cyclic strain energy release rate [21].
Much effort into understanding damage growth with cyclic loading is directed to the development of theoretical models to predict fatigue life. These models rely on accurate damage accumulation models. Approaches to modelling damage accumulation can range from the global degradation of specimen stiffness to a micromechanics approach separating the fiber and matrix responses. Ye [22] introduces a damage variable to define phenomenologically the degree of damage based on stiffness change. A power law relationship was proposed between the rate of damage
development and the ratio of the square of fatigue load level to the current damage level. A micromechanics approach to predicting fatigue failure of unidirectional composites under any loading system was developed by Aboudi [23]. The micro-failure criteria is applied separately to fiber and matrix regions requiring only the S-N curves of fibers and unreinforced matrix. Good agreement with experimental results were found for several fiber-matrix systems. Harris et al [24] developed a mechanics approach to predict progressive damage, laminate strength, and fatigue life using damage dependent constitutive relationships. As damage developed, stiffness was degraded, allowing further damage to progress, eventually leading to failure. Rotem and Nelson [25] propose a fatigue failure envelope to reveal the behavior of composites subjected to all types of loading based on a couple of experiments and laminate strengths. This envelope will distinguish between tensile and compressive failure modes for reversed loading. It agreed with limited experimental results. A failure envelope
such as this though, does not include the effect of multiple damage mode interaction which can vary for different conditions.
Because there are different modes of damage in composites, models should also include multiple modes of damage and their interactions. Talreja [26] developed a continuum mechanics approach to characterize damage resulting from fatigue or any other loading condition. Damage is represented by a set of vector fields, each representing a damage mode and orientation. These damage modes are allowed to develop simultaneously and at different growth rates. Constitutive equations relate the elastic constants of a damage state to those of the undamaged state, thereby characterizing the current elastic response of a damaged composite. This methodology does not describe damage development, however. Talreja calls for a better understanding of damage in composites before a proper mechanics treatment of damage accumulation is developed.
Real structures are seldom subjected to the same load levels over long periods of time. An analytical study of cumulative damage during multilevel fatigue loading was performed by Hwang and Han [27]. The models developed could be useful in predicting multi-stress fatigue life. Fatigue modulus and resultant strain were used as parameters representing damage as a function of the number of cycles and applied stress level. It is concluded that much work is needed to establish a universal fatigue damage model which would explain multi-stress level fatigue phenomena without an S-N curve.
A damage tolerance approach for predicting fatigue life was presented by O'Brien [28]. First, matrix cracks are assumed to exist throughout the off-axis plies. Edge delamination initiation is predicted using the strain energy release rate. Delamination growth is then
accounted for by either experimentally measuring stiffness, analytically using growth laws based on strain energy release rate, or assuming catastrophic delamination growth. Failure prediction is made after accounting for the accumulation of local delaminations through the thickness, each of which reduce the failure strain. This methodology was used to predict the tension-tension fatigue life of glass-epoxy laminates and the data fell within the ranges predicted. This approach could also be extended to compressive fatigue loading by first assuming that edge delaminations grow throughout the interface immediately. Models for local and global buckling of damaged laminates would then have to be used to assess the failure strain. This methodology is limited, though, for cases where various damage modes interact because unique characterizations of damage modes in terms of energy release rate become complex.
It has been shown that damage which occurs under cyclic loading can be quite different than that which occurs due to static loads. Most of the work in the literature studying damage growth involves tension-tension loading or restricts buckling of the laminates, ignoring the potential effects of cyclic gradient stress fields. In the cases where bending was allowed, the damage detection techniques used did not allow precise quantification of the damage. Conducting standardized delamination crack growth experiments can aid in the prediction of such damage, but the interaction of various damage modes further complicates the problem for general laminates. Damage growth in cyclic gradient stress fields, such as in a buckled structure, needs to be understood before models can accurately predict real conditions.
2.3 Stiff Reduction
A proposed method of predicting failure is by monitoring stiffness reduction with cyclic loading as a result of damage. Rotem [29] and Maier
et al [30] found that the stiffness degradation of specimens subjected to
tension-compression and tension-tension cyclic loading can be described by three stages. After initial cycling, the stiffness is reduced by a few percent. For most of the rest of the fatigue life the stiffness is reduced slightly at a constant rate. At approximately 80-90% of the fatigue life, regardless of load level, the stiffness degrades at an accelerated level until failure. Saunders and Van Blaricum [31] found that failure in their laminates occurred after stiffness degraded approximately 15%. These results indicate the potential use of stiffness measurements as a nondestructive evaluation technique to predict laminate failure.
Razvan et al [32] found that for notched laminates subjected to reverse loading at different maximum load levels, stiffness degradation was more severe for low load levels than for high load levels. The fundamental types of damage were not altered by load level but the manner in which different damage modes interacted up to failure was strongly dependent on load level. The low load level tests saw an increase in the contribution of delaminations leading up to failure. This suggests that the fatigue response of composite structures is dependent on load history and that the most severe case is not necessarily represented by the highest load levels.
The behavior of composites in fatigue in terms of stiffness can vary depending on the layups used. Various fiber orientations react differently, making it necessary to study each desired layup until reliable prediction
methods are developed. Poursartip et al [33] saw that the stiffness of their laminates increased after cyclic loading with some initial damage. They
attributed this to a shearing of the 450 plies and a realignment of the 00
fibers. Failure occurred after the stiffness was degraded approximately 35% allowing a prediction of failure based on quantitative measurements of stiffness reduction. Lifshitz [34] looked at compression-compression loading without restricting buckling of the specimen. The 0O uniaxial specimens
showed no apparent change in stiffness before catastrophic failure where
the 900 specimens saw a slight increase in stiffness during the early stages
of fatigue life with a reduction before failure. A slight increase in stiffness was also found for the ±450 shear test specimens with a drop in stiffness prior to failure.
Many researchers have developed models to predict stiffness changes and fatigue life which are based on experimental data. Talreja [35] classifies the effects of transverse cracking into four types to qualitatively assess laminate performance with cracking. A method for quantitatively predicting the stiffness changes due to transverse cracking was found to have good accuracy. Whitworth [36] developed an empirical model relating the stiffness degradation to the fractional life expended at a given stress level and also to the residual strength degradation. This model, based on three parameters that are experimentally evaluated, is restricted to constant amplitude fatigue loadings. Hwang and Han [37] introduced the concept of "fatigue modulus" which is defined as the slope of applied stress versus the resultant strain at a specific cycle. Their empirical model uses the assumption that the fatigue modulus degradation rate follows a power function of fatigue cycle. The equation for predicting fatigue life, using the fatigue modulus and its degradation rate, works better than S-N curves.
These models were compared to non-gradient stress field tests. Experiments with gradient stress fields are needed to assess these models to accurately predict the behavior of composites under these conditions.
The significant decrease in stiffness prior to failure reported in the literature indicates an experimental technique for predicting failure. An understanding of how damage modes interact and accumulate under cyclic loading coupled with an understanding of how damage affects laminate stiffness can aid in the development of accurate models to predict laminate failure. A logical extension of the above work is to investigate the effects on
stiffness of laminates subjected to cyclic gradient stress fields. It is suggested that load level is also a variable and that loading history should be considered when designing tests or developing models.
2.4 Summaxr
Though much work has been done on the fatigue behavior of composites, most of it has been done in non-gradient stress fields. While it is generally agreed that compressive cyclic loading represents a severe case, most experiments were designed to prevent the buckling of the specimen. The studies summarized are insightful as to the effects of fatigue on strength, delamination growth, and specimen stiffness, but the subject of repeated bending behavior of laminates is not fully addressed. It is clear that compressive cyclic loading reduces the fatigue life of a specimen but the effects of adding bending to the problem is still uncertain.
Wolfe [38] investigated the progression of damage in statically loaded beam-column specimens in a bending state. Damage accumulation histories for three layups were developed and structured into four
characteristic damage states. A two-dimensional finite element model was developed to predict the damage accumulation and failure using the maximum stress failure criterion for in-plane damage as well as the Quadratic Delamination Criterion for out-of-plane damage. In-plane damage and delamination initiation was predicted with good accuracy, but the progression of the delaminations was overpredicted.
This work represents a first step in assessing the damage accumulation in laminates with a gradient stress field. The next step is to assess the damage accumulation due to cyclic gradient stress fields. Just as different damage mechanisms are present in cyclic loading as compared to static loading, the damage mechanisms due to repeated bending may differ as well compared to that due to non-gradient stress fields.
Prediction methods for cyclic damage accumulation, stiffness reduction, and fatigue life are based largely on empirical data. A better understanding of the various damage mechanisms and the interaction of these mechanisms with respect to different loading conditions in various stress fields is needed before composite structures can be efficiently designed to operate in gradient stress field environments.
Chapter 3
THE EXPERIMENT
3.1 Specimen Geometry
and
Test JigThe specimen type chosen was designed and utilized by Wolfe and Lagace [38]. There were three requirements for the test specimen to meet. First, the stress field had to be straightforward to calculate. A complex stress state would have been difficult to calculate and would hinder a study
of failure mechanisms. Second, the location of damage needed to be
predictable. It was necessary that damage initiation occurred away from load introduction points, since the stress state at the boundaries would be very complex. Third, an observable accumulation of damage was desired. It was necessary to identify several stages of damage accumulation prior to final failure so it was important that initial damage and final failure did not coincide. It was also necessary to be able to physically inspect the specimens during the course of the test to document the accumulation of damage.
In light of these requirements, a simply-supported column specimen was chosen as the specimen type. The stress state varies along the length with the maximum stresses and hence initial damage occurring in the middle of the specimen, away from the boundary conditions. Thus, the gradient stress field is simple to calculate and the location of damage initiation is known.
The specimen geometry is shown in Figure 3.1. The specimen has a length of 200 mm and a width of 37.5 mm. The side of the specimen exhibiting the greatest tensile stresses due to bending will be referred to as the tension side, with the other side referred to as the compression side. Three configurations of laminates of fifty-six, sixty, and sixty-four plies, with a ply thickness of 0.134 mm, were chosen. The length was chosen such that the buckling loads of the three laminates, as given by the Euler buckling equation:
Pcr = 72 EI / L2 , (3.1)
were within the ten percent load range of the test machine (4.45 kN to 44.5 kN). Testing a new laminate of a different thickness may require a new length as governed by the above equation. The specimens were thick enough to provide an observable accumulation of damage, wide enough to avoid an interaction of edge effects from the sides, and long enough to ensure bending preventing failure by squashing.
The test jig used in the previous damage accumulation study [38] was used for this investigation. The requirement of the jig was to provide simply-supported boundary conditions for all loads applied. Any friction in the mechanism would cause the column to first behave in a clamped column manner. It was therefore desired to avoid any friction problems while trying to achieve ideal simply-supported boundary conditions. The jig used is shown in Figure 3.2. In this jig, the specimen ends fit into end pieces which rest on rounded knife edges through which the load is introduced. The end pieces are slotted steel blocks. A tight fit between the specimen and end pieces is ensured with thin steel and brass shims. The
200 mm
*
Transducer tip
375
mm
Figure 3.1 Specimen geometry.
Alignrr
holes
1.59
rc
Specir
(37.!
Shims,
(38)
End pi
(38.1
Neopre
(38)
End
support-(48)
200
S4.54
70
I
Figure 3.2 Illustration of test jig.
NOTES:
1. All
dimensions
in mm
2.
Dimensions in
(
)
are
depths
3.
Parts are
4041 steel
shims are placed on both sides of the specimen to keep it symmetric with respect to the centerline of the end pieces. The slots in the end pieces are 25 mm deep, reducing the test section length of the specimen to 150 mm. The total length of the column including the end pieces is 222 mm. On the opposite surface of the end pieces, a groove is cut into which the knife edges of the end supports fit. The end supports are blocks of 4041 steel, hardened to 36 Rockwell, with one end machined to a wedge with a rounded edge. This rounded knife edge has a radius of 1.59 mm. These end supports are placed into the grips of the test machine. Alignment of the top and bottom end supports is important to provide the correct loading conditions. Proper alignment is assured by bolting an alignment plate to both end supports. Once the top end support is gripped by the test machine, the plate is attached to the end support by two bolts preventing the plate from rotating. The bottom end support is then bolted to the alignment plate, after which the bottom end support is gripped. After both grips are closed, the alignment plate is removed. A side view of the jig with the alignment plate in place is shown in Figure 3.3.
The groove on the end pieces is not at the centerline of the specimen, thus making the load introduction eccentric. The groove is 2.54 mm (0.1 inch) from the centerline creating a moment at the specimens ends. This moment is large enough to overcome any friction present at the knife edge. Thus the specimen behaves as a simply-supported beam-column from the start of load introduction. The eccentricity is large enough to overshadow any eccentricity resulting from slight manufacturing defects in the specimens. This eccentricity will cause the specimens to always deflect in the same direction.
Bolts
Alignment plate
Scale: 1
End
support
End
piece
Specimen
mm
: 2.5 mm
Neoprene rubber blocks are placed between the specimen and the end pieces. Without the rubber blocks, contact between the specimen and the end pieces might be reduced to the edge of the surface of the specimen because the end pieces tend to rotate slightly more than the end of the
specimen. Premature failure could occur due to a resulting shear stress concentration. The addition of the rubber blocks in the bottom of the slots provided a more even load distribution. The addition of a plastic material through the load path meant that the end displacement data as recorded by the test machine load cell is not useable.
A lip on the compression side of the end pieces exists to attempt to prevent the specimen from flying out of the jig upon ultimate failure. Aside from safety concerns, additional damage can occur due to the specimen becoming ballistic and striking a hard surface, which was considered undesirable. A plastic shield was also attached to the test machine to restrain a specimen leaving the jig in this manner.
3.2 The Test Program
Hercules AS4/3501-6 material was used throughout this
investigation. This consists of unidirectional AS4 graphite fibers in a thermoset 3501-6 matrix system. It is in a semi-cured (B-stage) state as
preimpregnated tape and must be stored at -180C or colder. This prepeg roll
is nominally 305 mm wide. Nominal elastic and strength properties of a cured unidirectional ply are shown in Table 3.1.
In order to provide consistent results with the previous work [38], the
same three laminates were chosen: [4 54/-4 54/(0/90)4]2s, [±4 5/0/ 904]4s, and
Table 3.1 AS4/3501-6 material properties. Stiffness Properties V1 2 V13 142 9.8 9.8 6.0 6.0 4.8 0.3 0.3 GPa GPa GPa GPa GPa GPa Strength Properties
XT
XC
YT
YC
S 2356 1468 49.4 186 105 MPa MPa MPa MPa MPa V23 0.34initial damage would occur in the form of matrix cracks, making the accumulation of damage observable. Damage would be expected in groups of at least 4 plies of the same fiber orientation. These groups, called "effective plies", behave as a single ply. Thus, when a crack appears, it propagates through the entire thickness of the ply. With an effective ply of less than four plies, the experimentally observed tensile strength is higher. It has been found that the in situ ply strength for transverse cracks in [02/90n]s laminates is related to ply thickness [391. In fact, for a value of n equal to one, failure stresses could exceed the nominal transverse strength
of the 900 plies by a factor of 2.5. Classical Laminated Plate Theory and the
Maximum Stress failure criterion were used in laminate selection. Two of
the laminates, [±4 5/0/90414s and [(452/-452/0)2/905]2s, were chosen such that
initial damage would occur in 900 plies on the tension side, and one,
[454/-454/(0/90)4]2s, such that initial damage would occur in the 450 plies on
the tension side.
A test program was designed to determine the damage accumulation history of the three layups when subjected to cyclic loading. First, specimens of each layup were tested statically to failure. These tests were interrupted and edge replicas taken such that a damage accumulation history could be pieced together in the same manner as the previous work [38]. With the specimens loaded in displacement control, the Load Drop Technique was used to detect a drop in load, interpreted as the occurrence of damage. Edge replicas were taken at each interruption to record the damage state on both sides of the specimens. X-ray photos were not taken since the damage across the width of the specimen was not seen to significantly vary in the previous work [38]. Center deflection versus load measurements were also recorded. These static tests verified that the
specimens and the test set-up used were comparable to what had been previously done. The remainder of the specimens were tested cyclically to failure to fulfill the objectives of this work.
These specimens were first loaded quasi-statically in displacement control using the Load Drop Technique. A predetermined level of initial damage would be achieved statically before starting the cyclic portion of the test. Once this initial damage was created, the specimens would be loaded cyclically to failure. At predetermined cyclic intervals, a static test sequence would be performed in which a static load versus center deflection measurement was taken as well as edge replicas. This allowed the monitoring of the accumulation of damage and stiffness degradation with respect to the number of cycles.
The four characteristic damage states noted for these layups for static loading [38] were used to define the initial damage levels desired before cyclic loading. These damage states are reviewed in chapter 4. The level of initial damage statically induced and the maximum fatigue load was varied to determine their effect on the damage accumulation histories and failure modes. Competing damage modes may be initiated and interact differently depending on the damage state at the start of cyclic loading as well as the cyclic load level. The entire test program is shown in Table 3.2.
3.3 Siecimen Manufacture
Three 305 mm by 350 mm laminates of each layup were manufactured for this investigation. The procedures used were developed in TELAC [40], and are summarized herein.
Table 3.2 Test matrix.
Layup Number of Type of Test a
Specimens
[454/-454/(0/90)4]2s 4 Static test to failure
Edge replicas at load drops
7 Static to damage level one
Cyclic to failure at maximum static load b
[145/0/904]4s 2 Static test to failure
Edge replicas at load drops
4 Static to damage level one
Cyclic to failure at maximum static load
6 Static to damage level three
Cyclic to failure at maximum static load
[(452/-452/0)2/905]2s 2 Static test to failure
Edge replicas at load drops
4 Static to damage level one
Cyclic to failure at maximum static load
3 Static to damage level three
Cyclic to failure at maximum static load
3 Static to damage level three
Cyclic to failure at damage level one load level
a All cyclic tests include edge replicas and intervals.
b R ratio of ten used in all cyclic tests.
The prepeg tape is stored at or below -180C. Upon being taken out of
the freezer, the roll is left sealed at room temperature for thirty minutes. This is to help prevent condensation from forming on the material.
The tape is cut into appropriate shapes required for each of the ply orientations using aluminum templates covered in teflon-coated glass
fabric and razor blades. The 450 plies are cut into trapezoidal shapes which
are placed together to form a 305 mm by 350 mm rectangle. These trapezoids are designed such that there are no fiber breaks in any ply. The joint where the two trapezoids meet is parallel to the fiber direction making it a "matrix joint" which becomes indistinguishable during the cure cycle. The 00 and 900 plies are made using squares and rectangles.
Because the laminates were thick laminates, they were each divided into three sublaminates of approximately twenty plies. These sublaminates were layered separately and compacted in a vacuum of 740 mm Hg for two hours. The backing paper was not removed on each surface of a sublaminate during this process. This compaction helps remove any air pockets and results in a lower void content after curing. After compaction, the sublaminates were then stacked to form the laminate.
Many materials are used in the curing process of a laminate as can be seen in Figure 3.4. Peel-ply, a nylon-like fabric which is porous to the epoxy, is placed on the surface of the laminate. The laminate is placed on an aluminum caul plate. This caul plate is first covered by Mold Wiz® mold release, manufactured by Axel Plastics Research Laboratories, and nonporous coated glass fabric (TCGF). A sheet of porous teflon-coated glass fabric is placed on top of the laminate. In order to absorb excess epoxy as it flows out of the laminate during the cure, sheets of bleeder material are placed on top of the porous teflon. The number of
Fiberglass Cloth
IFial
TCGF
Tape
aminate
:uum
Tape
Top view
Figure 3.4 Schematic of cure setup. Vacuum Bag
sheets is half the number of plies of the laminate, although for thick laminates, it was found that less mess was created by using 3 to 5 more sheets. Aluminum top plates, the same size as the laminates, wrapped in a high grade nonporous teflon-coated glass fabric (GNPT) are placed on top of the bleeder material. Corprene rubber material (cork) is used to build up dams around the laminate and top plate assembly to ensure that neither shifts during the cure.
Usually, two or three laminates were cured at a time on one caul plate. The manner in which three laminates were placed on the caul plate is shown in Figure 3.4. Sheets of porous teflon-coated glass fiber were placed over all the top plates, and a heavy fiberglass cloth serving as an air breather was placed over this. This air breather allowed air and other gases to escape into the vacuum system. The entire system is sealed with a high-temperature nylon bagging material and vacuum tape.
Curing the laminates is a two stage process. First, excess epoxy is
allowed to flow away during a one hour flow stage at 1170C. At this time,
the epoxy is at its lowest viscosity. Second, the chemical cross-linking of the
polymer chains occurs during a two-hour set stage at 1770 C. During both
stages, a vacuum of 740 mm Hg is applied as well as pressure of 0.59 MPa. To avoid thermally shocking the laminates, heating and cooling rates are
kept between IPC and 30C per minute. A postcure of eight hours at 1770
C in an unpressurized oven follows these stages. This cure cycle is illustrated in Figure 3.5.
Six specimens were machined from each laminate to the proper dimensions (200 mm by 37.5 mm) upon the completion of the cure cycle. A water-cooled diamond grit cutting wheel mounted onto a milling machine was used. A table speed of 28 mm per minute was used because of the
AUTOCLAVE
TIME (mins)
AUTOCLAVE
PIP CC_ I IPI IIIAD:\
TIME (mins) VACUUM (mm HG)
280
TIME (mins)
Schematic of cure cycle. 177 117 25 0 0.59 740 n 7 V·. h v Figure 3.5


![Figure 4.5 Photograph of a typical failed [454/-454/(0/90)4]2s specimen statically tested with initial damage biased toward the tension side.](https://thumb-eu.123doks.com/thumbv2/123doknet/14536592.534825/71.918.219.756.312.694/figure-photograph-typical-failed-specimen-statically-initial-tension.webp)
![Figure 4.7 Photograph of a typical failed [454/-454/(0/90)4]2s specimen statically tested with initial damage biased toward the compression side.](https://thumb-eu.123doks.com/thumbv2/123doknet/14536592.534825/74.918.231.751.317.691/figure-photograph-typical-failed-specimen-statically-initial-compression.webp)
![Table 4.2 Buckling load and center deflection at each characteristic damage state and maximum load for the [ 4 5 4/- 4 54/(0/ 9 0 )4]2s specimens statically tested.](https://thumb-eu.123doks.com/thumbv2/123doknet/14536592.534825/75.918.154.777.242.984/table-buckling-center-deflection-characteristic-maximum-specimens-statically.webp)
![Table 4.3 Initial damage state, buckling load, maximum loads, and the number of cycles to failure for each [ 4 5 4/- 4 5 4/(0/90)4]2s specimen tested cyclically.](https://thumb-eu.123doks.com/thumbv2/123doknet/14536592.534825/77.918.121.792.457.828/table-initial-damage-buckling-maximum-failure-specimen-cyclically.webp)
![Figure 4.8 Damage history for a typical cyclic [454/-454/(0/90) 4 ]2s specimen with the initial damage biased toward the tension side.](https://thumb-eu.123doks.com/thumbv2/123doknet/14536592.534825/78.918.127.829.92.973/figure-damage-history-typical-cyclic-specimen-initial-tension.webp)
![Figure 4.9 Photograph of a typical failed [454/-454/(0/90)4]2s specimen tested cyclically with the initial damage biased toward the tension side.](https://thumb-eu.123doks.com/thumbv2/123doknet/14536592.534825/80.918.225.761.309.690/figure-photograph-typical-failed-specimen-cyclically-initial-tension.webp)