HAL Id: hal-02788810
https://hal.inrae.fr/hal-02788810
Preprint submitted on 5 Jun 2020
HAL is a multi-disciplinary open access
archive for the deposit and dissemination of sci-entific research documents, whether they are pub-lished or not. The documents may come from teaching and research institutions in France or abroad, or from public or private research centers.
L’archive ouverte pluridisciplinaire HAL, est destinée au dépôt et à la diffusion de documents scientifiques de niveau recherche, publiés ou non, émanant des établissements d’enseignement et de recherche français ou étrangers, des laboratoires publics ou privés.
Marine C. Cambon, Jean-Claude Ogier, Anne Lanois-Nouri, Jean-Baptiste
Ferdy, Sophie Gaudriault
To cite this version:
Marine C. Cambon, Jean-Claude Ogier, Anne Lanois-Nouri, Jean-Baptiste Ferdy, Sophie Gaudriault. Changes in rearing conditions rapidly modify gut microbiota structure in Tenebrio molitor larvae. 2018. �hal-02788810�
Changes in rearing conditions rapidly modify gut microbiota
structure in Tenebrio molitor larvae
Marine Cambon1,2, Jean-Claude Ogier2, Anne Lanois2, Jean-Baptiste Ferdy1 and Sophie
Gaudriault2
1 Laboratoire Evolution et Diversité Biologique, CNRS-Université Paul Sabatier, Toulouse,
France.
2 Laboratoire Diversité, Génome et Interaction Microorganisme Insectes, INRA-Université de
Montpellier, Montpellier, France.
Running title: Gut microbiota structure in T. molitor 1 2 3 4 5 6 7 8 9 10 11 12
Abstract
The gut microbiota of multicellular organisms has been shown to play a key role in their host biology. In mammals, it has an invariant component, responsible for establishing a mutualistic relationship with the host. It also contains a dynamic fraction which facilitates adaptation in response to changes in the environment. These features have been well described in mammals, but little is known about microbiota stability or plasticity in insects. We assessed changes in microbiota composition and structure in a reared insect after a change in rearing conditions. We reared
Tenebrio molitor (Coleoptera, Tenebrioninae) larvae for five days in soil samples from two river
banks and analyzed their gut microbial communities by a metabarcoding technique, using the V3-V4 region of the 16S rRNA gene and the housekeeping gene gyrB. We found that soil-reared insects had a significantly more diverse microbiota than the control insects and that insects reared in soil from different sites had significantly different microbiota. We confirmed this trend by absolute quantification of the two mains fluctuating taxonomic groups: the Enterobacteriaceae family and the Pseudomonas genus, dominant in the soil-reared insects and in the control insects, respectively. Our results suggest the existence of a resident microbiota in T. molitor gut, but indicate that rearing changes can induce rapid and profound changes in the relative abundance of some of the members of this resident microbiota.
Keywords: resident microbiota, T. molitor, soil acclimatization, microbiota plasticity
Background
Microorganisms have repeatedly been shown to play a key role in plant and animal biology (Bordenstein and Theis 2015). If we are to understand the biology of a pluricellular organism, we must consider its microbiota, the cohort of microorganisms associated with the host. In animals, the 13 14 15 16 17 18 19 20 21 22 23 24 25 26 27 28 29 30 31 32 33 34
gut microbiota is a key component, with major effects on host physiology. For example, the mammalian gut microbiota has been the object of many studies on digestive functions with health implications (Belizário and Napolitano 2015).
The composition of the mammalian gut microbiota displays both plasticity and invariant features. The core microbiota, which consists of the microorganisms common to the majority of individuals within a population, is generally defined as the most prevalent of the microbial species detected (Shetty et al. 2017). This common fraction of the microbiota plays a fundamental role in supporting the mutualistic symbiotic relationship with the host (Candela et al. 2012). For example, changes in the human core microbiota are associated with physiological perturbations, such as obesity and Crohn’s disease (Turnbaugh et al. 2009; Hedin et al. 2015). However, another key feature of the mammalian gut microbiota is its plasticity, i.e. its ability to change in composition and structure. In humans, dietary changes induce a remarkable degree of variation in gut microbiota in terms of both phylogenetic and functional composition (Candela et al. 2012). These changes depend on various factors including host age, sex, genetic make-up, immune and health status (Shetty et al. 2017), but also exposure to environmental bacteria, geographic origin and climate (Candela et al. 2012). It has been suggested that this plasticity of the human gut microbiota facilitates rapid responses to environmental change, resulting in rapid ecological adaptation (Alberdi et al. 2016).
Most studies on the gut microbiota concern mammals. However, the use of mammals, and more generally of vertebrates, in experimental approaches raises numerous practical, financial and ethical issues. Large-scale experiments require model organisms that are easy to manipulate and can be obtained in large numbers. Insects are interesting experimental models in this respect. Although their guts contain fewer microbial species than those of mammals (Engel and Moran 2013), insects also rely on their gut microbiota for diverse functions, including development, nutrition, the modulation of immune responses, gut homeostasis, protection from pathogens and toxins (Engel and Moran 2013; Shi et al. 2013; Broderick et al. 2014; Erkosar and Leulier 2014; Caccia et al. 35 36 37 38 39 40 41 42 43 44 45 46 47 48 49 50 51 52 53 54 55 56 57 58 59
2016; Welte et al. 2016; Shao et al. 2017; Raymann and Moran 2018). The gut microbiota of non-social insects is principally acquired from the environment through feeding (Engel and Moran 2013). Its composition depends on environmental conditions and diet in both laboratory and wild individuals (Chandler et al. 2011; Montagna et al. 2015; Staudacher et al. 2016). For example, it has been shown for some coleopteran species that microbiota changes with geographical location, environmental condition, and life stage (Huang and Zhang 2013; Montagna et al. 2014).
One potential limit of these previous studies is that they used either insects from the wild, which cannot be controlled for many of their characteristics, or lab-reared insects, which are controlled but have a poorly diversified microbiota. Here we used laboratory-reared T. molitor larvae and mimicked a soil environment by rearing the larvae for five days in different soil samples. We assessed the changes in gut microbiota composition after acclimatization to soil samples and demonstrated a large shift in gut microbial structure. We showed in addition that different soil samples induced different modifications in insect microbiota, and that the observed plasticity was probably dependent on changes in the abundance of some of the resident OTUs.
Methods
Soil samples
We sampled soil from riverside land around Montpellier in the South of France (Figure 1A): on the banks of the Hérault river near Causse-De-La-Selle (N43°49.884' E003°41.222'; CDS sample) and on those of the Lez river near Montferrier-sur-Lez (N43°40.801' E003°51.835'; MTF sample). Both soils had a sand-silt-clay composition typical of riversides on chalky substrata. The sand:silt ratio was higher for MFT than for CDS. We collected three soil subsamples from each plot. These subsamples were taken at a depth of 20 cm and were separated by a distance of 10 m. They were named CDS1, CDS2, CDS3 and MTF1, MTF2, MTF3 (Figure 1B). The use of these six soil 60 61 62 63 64 65 66 67 68 69 70 71 72 73 74 75 76 77 78 79 80 81 82
subsamples made it possible to compare the variability in microbiota composition both between and within plots. Each soil subsample was split into four portions, each of which was placed in a 1 L plastic box (Figure 1C), in which it was mixed with heat-sterilized (20 min at 121 °C) wheat bran (1:3 (v/v) ratio, as previously described (Jung et al. 2014).
Insects
Larvae were provided by Micronutris (St-Orens, France) and fed with heat-sterilized bran before the experiment. As it was not possible to determine their precise developmental stage, but we used only larvae weighing between 20 and 50 mg, which should correspond to 13th or 14th instar individuals (Huang et al. 2011).
Rearing of T. molitor larvae in soil samples
We maintained laboratory-reared T. molitor larvae for five days in sterilized wheat bran mixed with soil samples. During this period, the larvae were incubated at 15 °C in the same humidity conditions. They were then starved for 24 hours (Figure 1D) to exclude individuals that were infected with pathogens (which would have died within this 24 hours period) and to limit the risk that the DNA we extract comes from the larval alimentary bolus. This starvation period potentially induces a stress on insect larvae, which might in turn impact their microbiota. We imposed it on all insects, so that the potential bias it creates is identical in all treatments.
Control insects were reared in the same conditions than other insects except that they were incubated in sterile wheat bran, with no soil mixed. Control insects microbiota should thus be close to what it was for all insects before the experiment.
DNA extraction
We extracted DNA from two randomly sampled insects per box (which makes a total of 24 insects 83 84 85 86 87 88 89 90 91 92 93 94 95 96 97 98 99 100 101 102 103 104
per site) and 5 control insects. However, we failed to amplify 16S rRNA during PCR step for 2 samples, ending with 24 samples for CDS, 22 samples for MTF and 5 controls. Insect larvae were sterilized in 70% ethanol, rinsed in water and then killed. The guts of the larvae were dissected in sterile Ringer solution (Jung et al. 2014). Dissection tools were sterilized with 70% ethanol between insects. Dissected guts were placed in an Eppendorf tube with 100 µL of lysis solution and 1 µL lyzozyme (Quick Extract, Bacterial DNA extraction TEBU-BIO) and ground with 3 mm steel beads for 30 seconds at 20 Hz with a TissueLyzer (Qiagen). The resulting homogenates were incubated at room temperature for two days, then frozen in liquid nitrogen and heated at 95 °C to ensure that all the cells were lysed. DNA was prepared by the phenol-chloroform-alcohol and chloroform extraction method. The DNA was resuspended in sterile water and quantified with a NanoDrop spectrometer (Thermo Fisher Scientific). We performed extraction blanck controls using DNA-free water.
16S and gyrB DNA amplification
We targeted the V3-V4 region of the 16S rRNA gene, which is classically used for bacterial identification in microbial ecology studies, as clean and complete reference databases are available for this region. We also used the bacterial housekeeping gene gyrB, to support the data for the 16S rRNA (Barret et al. 2015). The V3-V4 region of the 16S rRNA gene was amplified with the PCR1F_460 (5’-ACGGRAGGCAGCAG-3’) / PCR1R_460 (5’-TACCAGGGTATCTAATCCT-3’) primers (modified versions of the primers used in a previous study Klindworth et al. (2012)). Amplification was performed with the MTP Taq polymerase (Sigma, ref 172-5330), according to the manufacturer’s protocol, with 1 µL of 1/10 diluted DNA extract for each sample. The PCR protocol used for these primers was 60 s at 94 °C, followed by 30 cycles of 60 s at 94 °C, 60 s at 65 °C, 60 s at 72 °C, and then 10 min at 72 °C. The gyrB gene was amplified with primers described elsewhere: gyrB_aF64 MGNCCNGSNATGTAYATHGG-3’ and gyrB_aR353 5’-105 106 107 108 109 110 111 112 113 114 115 116 117 118 119 120 121 122 123 124 125 126 127 128
ACNCCRTGNARDCCDCCNGA-3’ (Barret et al. 2015). Amplification was performed with the iProof High-Fidelity Taq polymerase (Bio-Rad, ref. 172-5301), according to the manufacturer’s protocol, with 1 µL of 1/10 diluted DNA extract for each sample. The PCR protocol used for these primers was 30 s at 98 °C, followed by 40 cycles of 10 s at 98 °C, 30 s at 60 °C, 30 s at 72 °C, and then 10 min at 72 °C. For each PCR, we performed negative and positive controls with water and bacterial DNA extracted from a pure culture of Xenorhabdus nematophila (Enterobacteriaceae), respectively, and checked PCR amplicons by electrophoresis in a 1% agarose gel. We performed technical replicates for the PCR and sequencing steps and obtained identical microbiota patterns (see Additional File 2, for example). Amplicon libraries were sequenced by the GeT-Plage genomics platform at Genotoul (Toulouse, France) with Illumina MiSeq technology and a 2x250 bp kit. Raw
sequence data of both 16S rRNA and gyrB are available from
http://www.ebi.ac.uk/ena/data/view/PRJEB21797.
Metabarcoding data treatment
Sequence data for both markers were analyzed with OBITools (Boyer et al. 2015). Raw paired-end reads were aligned and merged, taking into account the phred quality score of each base to compute an alignment score. Reads with a low alignment score (>50), containing unknown bases or with an unexpected size (outside 400 bp and 470 bp, and 230 bp and 260 bp after primer trimming for the 16S rRNA gene and gyrB respectively) were removed from the dataset. After primer trimming, singletons (i.e. sequences only found once in the dataset) were removed (Auer et al. 2017). Sequences were then clustered into OTUs with the Sumaclust algorithm (Mercier et al. 2013), using a 97% similarity threshold (OBITools workflows and the raw count table are available in Additional Files 3 and 4). We then removed from the datasets all clusters containing less than 0.005% of the total number of reads (Bokulich et al. 2013). The remaining OTUs were assigned to a taxonomic group with RDPclassifier (Wang et al. 2007) and the RDPII reference database for the 16S rRNA 129 130 131 132 133 134 135 136 137 138 139 140 141 142 143 144 145 146 147 148 149 150 151 152
marker and with seq_classifier.py from the mothur pipeline (Schloss et al. 2009) and the reference database from Barret et al. (2015) for gyrB gene (OTU assignments are available in Additional File 5).
Quantitative PCR analysis
To check for changes in OTU abundances, we performed quantitative PCR (qPCR) on two randomly picked insects per soil subsample among those used in the metabarcoding analysis. The sampling probability for each sample was adjusted for the total number of 16S rRNA reads for the sample. The five DNA samples corresponding to control insects were all analyzed.
All qPCRs were performed in triplicate, with 3 µL of reaction mixture, on a LightCycler480 machine (Roche Diagnostics), after the plate had been filled by an Echo 525 liquid handler (Labcyte). The reagent concentrations were identical in all SYBR Green I assay reactions: 1X Light-Cycler 480 SYBR Green I Master Mix (Roche Diagnostics), 500 nM each of the forward and reverse primers specific for genus Pseudomonas (here named Pse -16S, Bergmark et al. (2012)), the
Enterobacteriaceae family (here named Entero-rplP, Takahashi et al. (2017)) or the Eubacteria
kingdom (here named uni16S, Vandeputte et al. (2017)) (see sequences in Additional File 6) and DNA matrix. The DNA used was either genomic DNA (0.5 ng/µL) from the various reference strains, to check primer specificity (Escherichia coli, Serratia marcesens, Klebsiella pneumoniae,
Salmonella typhimurium, Enterobacter cloacae, Pseudomonas protegens, Stenotrophomonas, Acinetobacter, Enterococcus ) or a 1/100 dilution of insect gut DNA for metabarcoding. The qPCR
conditions were 10 minutes at 95 °C, followed by 45 cycles of 5 s at 95 °C, 10 s at 62 °C and 15 s at 72 °C, with a final dissociation curve segment. Cycle threshold (Ct) values were determined with Light-Cycler 480 software. After the validation of primer specificity (13 < Ct < 37 for positive controls, Ct > 40 for negative controls), absolute quantifications were calculated by the standard curve method. Serial dilutions of standard samples consisting of genomic DNA from E. coli 153 154 155 156 157 158 159 160 161 162 163 164 165 166 167 168 169 170 171 172 173 174 175 176
ATCC25922 for the rplP gene and the rRNA16S gene (uni16S primers) and genomic DNA from
Pseudomonas aeruginosa CIP76.110 (=ATCC27853) for the 16S rRNA gene (Pse -16S primers)
were prepared and used for calibration. The gene copy number of the target gene ( GC Nt a r g e t
[copies]) in standard samples was estimated using the total amount of genomic DNA in the
calibration samples MD N A [g], the size of the bacterial chromosome LD N A [bp], the number
of targets per bacterial chromosome nt a r g e t [copies], Avogadro’s constant NA ( 6.022× 10²³
bp mol-1) and the mean weight of a double-stranded base pair M
b p (660 g mol-1 bp-1) as follows:
GC Nt a r g e t=NA× MD N A
LD N A× Mb p
×nt a r g et
Using the parameters of the curves linking GC Nt a r g e t and C t in standard samples, we then
estimated the GCN of target genes in our gut samples. This estimation was possible because PCR efficiency (PE) was very close to that for standard samples (Additional File 6).
Community analysis
All analyses were performed with R version 3.3.3 (R Core Team 2015) (see Additional File 7 and 8 for the overall workflow). We did not rarefy data (McMurdie and Holmes 2014), but we used Chao1 index which is the estimated OTU richness of each sample, taking into account the possible lack of detection of some rare OTUs. Chao1 index is thus the observed OTU richness per insect plus an estimation of the unseen OTUs per insect. The Shannon index is based on relative abundance data, to represent the effective OTU richness of the sample based on the predominant OTUs. We estimated the Chao1 and Shannon alpha diversity indices with the vegan package of R (Oksanen et al. 2017). We also calculated Pielou’s eveness which is the Shannon diversity divided by the natural logarithm of the OTU richness of the sample, and reflects how similar the relative abundances of OTUs in a sample are.
177 178 179 180 181 182 183 184 185 186 187 188 189 190 191 192 193 194 195 196 197 198
We calculated the beta diversity distance matrix from the Jaccard and Bray-Curtis distances for presence/absence and relative abundance data, respectively, using the vegan package. We also computed Unifrac and wUnifrac distances for presence/absence and relative abundance data, respectively (Lozupone and Knight 2005), with the Phyloseq package (McMurdie and Holmes 2013). Unifrac and wUnifrac distances include phylogenetic distances between pairs of OTUs. A phylogenetic tree of the OTU sequences was, therefore, required. We generated this tree by aligning OTU sequences with Seaview software and the muscle method. The phylogenetic tree was built with RAxML and the GTRCAT substitution model for nucleotide sequences (Stamatakis 2014) (Additional File 9). Differences in the gut bacterial community between soil-reared insects and control insects were evaluated based on the beta diversity distance matrix, in PERMANOVA tests implemented in the vegan package (Oksanen et al. 2017), with treatment as the explanatory variable. We investigated differences between the gut bacterial communities of soil-reared insects, by performing PERMANOVA tests on distance matrices with two explanatory variables: soil sample (i.e. CDS or MTF) and soil subsample (i.e. CDS1-3, MTF1-3). Beta-diversity distances were represented using a PcoA analysis from the vegan package (Oksanen et al. 2017).
Results
Incubation of T. molitor larvae with soil increases the richness and
diversity of their gut microbiota
After cleaning, the total dataset of the metabarcoding experiment contained 792,395 sequences clustered into 106 bacterial OTUs. Rarefaction curves showed that most of the samples had reached the saturation plateau (Figure 2A). We used the Chao1 index, which assesses the extrapolated richness of OTUs, including an estimation for undetected rare OTUs, to compare alpha diversity between soil-reared and control insects. The mean Chao1 index of the microbiota of soil-reared 199 200 201 202 203 204 205 206 207 208 209 210 211 212 213 214 215 216 217 218 219 220 221
insects (MTF and CDS) was a 48 ± 13 OTUs whereas that of control insects (BRAN) was 25
± 9 OTUs (Figure 2B). The OTU richness of the gut microbiota therefore increased significantly
after the incubation of the insects with soil samples (Chao1 index, soil vs. control: Wilcoxon rank sum test, W=221, p-value = 1e-3). A similar conclusion was drawn for analyses based on the Shannon index, which reflects relative OTU abundance within samples (Figure 2B, soil vs. control: Wilcoxon rank sum test, W=216, p-value = 1e-3). Moreover, control insects harbored bacterial
communities dominated by a very small number of dominant OTUs (low Shannon index ≃ 0.2
and low Pielou’s eveness ≃ 0.02). OTU assignment identified these dominant OTUs as
belonging to the Pseudomonadaceae family (Figure 2C). By contrast, soil-reared insects harbored
bacterial communities with more balanced relative OTU abundances (Shannon index ≃ 1.7).
The gut microbiota of these insects was dominated by Enterobacteriaceae, together with
Pseudomonadaceae and other less frequent families, such as Moraxellaceae and Aeromonadaceae
(Figure 2C). This was confirmed by the analysis of Pielou’s eveness index which was significantly lower in control insects than in soil-reared insects (Wilcoxon rank sum test, W=0, p-value = 7.6e-7). Thus, five days in soil significantly increased the richness of the microbiota in the gut of T. molitor larvae, and modified the balance of OTUs present.
We also investigated the effect of soil treatments according to soil origin, by comparing the alpha diversity of CDS and MFT samples. The Chao1 and Shannon indices were significantly lower in
MTF than in CDS samples (Figure 2B; Chao1 index: Kruskal-Wallis test, χ2
=12.93 , p-value =
3e-4; Shannon index: Kruskal-Wallis test, χ2
=9.6136 , p-value = 1e-3). The CDS and MTF soils had therefore different impacts on both richness and bacterial balance.
Soil treatment induces a change in microbiota composition that is
variable between soil sampling sites
We investigated the effect of soil treatment on insect microbiota, by calculating the beta-diversity 222 223 224 225 226 227 228 229 230 231 232 233 234 235 236 237 238 239 240 241 242 243 244 245
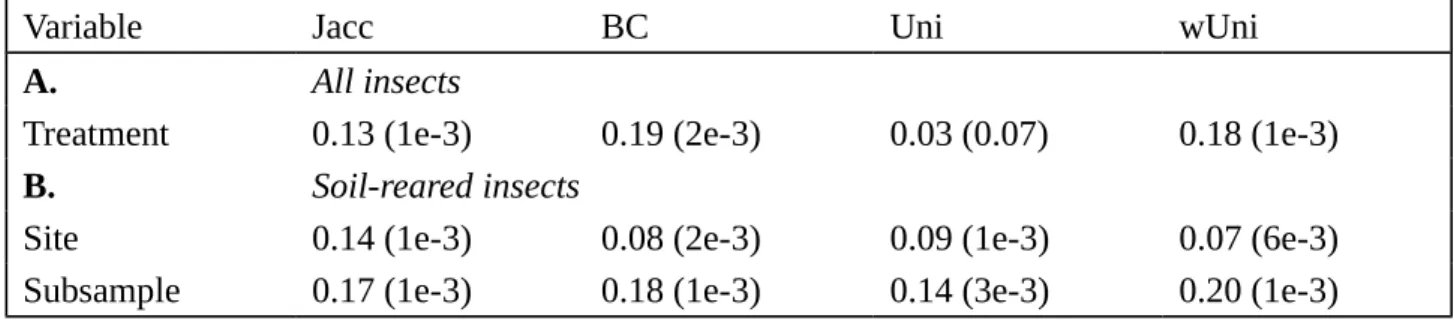
between insect gut microbiota with various distance indices (Figure 3). We first calculated a distance based on pairwise Jaccard and Bray-Curtis distances. These two indices are complementary, because Jaccard distance depends purely on the presence/absence of OTUs, whereas Bray-Curtis distance also takes into account the number of reads for each OTU as a proxy for their relative abundance. We performed PCoA analysis on distance matrices (Figure 3A) where control insects tended to cluster together. PERMANOVA analysis confirmed that community composition differed between soil-reared insects and control insects (13 to 19% of the variance explained by soil treatment, Table 1A).
The microbiota profiles of insects placed in soils from the same site (i.e. CDS or MTF) or in the same soil subsample (e.g. CDS1, CDS2 or CDS3) did not cluster together perfectly. However, a second PERMANOVA model for these samples identified two explanatory factors, soil sampling site (i.e. CDS or MTF) and subsample identity (e.g. CDS1, CDS2 or CDS3), as having a significant impact on gut community composition (Table 1B). Indeed, sample site explained 14 and 8% of the variance and soil subsample explained 17 and 18% of the variance, for the Jaccard and Bray-Curtis indices, respectively.
As reported above, the soil-reared insects had a microbiota dominated by Enterobacteriaceae (Figure 2C). We thus estimated Unifrac distances, which take into account the phylogenetic distances between OTUs, and wUnifrac distances, which also take relative OTU abundance into account. With these corrections, the differences between control insects and soil-reared insects were significant only when relative OTU abundance was taken into account (Figure 3; Table 1A). Subtle but significant effects of sample site and soil subsample on community composition were also observed with the Unifrac and wUnifrac indices (Figure 3; Table 1B).
Overall, our results show that soil treatment changes the community composition of the gut microbiota and that this change is detectable despite inter-individual variability. The bacterial communities present in the gut differ both between sample sites and between soil subsamples. 246 247 248 249 250 251 252 253 254 255 256 257 258 259 260 261 262 263 264 265 266 267 268 269 270
Most of the changes in the microbiota concern the relative abundances
of OTUs
We then pooled all individuals of a given treatment to determine which OTUs are found in at least one individual for each treatment. The 47 OTUs found in control insects were also present in the insects of the soil treatment groups (Figure 4A). The 44 OTUs common to all three conditions matched 97% of the reads for soil-reared insects (gray area in Figure 4B and Figure 4C). However, after soil treatment, Pseudomonas, the dominant OTU in control insects (98% of the reads) accounted for only 27 and 23% of the reads in CDS and MTF samples, respectively (Figure 4C). Conversely, Serratia species, together with the Enterobacter group, which accounted for less than 1% of sequence reads in controls, accounted for 35% and 43% of the reads for CDS and MTF, respectively.
For confirmation of our initial metabarcoding results, we performed a second metabarcoding analysis with another marker, a 300 bp region of the gyrB housekeeping gene (see Additional File 1). This single-copy marker has been shown to provide assignments to more precise taxonomic levels than the 16S rRNA gene (Barret et al. 2015). In accordance with the results obtained with the 16S rRNA gene marker, Pseudomonas was the dominant OTU in control insects (more than 99 % of the reads) and its relative abundance was lower in soil-reared insects (CDS: 14 % MTF: 17 % of the reads). The genus Serratia and the Enterobacter group accounted for less than 0.06 % of the reads in control insects and a large proportion of those for the insects in the two soil treatment groups (CDS: 57 % MTF:70 % of the reads).
Finally, we also identified with 16S rRNA 59 OTUs that were not detectable in control insects but were present at low abundance (3% of the reads) in at least one soil-reared insect (red dashed area in Figure 4B and Figure 4D). These OTUs may correspond to taxa that were absent from the insects before soil treatment, and that colonized the insect gut during incubation in soil. Alternatively, they 271 272 273 274 275 276 277 278 279 280 281 282 283 284 285 286 287 288 289 290 291 292 293 294
may have been present in the control insects at densities below the PCR detection threshold. Their abundance would then have increased above this threshold during incubation, just like the abundances of Serratia or Enterobacter. Overall, our data strongly suggest that the main effect of soil treatment is a change in the relative abundances of OTUs, although low levels of bacterial colonization from soil cannot be ruled out.
The balance between members of the resident OTUs contributes to the
variation of abundances after soil treatment
We assessed the variation of OTU balance after soil treatment further, by quantifying the bacterial taxonomic groups present in all treatments but with different relative abundances between the two contrasting sets of conditions studied (control versus soil-reared). We first characterized the gut resident microbiota in our larvae, as the OTUs present in at least 95% of our samples (following (Falony et al. 2016)). Based on 16S rRNA gene metabarcoding, we identified five resident OTUs: four Enterobacteriaceae (Enterobacterericeae 1, Enterobacterericeae 2, Serratia and Enterobacter group) and Pseudomonas. The resident OTUs obtained with the gyrB gene consisted of two OTUs,
Pseudomonas and Serratia, confirming the existence of an invariant bacterial population in our
insect gut microbiota. Based on the composition of this resident microbiota, we chose to monitor
Pseudomonas and the Enterobacteriaceae to check for changes in the abundance of these bacteria
following treatment. We performed quantitative PCR (qPCR) on a subset of 17 samples, including the five control insects and two insects for each soil subsample. We first calculated the gene copy number (GCN) of the 16S rRNA gene in each sample, using a universal primer pair targeting
Eubacteria (uni16S primers). As the number of 16S rRNA gene copies varies across Eubacteria
lineages (between 1 and 15 copies per genome, Lee et al. (2008)), the GCN cannot be used to quantify the number of bacterial cells with precision (Angly et al. 2014). However, in our samples,
GCN/µL ranged from 107 to 108 and did not differ significantly between samples
(Kruskal-295 296 297 298 299 300 301 302 303 304 305 306 307 308 309 310 311 312 313 314 315 316 317 318
Wallis rank sum test, chi squared = 2.66, df = 2, p-value = 0.26), which suggests that the total number of bacteria was similar in our 17 samples. We then targeted a region of the 16S rRNA gene specific to the Pseudomonas genus, (Pse -16S: 251 nucleotides of the V3-V4 hypervariable region, with 4 to 7 copies per genome Bodilis et al. 2012), and a region of the rplP gene, region specific to the Enterobacteriaceae family (Entero-rplP : 185 nucleotides of the rplP gene, one copy by genome). The Pse -16S GCN in soil-reared insects was one tenth that in control insects (Figure 5A). Conversely, the Entero-rplP GCN was 100 times higher in soil-reared insects (Figure 5B). Soil acclimation therefore seems to induce a decrease in Pseudomonas abundance and an increase in
Enterobacteriaceae abundance. Our data suggest that the main effect of soil treatment is to modify
the relative abundances of the resident bacterial communities of the gut microbiota.
Discussion
Rearing larvae in soil rather than in bran caused major changes in gut microbiota structure. Soil-reared larvae have a richer and more diverse gut microbiota than control larvae. Despite considerable inter-individual variability, we found that the changes in community composition depended on both the site from which the soil was obtained, and the precise soil subsample used. An analysis of the OTUs found in the different samples suggested that the main effect of the soil treatment was a change in the relative abundance of OTUs. We confirmed this trend by qPCR for the two main taxonomic groups displaying changes in abundance: the Enterobacteriaceae family and the genus Pseudomonas, which predominated in soil-reared insects and in the control, respectively.
Our rearing conditions (laboratory versus soil acclimatization) were associated with two types of gut microbial patterns, consistent with previous findings for laboratory-reared and wild insects. On the one hand, gut microbiota communities of laboratory-reared insects, which are usually maintained on very simple media and diets, are dominated by one or two bacterial strains: 319 320 321 322 323 324 325 326 327 328 329 330 331 332 333 334 335 336 337 338 339 340 341 342
Pseudomonas in our study, Enterococcus in moths (Chen et al. 2016; Staudacher et al. 2016) or the Enterobacteriaceae group Orbus in fruit flies (Chandler et al. 2011). On the other hand, following
soil treatment, our larvae harbored more complex community profiles, with several
Enterobacteriaceae together with the Pseudomonas strain that we found in control insects. Wild
coleopterans, such as the forest cockchafer, Melolontha hippocastani, which has a soil-dwelling larval stage, have a microbiota dominated by Enterobacteriaceae, essentially a consortium of
Serratia, and a Shannon diversity index close to that observed here for soil-reared insects
(Arias-Cordero et al. 2012). Other coleopterans, such as Agrilus planipennis and Nicrophorus vespiloides (Vasanthakumar et al. 2008; Wang and Rozen 2017), both sampled from the wild and reared on a natural diet, also have microbiotas dominated by Pseudomonas sp., the Enterobacter group and
Serratia sp.. These findings suggest that our protocol can be used to mimic soil-dwelling insects
effectively with reared insects. This might make it possible to obtain large numbers of individuals while working on a relevant set of bacteria in further studies of the insect gut microbiota. Moreover, we focused here on the gut microbiota, but soil treatment probably modifies the entire microbiota, including the cuticular bacterial community. Our methodology is therefore likely to be of particular interest for holobiont studies (Bordenstein and Theis 2015) involving controlled hypothesis-driven experiments on insects with a relevant total bacterial community.
The changes we observed in gut microbiota structure may result from major changes in insect diet, as insects may have access to different sources of food when incubated in soil compared to sterile bran. Our results fit well to the diet influences on microbiota documented in several Drosophila species (Chandler et al. 2011; Staubach et al. 2013; Vacchini et al. 2017), omnivorous cockroaches (Pérez-Cobas et al. 2015), termites (Mikaelyan et al. 2015), lepidopterans (Broderick et al. 2004; Belda et al. 2011; Priya et al. 2012) and a few coleopterans (Colman et al. 2012; Jung et al. 2014; Franzini et al. 2016; Kim et al. 2017). Changes in microbiota structure could also depend on physiochemical properties of the insect gut. In wood-feeding cockroaches, different parts of 343 344 345 346 347 348 349 350 351 352 353 354 355 356 357 358 359 360 361 362 363 364 365 366 367
intestinal tract showed differences in pH, redox potential and hydrogen contents, and were associated to different bacterial communities (Bauer et al. 2015). The ingestion of soil particles probably modifies some of these properties of the gut. The fact that the soil characteristics differed between the two sampling sites (low sand/silt ratio for Causse-De-La-Selle (CDS), and higher sand/silt ratio for Montferrier (MTF)) could thus explain in part their different impacts on T. molitor gut microbiota.
The changes in the gut bacterial population may depend not only on treatment, but also on the bacterial community initially present in the gut. Previous studies (Jung et al. 2014; Osimani et al. 2018) showed that a Spiroplasma species predominated in the gut microbiota of the larval lineage, even after and environmental change. Spiroplasma has been shown to be a heritable endosymbiont in Drosophila (Mateos et al. 2006). Similar effects were observed for other endosymbionts, such as
Wolbachia, Cardinium, Blattabacterium-like and putative Bartonella-like symbionts in mites Tyrophagus putrescentiae following dietary changes (Erban et al. 2017). In all these case,
endosymbiont seem to impede major shifts in the gut microbiota or conceal changes in frequencies that may occur in low-abundance OTUs. This effect is absent in our experiment, probably because the insects we used are associated to Spiroplasma or any other endosymbiotic bacteria.
Our results also provide interesting insight into the spatial variation of the gut bacterial community in insect populations. The differences observed after incubation in soil from different plots were consistent with the findings of other studies on coleopterans, in which the dissimilarity of the gut bacterial community between individuals is correlated with the distance between sampling sites (Adams et al. 2010). However, we also observed a difference in the gut microbiota between insects incubated with soils collected a few meters apart, at the same sampling site, and this difference was detectable despite high levels of inter-individual variation. Minor environmental differences thus have a detectable impact on the gut microbiota and structure this microbiota within insect populations over very small geographic scales.
368 369 370 371 372 373 374 375 376 377 378 379 380 381 382 383 384 385 386 387 388 389 390 391 392
Overall, our experiments indicate that gut microbiota can be readily changed by modifying the environment in which the insects are living. We identified resident taxa present in all the environments we tested. These taxa change in relative abundance with environmental changes. The range of environmental conditions tested here is narrower than that experienced by insects in the wild, but results suggest that, following changes in environmental conditions, the insect gut microbiota maintains a stable composition, but displays plasticity in terms of its structure.
Availability of data and material
Both the 16S rRNA and gyrB datasets generated and analyzed in this study are available from the ENA (European Nucleotide Archive) repository, http://www.ebi.ac.uk/ena/data/view/PRJEB21797
Funding
MC obtained PhD funding from the French Ministry of Higher Education, Research and Innovation. Metabarcoding sequencing was funded by the MEM-INRA metaprogram (P10016). This work was also supported by the French Laboratory of Excellence project “TULIP” (ANR-10-LABX-41 ; ANR-11-IDEX-0002-02)
Authors’ contributions
MC, JBF and SG conceived the study. MC designed and performed the experiments. AL performed qPCR analysis. MC and JCO analyzed the data. JBF and SG supervised the project. All authors wrote, read and approved the final manuscript.
393 394 395 396 397 398 399 400 401 402 403 404 405 406 407 408 409 410
Acknowledgments
We thank Marie Frayssinet for help with soil sampling and insect acclimatization, and Lucie Zinger for help with data analysis.
References
Adams, A. S., Adams, S. M., Currie, C. R., Gillette, N. E. and Raffa, K. F. 2010. Geographic
variation in bacterial communities associated with the red turpentine beetle (Coleoptera: Curculionidae). Environmental entomology 39, 406-414.
Alberdi, A., Aizpurua, O., Bohmann, K., Zepeda-Mendoza, M. L., and Gilbert, M. T. P. 2016.
Do vertebrate gut metagenomes confer rapid ecological adaptation?. Trends Ecol Evol 31, 689 -699.
Angly, F. E., Dennis, P. G., Skarshewski, A., Vanwonterghem, I., Hugenholtz, P. and Tyson, G. W. 2014. CopyRighter: a rapid tool for improving the accuracy of microbial community profiles
through lineage-specific gene copy number correction. Microbiome 2, 11.
Arias-Cordero, E., Ping, L., Reichwald, K., Delb, H., Platzer, M. and Boland, W. 2012.
Comparative evaluation of the gut microbiota associated with the below-and above-ground life stages (larvae and beetles) of the forest cockchafer, Melolontha hippocastani. PLoS ONE 7, e51557.
Auer, L., Mariadassou, M., O'Donohue, M., Klopp, C. and Hernandez-Raquet, G. 2017.
Analysis of large 16S rRNA Illumina datasets: impact of singleton read filtering on microbial community description. Mol Ecol Resour, 00:1–11.
Barret, M., Briand, M., Bonneau, S., Préveaux, A., Valière, S., Bouchez, O., Hunault, G., Simoneau, P. and Jacques, M. A. 2015. Emergence shapes the structure of the seed microbiota.
Appl Environ Microbiol 81, 1257-1266.
Bauer, E., Lampert, N., Mikaelyan, A., Köhler, T., Maekawa, K. and Brune, A. 2015.
Physicochemical conditions, metabolites and community structure of the bacterial microbiota in the gut of wood-feeding cockroaches (Blaberidae: Panesthiinae). FEMS Microbiol Ecol 91, 1-14.
Belda, E., Pedrola, L., Peretó, J., Martínez-Blanch, J. F., Montagud, A., Navarro, E., Urchueguía, J., Ramón, D., Moya, A. and Porcar, M. 2011. Microbial diversity in the midguts of
field and lab-reared populations of the european corn borer Ostrinia nubilalis. PLoS ONE 6, 1-14.
Belizário, J. E. and Napolitano, M. 2015. Human microbiomes and their roles in dysbiosis,
common diseases, and novel therapeutic approaches. Front Microbiol 6.
Bergmark, L., Poulsen, P. H. B., Al-Soud, W. A., Norman, A., Hansen, L. H. and Sørensen, S. J. 2012. Assessment of the specificity of Burkholderia and Pseudomonas qPCR assays for detection
of these genera in soil using 454 pyrosequencing. FEMS Microbiol Lett 333, 77-84. 411 412 413 414 415 416 417 418 419 420 421 422 423 424 425 426 427 428 429 430 431 432 433 434 435 436 437 438 439 440 441 442 443
Bokulich, N. A., Subramanian, S., Faith, J. J., Gevers, D., Gordon, J. I., Knight, R., Mills, D. A. and Caporaso, J. G. 2013. Quality-filtering vastly improves diversity estimates from Illumina
amplicon sequencing. Nat Methods 10, 57.
Bordenstein, S. R. and Theis, K. R. 2015. Host biology in light of the microbiome: ten principles
of holobionts and hologenomes. PLoS Biol 13, e1002226.
Boyer, F., Mercier, C., Bonin, A., Le Bras, Y., Taberlet, P. and Coissac, E. 2015. obitools: a
unix-inspired software package for DNA metabarcoding. Mol Ecol Resour 16, 176-182.
Broderick, N. A., Buchon, N. and Lemaitre, B. 2014. Microbiota-induced changes in Drosophila
melanogaster host gene expression and gut morphology. MBio 5, e01117-14.
Broderick, N. A., Raffa, K. F., Goodman, R. M. and Handelsman, J. 2004. Census of the
bacterial community of the gypsy moth larval midgut by using culturing and culture-independent methods. Appl and Environ Microbiol 70, 293-300.
Caccia, S., Di Lelio, I., La Storia, A., Marinelli, A., Varricchio, P., Franzetti, E., Banyuls, N., Tettamanti, G., Casartelli, M., Giordana, B., Ferré, J., Gigliotti, S., Ecrolini, D. and Pennacchio, F. 2016. Midgut microbiota and host immunocompetence underlie Bacillus
thuringiensis killing mechanism. P Natl Acad Sci USA 113, 9486-9491.
Candela, S., Biagi, E., Maccaferri, S., Turroni, S. and Brigidi, P. 2012. Intestinal microbiota is a
plastic factor responding to environmental changes. Trends Microbiol 20, 385 - 391.
Chandler, J. A., Lang, J. M., Bhatnagar, S., Eisen, J. A. and Kopp, A. 2011. Bacterial
communities of diverse Drosophila species: ecological context of a host-microbe model system.
PLoS Genet 7, e1002272.
Chen, B., Teh, B. S., Sun, C., Hu, S., Lu, X., Boland, W. and Shao, Y. 2016. Biodiversity and
activity of the gut microbiota across the life history of the insect herbivore Spodoptera littoralis. Sci
Rep 6, 29505.
Colman, D. R., Toolson, E. C. and Takacs-Vesbach, C. D. 2012. Do diet and taxonomy influence
insect gut bacterial communities?. Mol Ecol 21, 5124-5137.
Engel, P. and Moran, N. 2013. The gut microbiota of insects--diversity in structure and function.
FEMS Microbiol Rev 37, 699-735.
Erban, T., Ledvinka, O., Nesvorna, M. and Hubert, J. 2017. Experimental manipulation shows a
greater influence of population than dietary perturbation on the microbiome of Tyrophagus
putrescentiae. Appl Env Microbiol 83, e00128-17.
Erkosar, B. and Leulier, F. 2014. Transient adult microbiota, gut homeostasis and longevity: novel
insights from the Drosophila model. FEBS Lett 588, 4250-4257.
Franzini, P. Z. N., Ramond, J. B., Scholtz, C. H., Sole, C. L., Ronca, S. and Cowan, D. A. 2016.
The Gut microbiomes of two Pachysoma Macleay desert dung beetle species (Coleoptera: Scarabaeidae: Scarabaeinae) feeding on different diets. PLoS ONE 11, e0161118.
444 445 446 447 448 449 450 451 452 453 454 455 456 457 458 459 460 461 462 463 464 465 466 467 468 469 470 471 472 473 474 475 476 477 478 479
Hedin, C., van der Gast, C. J., Rogers, G. B., Cuthbertson, L., McCartney, S., Stagg, A. J., Lindsay, J. O. and Whelan, K. 2015. Siblings of patients with Crohn’s disease exhibit a
biologically relevant dysbiosis in mucosal microbial metacommunities. Gut, gutjnl-2014.
Huang, Q., Hu, J., Zhou, D. G., Ling, S., Ruan, H. B., Wang, X. N., Chen, G., Zhu, T. H., Yang, C. P. and Yang, W. 2011. Comparison of growth, development, survivorship and food utilization of
two color varieties of Tenebrio molitor (Coleoptera: Tenebrionidae). Acta Entomol Sinica 3, 008.
Huang, S. and Zhang, H. 2013. The impact of environmental heterogeneity and life stage on the
hindgut microbiota of Holotrichia parallela larvae (Coleoptera: Scarabaeidae). PloS ONE 8, 1-14.
Jung, J., Aram, H., Park, Y. W., Kim, Y. J., Koh, H. and Woojun, P. 2014. Gut microbiota of
Tenebrio molitor and their response to environmental change. J Microbiol Biotechnol 24, 888-897.
Kim, J. M., Choi, M. Y., Kim, J. W., Lee, S. A., Ahn, J. H., Song, J., Kim, S. H. and Weon, H. Y. 2017. Effects of diet type, developmental stage, and gut compartment in the gut bacterial
communities of two Cerambycidae species (Coleoptera). J Microbiol 55, 21-30.
Klindworth, A., Pruesse, E., Schweer, T., Peplies, J., Quast, C., Horn, M. and Glöckner, F.
2012. Evaluation of general 16S ribosomal RNA gene PCR primers for classical and next-generation sequencing-based diversity studies. Nucleic Acids Res 41, e1-e1.
Lee, Z. M. P., Bussema III, C. and Schmidt, T. M. 2008. rrn DB: documenting the number of
rRNA and tRNA genes in bacteria and archaea. Nucleic Acids Res 37, D489-D493.
Lozupone, C. and Knight, R. 2005. UniFrac: a new phylogenetic method for comparing microbial
communities. Appl Environ Microbiol 71, 8228-8235.
Mateos, M., Castrezana, S. J., Nankivell, B. J., Estes, A. M., Markow, T. A. and Moran, N. A.
2006. Heritable endosymbionts of Drosophila. Genetics 174, 363-376.
McMurdie, P. J. and Holmes, S. 2013. phyloseq: An R package for reproducible interactive
analysis and graphics of microbiome census data. PLoS ONE 8, e61217.
McMurdie, P. J. and Holmes, S. 2014. Waste not, want not: why rarefying microbiome data is
inadmissible. PLoS Comput Biol 10, e1003531.
Mercier, C., Boyer, F., Bonin, A. and Coissac, E. 2013. SUMATRA and SUMACLUST: fast and
exact comparison and clustering of sequences.
Mikaelyan, A., Dietrich, C., Köhler, T., Poulsen, M., Sillam-Dussès, D. and Brune, A. 2015.
Diet is the primary determinant of bacterial community structure in the guts of higher termites. Mol
Ecol 24, 5284-5295.
Montagna, M., Chouaia, B., Mazza, G., Prosdocimi, E. M., Crotti, E., Mereghetti, V., Vacchini, V., Giorgi, A., De Biase, A., Longo, S., Cervo, R., Lozzia, G. C., Alma, A., Bandi, C. and Daffonchio, D. 2015. Effects of the diet on the microbiota of the Red Palm Weevil (Coleoptera:
Dryophthoridae). PLoS ONE 10, 1-22.
Montagna, M., Gómez-Zurita, J., Giorgi, A., Epis, S., Lozzia, G. and Bandi, C. 2014.
480 481 482 483 484 485 486 487 488 489 490 491 492 493 494 495 496 497 498 499 500 501 502 503 504 505 506 507 508 509 510 511 512 513 514 515
Metamicrobiomics in herbivore beetles of the genus Cryptocephalus (Chrysomelidae): toward the understanding of ecological determinants in insect symbiosis. Insect Science 22, 340-352.
Oksanen, J., Blanchet, F. G., Friendly, M., Kindt, R., Legendre, P., McGlinn, D., Minchin, P. R., O'Hara, R. B., Simpson, G. L., Solymos, P., Stevens, H., Szoecs, E. and Wagner, E. 2017.
vegan: Community Ecology Package.
Osimani, A., Milanović, V., Cardinali, F., Garofalo, C., Clementi, F., Pasquini, M., Riolo, P., Ruschioni, S., Isidoro, N., Loreto, N., Franciosi, E., Tuohy, K., Petruzzelli, A., Foglini, M., Gabucci, C., Tonucci, F. and Aquilanti, L. 2018. The bacterial biota of laboratory-reared edible
mealworms (Tenebrio molitor L.): From feed to frass. Int J Food Microbiol 272, 49 - 60.
Pérez-Cobas, A. E., Maiques, E., Angelova, A., Carrasco, P., Moya, A. and Latorre, A. 2015.
Diet shapes the gut microbiota of the omnivorous cockroach Blattella germanica. FEMS Microbiol
Ecol 91, fiv022.
Priya, N. G., Ojha, A., Kajla, M. K., Raj, A. and Rajagopal, R. 2012. Host plant induced
variation in gut bacteria of Helicoverpa armigera. PLoS ONE 7, 1-10.
Raymann, K. and Moran, N. A. 2018. The role of the gut microbiome in health and disease of
adult honey bee workers. Curr Opin Insect Sci.
Schloss, P. D., Westcott, S. L., Ryabin, T., Hall, J. R., Hartmann, M., Hollister, E. B., Lesniewski, R. A., Oakley, B. B., Parks, D. H., Robinson, C. J. and others 2009. Introducing
mothur: open-source, platform-independent, community-supported software for describing and comparing microbial communities. Appl Environ Microbiol 75, 7537-7541.
Shao, Y., Chen, B., Sun, C., Ishida, K., Hertweck, C. and Boland, W. 2017. Symbiont-derived
antimicrobials contribute to the control of the lepidopteran gut microbiota. Cell Chem Biol 24, 66-75.
Shetty, S. A., Hugenholtz, F., Lahti, L., Smidt, H. and de Vos, W. M. 2017. Intestinal
microbiome landscaping: insight in community assemblage and implications for microbial modulation strategies. FEMS Microbiol Rev 41, 182-199.
Shi, W., Xie, S., Chen, X., Sun, S., Zhou, X., Liu, L., Gao, P., Kyrpides, N. C., No, E. and Yuan, J. S. 2013. Comparative genomic analysis of the endosymbionts of herbivorous insects reveals
eco-environmental adaptations: biotechnology applications. PLoS Genet 9, 1-12.
Stamatakis, A. 2014. RAxML version 8: a tool for phylogenetic analysis and post-analysis of large
phylogenies. Bioinformatics 30, 1312-1313.
Staubach, F., Baines, J. F., Künzel, S., Bik, E. M. and Petrov, D. A. 2013. Host species and
environmental effects on bacterial communities associated with Drosophila in the laboratory and in the natural environment. PLoS ONE 8, e70749.
Staudacher, H., Kaltenpoth, M., Breeuwer, J. A. J., Menken, S. B. J., Heckel, D. G. and Groot, A. T. 2016. Variability of bacterial communities in the moth Heliothis virescens indicates transient
association with the host. PLoS ONE 11, 1-21. 516 517 518 519 520 521 522 523 524 525 526 527 528 529 530 531 532 533 534 535 536 537 538 539 540 541 542 543 544 545 546 547 548 549 550 551 552
Takahashi, H., Saito, R., Miya, S., Tanaka, Y., Miyamura, N., Kuda, T. and Kimura, B. 2017.
Development of quantitative real-time PCR for detection and enumeration of Enterobacteriaceae.
Int J of Food Microbiol 246, 92 - 97.
R Core Team 2015. R: A Language and Environment for Statistical Computing.
Turnbaugh, P. J., Hamady, M., Yatsunenko, T., Cantarel, B. L., Duncan, A., Ley, R. E., Sogin, M. L., Jones, W. J., Roe, B. A., Affourtit, J. P. and others 2009. A core gut microbiome in obese
and lean twins. Nature 457, 480.
Vacchini, V., Gonella, E., Crotti, E., Prosdocimi, E., Mazzetto, F., Chouaia, B., Callegari, M., Mapelli, F., Mandrioli, M., Alma, A. and Daffonchio, D. 2017. Bacterial diversity shift
determined by different diets in the gut of the spotted wing fly Drosophila suzukii is primarily reflected on acetic acid bacteria. Env Microbiol Rep 9, 91-103.
Vandeputte, D., Kathagen, G., D’hoe, K., Vieira-Silva, S., Valles-Colomer, M., Sabino, J., Wang, J., Tito, R. Y., De Commer, L., Darzi, Y. and others 2017. Quantitative microbiome
profiling links gut community variation to microbial load. Nature 551.
Vasanthakumar, A., Handelsman, J. O., Schloss, P. D., Bauer, L. S. and Raffa, K. F. 2008. Gut
microbiota of an invasive subcortical beetle, Agrilus planipennis Fairmaire, across various life stages. Environ Entomol 37, 1344-1353.
Wang, Q., Garrity, G. M., Tiedje, J. M. and Cole, J. R. 2007. Naive Bayesian classifier for rapid
assignment of rRNA sequences into the new bacterial taxonomy. Appl Environ Microbiol 73, 5261-5267.
Wang, Y. and Rozen, D. E. 2017. Gut microbiota colonization and transmission in the burying
beetle Nicrophorus vespilloides throughout development. Appl Environ Microbiol 83, e03250-16.
Welte, C. U., de Graaf, R. M., van den Bosch, T. J. M., Op den Camp, H. J. M., van Dam, N. M. and Jetten, M. S. M. 2016. Plasmids from the gut microbiome of cabbage root fly larvae
encode SaxA that catalyses the conversion of the plant toxin 2-phenylethyl isothiocyanate. Environ
Microbiol 18, 1379-1390. 553 554 555 556 557 558 559 560 561 562 563 564 565 566 567 568 569 570 571 572 573 574 575 576 577 578 579
Tables
Table 1: PERMANOVA analysis of the community composition of the insect microbiota based on
different diversity indices, with the percentage of the variance explained by each variable and the p-value in brackets
Variable Jacc BC Uni wUni
A. All insects
Treatment 0.13 (1e-3) 0.19 (2e-3) 0.03 (0.07) 0.18 (1e-3)
B. Soil-reared insects
Site 0.14 (1e-3) 0.08 (2e-3) 0.09 (1e-3) 0.07 (6e-3)
Subsample 0.17 (1e-3) 0.18 (1e-3) 0.14 (3e-3) 0.20 (1e-3)
Jaccard distances (Jacc), Bray-Curtis distances (BC), Unifrac distances (Uni), weighted Unifrac distances (wUni). A. Comparison of soil-reared insects and control insects. Models contain one explanatory variable: soil treatment. B. Comparison of soil-reared insects. Models contained two explanatory variables: site and soil subsample
580
581
582
583
Figures Legends
Figure 1: Experimental design A. Location of the two sampling sites. CDS: Causse-De-La-Selle
(N43°49.884' E003°41.222'; CDS sample); MTF: Montferrier-sur-Lez (N43°40.801' E003°51.835'; MTF sample). B. At each sampling site, we obtained three soil subsamples at positions 10 m apart.
C. Distribution of insects in soil subsamples. Each soil subsample was split into four portions, each
of which was placed in a plastic box, in which it was mixed with sterilized wheat bran. Eight insects per soil subsample (two insects/box) were analyzed. Five insects placed in a box containing sterile wheat bran only were used as a control. D. Insects were placed, for five days, at 15 °C, in plastic boxes containing the soil subsamples mixed with sterile wheat bran. They were then starved by incubation for 24 hours in Petri dishes. The insects were then killed, their guts were dissected, and total DNA was extracted from each gut.
Figure 2: Alpha diversity of the gut microbiota A. Rarefaction curves. Each curve represents one
insect. Control insects, insects reared in CDS soil samples and insects reared in MTF soil samples are shown in yellow, blue and red, respectively. B. Alpha diversity indices for the insect gut microbiota. CDS1-3 and MTF1-3 are the subsamples from the sampling sites (three for CDS and three for MTF). BRAN is the control treatment: insects reared on sterile wheat bran. (i) Chao1 extrapolated richness. Pairwise Wilcoxon rank-sum test, CDS-MTF: p-value = 2e-3, BRAN-CDS: p-value = 2e-3, BRAN-MTF: p-value = 0.01 (ii) Shannon diversity index. Pairwise Wilcoxon rank-sum test, CDS-MTF: p-value = 1e-3, BRAN-CDS: p-value = 5e-05, BRAN-MTF: p-value = 8e-05
C. Taxonomic assignment of OTUs to family level. Each bar represents an insect. Each subsample
(i.e. CDS1-3 and MTF1-3) was divided into four portions, each of which was placed in a separate plastic box before the experiment. For each subsample, insects sharing the same letter (A, B, C or 585
D) were taken from the same plastic box. The 10 families with the largest relative abundances are shown in different colors, and the others are grouped together in the “Others” category.
Figure 3: PCoA analysis based on the four beta diversity distances. Each dot corresponds to one
insect. The percentage of variance explained by each axis is indicated in brackets. Yellow, blue and red dots correspond to BRAN (control), CDS and MTF samples respectively. For CDS and MTF samples, dot shape represents the identity of the soil subsample, i. e. CDS1, CDS2 and CDS3, or MTF1, MTF2 and MTF3.
Figure 4: Assignment of shared OTUs according to the V3-V4 region of the 16S rRNA gene A.
Venn diagram of OTUs found in at least one insect from each treatment. B. Bar plot of the relative abundance of the 44 OTUs common to the three treatments (in gray) and the 59 OTUs found only in soil treatments (CDS and MTF) (red stripes). The taxonomic assignment of these OTUs is detailed in C. and D.. Insects from the various treatment were pooled for these bar plots: 5 insects for BRAN, 24 insects for CDS and 22 insects for MTF. The relative abundance of OTUs was calculated from the total number of reads for each insect pool. We show here taxonomic assignments to genus level or to the lowest taxonomic level, for which the bootstrap score was < 80%. Some OTUs differ in sequence, but were assigned to the same taxonomic group. These sequences are differentiated by a number. On each graph, the 15 OTUs with the largest relative abundance are shown in color and the others are grouped together in the “Others” category. OTU names followed by a star (*) belong to the Enterobacteriaceae family.
Figure 5: Quantitative PCR on two taxa of the core microbiota A. Gene copy number (GCN) per
µL of DNA extract for Pse-16S, a specific marker of the genus Pseudomonas. Pairwise Wilcoxon 587
588
rank sum test with Holm p-value adjustment, BRAN-CDS: p-value = 0.013, BRAN-MTF: p-value = 0.013, MTF-CDS: p-value = 0.18. B. GCN per µL of DNA extract of Entero-rplP, a specific marker of the Enterobacteriaceae family. Samples from control (BRAN) had the maximum Ct value of 40, meaning that the initial Entero-rplP quantity was under the qPCR detection threshold, i.e. < 246 GCN. Pairwise Wilcoxon rank sum test with Holm value adjustment, BRAN-CDS: p-value = 0.016, BRAN-MTF: p-p-value = 0.016, MTF-CDS: p-p-value = 0.31.
Additional Files
Additional file 1: Relative abundance and taxonomic assignment of OTUs
according to the gyrB gene
Insects from the various treatments were pooled for these bar plots: 5 insects for BRAN, 24 insects for CDS and 22 insects for MTF. The relative abundance of OTUs was calculated from the total number of reads for each insect pool. We show here taxonomic assignments to genus level or to the lowest taxonomic level for which the bootstrap score was > 80%. Some OTUs differ in sequence but were assigned to the same taxonomic group. These sequences are differentiated by a number. On each graph, the 15 OTUs with the largest relative abundances are shown in color and the others are grouped together in the “Others” category. OTU names followed by a star (*) belong to the
Enterobacteriaceae family.
Additional file 2: Example of a microbiota pattern in PCR replicates
We checked the reproducibility of PCR, by performing three technical PCR replicates (the three bars of the chart) on a sample chosen at random, with the whole metabarcoding procedure performed separately for each replicate. We show here the results for the CDS1D3 sample.
Additional file 3: OBITools workflow for 16S rRNA analysis
RMD_OBITools_workflow_V3V4.pdf and RMD_OBITools_workflow_gyrB.pdf contain OBITools, bash and R scripts used to obtain the OTU abundance table from raw sequencing data for both the 16S rRNA and gyrB genes.
591 592 593 594 595 596 597 598 599 600 601 602 603 604 605 606 607 608 609
Additional file 4: Raw table of reads counts
tab_div_V3V4.csv and tab_div_gyrB.csv contain raw abundance data and diversity indices for each sample, as determined with the 16S rRNA and gyrB genes, respectively. Samples are shown in rows and OTUs in columns.
Additional file 5: OTU taxonomic assignment
V3V4_assignment.txt is the assignment data for each 16S rRNA OTU obtained with RDPclassifier and the RDPII database. gyrB_assignment.csv is the assignment data for each gyrB OTU obtained with the MOTHUR classifier and the Barret et. al 2014 reference database.
Additional file 6: Primers used for qPCR
PEstandard corresponds to PCR efficiency on gDNA standard samples, PEgut corresponds to PCR
efficiency on a pool of gut DNA from samples used for qPCR analysis.
Additional file 7: Statistical analysis workflow
RMD_R_workflow.pdf contains R scripts used to perform statistical analysis and to produce the figures presented in this study.
Additional file 8: R functions used in the statistical analysis workflow
src_routine_boostrap_threshold.R is an R function for extracting the lowest taxonomic level
according to a given bootstrap threshold from assignment files 610 611 612 613 614 615 616 617 618 619 620 621 622 623 624 625 626
A. B. CDS CDS2 3 soil subsamples CDS3 CDS1 MTF MTF2 3 soil subsamples MTF3 MTF1 C. D.
Each soil subsample (CDS1-3,MTF1-3)
Box A Box B Box C Box D
Control (BRAN):
sterile wheat bran Soil + branBox A-D
5 days 24h starvation
A. B. (i) (ii) BRAN CDS1 CDS2 CDS3 MTF1 MTF2 MTF3 20 40 60 80 100 Chao1 b n=24 c n=22 a n=5 BRAN CDS1 CDS2 CDS3 MTF1 MTF2 MTF3 0.0 0.5 1.0 1.5 2.0 2.5 3.0 3.5 Shannon b n=24 c n=22 a n=5 C. Enterobacteriaceae Pseudomonadaceae Moraxellaceae Aeromonadaceae Streptococcaceae Carnobacteriaceae Enterobacteriales Comamonadaceae Xanthomonadaceae Enterococcaceae Others 0.2 0.4 0.6 0.8 1.0 e ab undance of f amilies 0.2 0.4 0.6 0.8 1.0 0.2 0.4 0.6 0.8 1.0
● ● ●● ● ● ● ● ● ● ● ● ● ● ● −0.3 −0.2 −0.1 0.0 0.1 0.2 0.3 −0.5 −0.4 −0.3 −0.2 −0.1 0.0 0.1 0.2 Jaccard PCoA axis 1 (15 %) PCoA axis 2 (10 %) ● ● ● ● ● ● ● ● ● ● ● ● ● ● ● −0.6 −0.4 −0.2 0.0 0.2 −0.2 0.0 0.2 0.4 Bray−Curtis PCoA axis 1 (19 %) PCoA axis 2 (11 %) ● ● ● ● ● ● ● ● ● ● ● ● ● ● ● 0.0 0.1 0.2 −0.2 −0.1 0.0 0.1 0.2 0.3 Unifrac PCoA axis 2 (12 %) ● ● ● ● ● ● ● ● ● ● ● ● ● ● ● 0.0 0.1 0.2 −0.4 −0.3 −0.2 −0.1 0.0 0.1 wUnifrac PCoA axis 2 (18 %) Treatment: BRAN CDS MTF ● Subsample: 1 2 3
0 BRAN 7 CDS 0 MTF 2 1 52 44 Shared OTUs OTUs absent from BRAN 0.2 0.4 0.6 0.8 1.0 Relativ e ab undance of O TUs 0.2 0.4 0.6 0.8 1.0 Pseudomonas sp. 1 Enterobacter group 1 * Serratia sp. 1 * Pseudomonas sp. 2 Enterobacter group 2 * Aeromonas sp. Acinetobacter sp. Lactococcus sp. Carnobacterium sp Enterobacter group 2 * Delfia sp. Enterobacteriaceae * Gammaproteobacteria Stenotrophomonas sp. Serratia sp. 2 * Others Relativ e ab undance of O TUs
OTUs shared by the 3 treatments
Serratia Prevotella Enterobacteriales Serratia Pseudomonadales Enterobacteriaceae Enterobacteriaceae Comamonas Pseudomonas Burkholderiales Others 0.000 0.005 0.010 0.015 0.020 CDSMTF Relativ e ab undance of O TUs
OTUs absent from BRAN
A. D.
A. B. 4 5 6 7 8