HAL Id: hal-02756806
https://hal.archives-ouvertes.fr/hal-02756806v2
Submitted on 20 Jun 2020
HAL is a multi-disciplinary open access
archive for the deposit and dissemination of
sci-entific research documents, whether they are
pub-lished or not. The documents may come from
teaching and research institutions in France or
abroad, or from public or private research centers.
L’archive ouverte pluridisciplinaire HAL, est
destinée au dépôt et à la diffusion de documents
scientifiques de niveau recherche, publiés ou non,
émanant des établissements d’enseignement et de
recherche français ou étrangers, des laboratoires
publics ou privés.
Identification of Spatiotemporal Dispersion
Electrograms in Persistent Atrial Fibrillation Ablation
Using Maximal Voltage Absolute Values
Amina Ghrissi, Fabien Squara, Johan Montagnat, Vicente Zarzoso
To cite this version:
Amina Ghrissi, Fabien Squara, Johan Montagnat, Vicente Zarzoso. Identification of Spatiotemporal
Dispersion Electrograms in Persistent Atrial Fibrillation Ablation Using Maximal Voltage Absolute
Values. EUSIPCO-2020, 28th European Signal Processing Conference, Jan 2021, Amsterdam,
Nether-lands. �hal-02756806v2�
Identification of Spatiotemporal Dispersion
Electrograms in Persistent Atrial Fibrillation
Ablation Using Maximal Voltage Absolute Values
Amina Ghrissi
1, Fabien Squara
1,2, Vicente Zarzoso
1and Johan Montagnat
11 Universit´e Cˆote d’Azur, CNRS, I3S Laboratory, Sophia Antipolis, France 2 Universit´e Cˆote d’Azur, CHU Pasteur, Cardiology Department, Nice, France
Email:{amina.ghrissi, fabien.squara, vicente.zarzoso, johan.montagnat}@univ-cotedazur.fr
Abstract—Atrial fibrillation (AF) is a sustained arrhythmia whose mechanisms are still largely unknown. A recent patient-tailored AF ablation therapy is based on the use of a multipolar mapping catheter called PentaRay. This new protocol targets areas of spatiotemporal dispersion (STD) in the atria as potential AF drivers. However, interventional cardiologists localize STD sites visually through the observation of intracardiac electro-grams (EGMs). The present work aims to automatically char-acterize ablation sites in STD-based ablation. Recent research suggests that the distribution of the time series of maximal voltage absolute values at any of the PentaRay bipoles (VAVp) is affected by the STD pattern. Motivated by this finding, we consider VAVp as a key feature for STD identification. To our knowledge, this work applies for the first time statistical analysis and ML tools to automatically identify STD areas based on VAVp time series. Experiments are first conducted on synthetic data to quantify the effect of STD pattern characteristics (number of delayed leads, fractionation degree and number of fractionated leads) on engineered features of the VAVp time series like kurtosis, showing promising results. Then these features are tested on a real dataset of 23082 multichannel EGM signals from 16 different persistent AF patients. Statistical features like kurtosis and distribution (histograms) of VAVp values are extracted and fed to supervised machine learning (ML) classifiers, but no significant dissimilarity is obtained between the two categories. The classification of raw VAVp time series is finally conducted using ML tools like a shallow convolutional neural network combined with cross validation and data augmentation, reaching AUC values of 96%. Index Terms—persistent atrial fibrillation, spatiotemporal dis-persion, ablation, PentaRay multipolar catheter, maximal voltage absolute values, machine learning, classification, clustering.
I. INTRODUCTION
Atrial fibrillation (AF) is a sustained cardiac arrhythmia whose drivers and mechanisms are complex and still unknown. Hospitalizations related to AF represent nearly half million per year and it is estimated to yield almost one-hundred thousand deaths annually in the United States alone [1]. Among the existing therapies, ablation interventions prove very efficient compared to drug treatment. Ablation consists in applying radiofrequency (RF) energy using catheters to burn atrial tissue areas thought to be responsible for triggering and maintaining AF. A recent wholly patient-tailored AF ablation therapy, giving 95% of procedural success rate, is based on the use of a multipolar mapping catheter called PentaRay.
It targets areas of spatiotemporal dispersion (STD) in the atria as potential AF drivers. STD is defined a as delay of the cardiac activation perceived in intracardiac electrograms (EGMs) across neighboring leads. In practice, interventional cardiologists localize STD sites visually using the PentaRay catheter. The guidelines for STD identification from visual inspection claim that the multichannel EGM signal acquired by the PentaRay would exhibit a cardiac activation delay of 70% on a minimum of three contiguous bipoles [2]. However the visual identification of STD locations is prone to uncertainty due to the subjectivity of the interventional cardiologist. It is worth highlighting that thousands of cardiac sites are mapped in a typical ablation procedure.
This work aims to automatically characterize and identify ablation sites in an STD-based ablation. Numerical simulations in [2] suggest that the distribution of the time series of max-imal voltage absolute values at any of the PentaRay bipoles (VAVp), is affected by the dispersion pattern. Motivated by this finding, we suggest to consider VAVp as a key feature for STD identification. Two different approaches are investigated. First, engineered and statistical features are extracted manually from VAVp time series and fed to supervised classifiers like linear discriminant analysis (LDA) [3], support vector machines (SVM) [4] and a convolutional neural network (CNN) [5]. This first approach is called feature engineering. In particular, we study the kurtosis [6] and distribution (histogram) of VAVp time series. Synthetic multichannel EGMs are generated to mimic the STD pattern and to gradually evaluate its effect on VAVp statistics. The histograms of VAVp samples from both STD and non-STD real datasets are also clustered using hierarchical clustering analysis (HCA) [7]. Experiments are conducted on both synthetic and real datasets and several Monte Carlo (MC) simulations are carried out. The second approach is called automatic feature extraction. It consists in classifying raw VAVp recordings using supervised machine learning (ML) tools. Besides, cross validation (CV) [8] is used to avoid overfitting and data augmentation (DA) [9] is applied to handle the highly imbalanced dataset issue. Both approaches, feature engineering and automatic feature extraction, are complementary. On the one hand, the statistical
analysis is intuitive and easily interpretable although results are strongly dependent on an appropriate choice of features. On the other hand, even successful modern ML tools like CNN can automatically extract classification features from raw data through its deepest layers. However, these features are not easily interpretable and validated from a medical perspective. The study dataset of real signals includes a cohort of 23082 multichannel EGM recordings from 16 different persistent AF patients.
To our knowledge, this is the first time that statistical metrics and ML tools are used to automatically identify STD areas and characterize AF drivers for wholly patient tailored ablation protocols based on VAVp distribution.
II. AF ABLATION
A. Catheter Ablation of Persistent AF
AF is characterized by a disorganized activation in the upper chambers of the heart called atria. The atria start quivering, thus causing irregular fluctuations in the baseline, instead of beating effectively to eject blood into the ventricles. This results into a disorganized ventricular rate [1]. Motivated by the limits of drug treatment to cure persistent AF, ablation is an increasingly used therapy. It consists in burning the cardiac myocytes (cells) displaying irregular activation patterns with RF energy delivered through a catheter. A classical ablation protocol, called stepwise approach, consists in isolating the pulmonary veins, harboring the triggers taught to be respon-sible for initiating AF. Cardiac areas displaying complex fractionated electrograms (CFAE) are then ablated. However, a growing number of reports find little advantage in targeting CFAEs alone after PVI [10]. Instead, alternative criteria have been developed to ablate potential drivers throughout the atrial substrate [2].
B. STD-Guided Ablation
A breakthrough AF ablation therapy, giving 95% of proce-dural success rate, is based on the use of PentaRay mapping catheter. It targets areas of STD in the atria as potential AF drivers [2]. The PentaRay is a 20-pole high resolution catheter (Biosense Webster Inc, Irvine, CA, USA). In practice, the interventional cardiologist sequentially positions the catheter in various regions of the atria before ablation. Locations exhibiting a non synchronous cardiac activity observable on a minimum of three contiguous leads are called dispersion points and are tagged for ablation. It is claimed that dispersion areas represent clusters of electrograms, either fractionated (CFAE) or nonfractionated, displaying interelectrode time and space dispersion at a minimum of three contiguous leads [2], as shown in Fig. 1. However, the identification of STD areas is prone to errors and lack of reproducibility since it is performed visually by the cardiologist. In order to automatize STD identification, this work investigates statistical and ML tools that explain STD features.
Fig. 1: Dispersion areas delineated via a mapping approach [2]. A 1-2, A 3-4, B 5-6, B 7-8,C 9-10 and C 11-12 display STD.
III. METHODS
A. VAVp Time Series
The one-dimensional VAVp time series is calculated as follows: 1) the absolute values of each channel of the multilead EGM recording are computed to form the VAV matrix; 2) the maximal values of VAV over the leads dimension are computed at each time sample to form the VAVp signal. Numerical sim-ulations in [2] show that the histograms of VAVp distribution (h(VAVp)) depend on STD and that h(VAVp) is peaky and concentrated around zero if the virtual PentaRay is positioned in non-STD areas, at the periphery of a driver with slow excitation for instance, but it gets more spread for EGMs recorded in STD areas of the heart, like rotors as shown in Fig. 2 (Fig. 7 in [2]).
(A) (B) (C)
Fig. 2: VAVp distribution (A) at the center of the driver, rem-iniscent of patients’ dispersion areas, and (B) at the periphery of the driver. (C) In the interstitial fibrosis condition [2].
B. Kurtosis & Skewness
In statistics, kurtosis refers to a measure of peakedness of a distribution. It quantifies whether the data are heavy-tailed (high κ) or light-tailed (low κ) relative to a normal distribution (κ = 0). Skewness is a measure of the asymmetry of variable’s probability distribution around its mean. We compute unbiased estimates of kurtosis and skewness [6].
C. Histogram Clustering
Given a set of data samples, HCA partitions them into agglomerations using a homogeneity criterion, so that points within each cluster are similar and points from different clusters are dissimilar. HCA treats each observation as a singleton group at the beginning. Then it merges pairs of
groups until all clusters are agglomerated. The linkage can be presented by a dendrogram. A cutoff is then chosen and the clusters are formed [7].
D. Classification Algorithms & Metrics
Supervised ML techniques, namely LDA [3], SVM [4] and CNN [5], are trained on labeled datasets to classify samples from STD and non-STD categories. The model learns a classification rule then applies it to new data. The performance of ML models is evaluated through the following metrics: 1) accuracy; 2) area under the ROC curve (AUC); 3) sensitivity (true positive rate), measuring the proportion of actual STD samples that are correctly identified as such; 4) specificity (true negative rate), measuring the proportion of actual non-STD samples that are correctly identified as such.
E. Data Augmentation
The EGM dataset is highly imbalanced, as the ratio of STD samples to non-STD samples equals 5%. The insuf-ficient amount of STD samples leads to poor classification results in terms of sensitivity and AUC. One way of dealing with this issue is applying a DA method that is approved by cardiologists. DA consists in synthesizing new samples belonging to the minority class. Oversampling is a simple but effective DA option. It consists in forming a balanced super-dataset by replicating randomly samples from the minority class (STD) until they reach the number of the majority class (non-STD) [9].
IV. VAVPANALYSIS FORSTD IDENTIFICATION
A. Study Datasets
During the mapping phase, the PentaRay catheter is maintained stable for at least 2.5 s (sampling frequency fs = 1000Hz) at each atrial site then ten bipoles are
simul-taneously recorded per location. The recording can be stored in a matrix of 10 × 2500. A typical AF cycle length (AFCL) equals 250 ms.
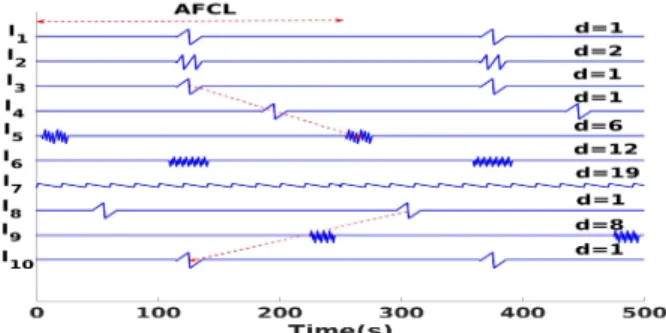
1) Synthetic Data: To build a realistic synthetic EGM model, we simulate the cardiac activation pattern as follows: 1) a one-dimensional sawtooth activation with a fundamental frequency Fref = 50 Hz and fs = 1000 Hz is synthesized; 2)
from this full signal, a unique sawtooth cycle (one “tooth”) is truncated; 3) the pattern is padded with zeros to form a single cardiac cycle of 250 samples; 4) this signal is replicated 10 times to form a full synthetic EGM of length 2500 noted EGMsaw. In order to include the fractionation
pattern in EGMsaw recording, we define d as the fractionation
degree. The fractionated signal EGMd
sawshould contain in each
AFCL interval d squashed sawtooth waveforms, generated by truncating and padding a sawtooth waveform of fundamental frequency equal to d × Fref, as described previously. EGMdsaw
is then multiplied by a normalization factor ensuring that the energy of the time discrete signal EGMdsaw is preserved for
all values of d ∈ N∗. The non fractionated signal corresponds to d = 1 and the totally fractionated signal corresponds to d = 19. Finally, the full synthetic multichannel EGM matrix
is formed by stacking the synthetic signals EGMd
saw in the
rows of a (10×2500) matrix. Each signal (channel) may have a different value of d as represented in Fig. 3. The 10 leads are denoted `1to `10. In order to simulate the activation delay
characteristic of STD, we introduce a cyclic shift of 35% of AFCL over two successive channels (matrix rows). As a result three consecutive leads would have a total delay of 70%. Fig. 3 shows that the delay slope may be positive (leads `3 `4, `5)
or negative (leads `8, `9, `10).
Fig. 3: Example of a synthetic multichannel EGM recording. 2) Real Data: The Cardiology Department of Nice Univer-sity Hospital Center (CHU) affords the data of multichannel EGM recordings of 16 patients with persistent AF. All patients were ablated after analysis of the cartographies acquired with the PentaRay and visual tagging of STD areas. A phase of data acquisition, anonymization and cleaning was needed. EGMs presenting spatiotemporal dispersion according to the cardiologist are annotated with “STD”, while other labels are merged into the “non-STD” class. For each cartography of each patient, 10 EGM bipoles are recorded per location. Each acquisition can be stored in a (10 × 2500) EGM data matrix.
V. EXPERIMENTS
Experiments including the analysis of VAVp statistics, his-tograms clustering and classification belong to the feature en-gineering approach. Whereas, the automatic feature extraction approach consists in classifying the raw VAVp signals. A. VAVp of Synthetic Data
As a first attempt, we investigate the effect of the number of delayed channels (Ndelay) on the VAVp distribution. Fig. 4
shows that as Ndelaygrows, the kurtosis decreases which means
that the distribution becomes flatter and fairly symmetric. In absence of fractionation (d = 1) and for Ndelay= {1, 2, 3, 4}
we have κ > 0, the VAVp histogram approximates a normal distribution (κ ≈ 0) for Ndelay = {5, 6} but the kurtosis
becomes negative for Ndelay = {7, 8, 9}. This experiment is
computed for different delay values {40, 70, 100} ms. The resulting curves almost coincide which means that delay range is not significant.
The combined effect of fractionation and delay of contigu-ous leads is assessed through MC simulations and the results are shown in Fig. 4 for d = 8 and d = 16. For each Ndelay, 100
the number (Nfrac) of the fractionated leads and their positions
are selected at random. Then, VAVp distribution statistics are computed. Finally, the average values of kurtosis and skewness are obtained. The curves in Fig. 4 show the resulting kurtosis for d = 8 and d = 16 over the 100 MC simulations. The values are presented as mean ± standard deviation. We notice that similar behavior is obtained for d = 1 and d = 8. However for more fractionated signals (d = 16) the kurtosis decreases from 4 to 0. The distribution passes smoothly from peaky to normal as Ndelay grows. Though not shown for lack
of space, experiments also demonstrate that skewness is a negative function of d which means that the VAPp distribution gets symmetric as d grows. Besides, skewness is much less sensitive to Ndelay compared to kurtosis.
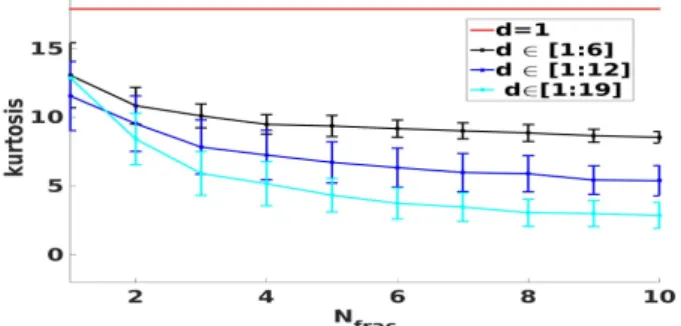
Fig. 4: Effect of the delay on VAVp distribution. In order to asses the effect of fractionation on VAVp distri-bution, fractionated multichannel EGMs are generated. Each synthetic matrix contains a growing number of fractionated leads Nfrac ∈ [1, 10]. The fractionation degrees are divided
into three ranges {[1, 6], [1, 12], [1, 19]}. For each range and for each Nfrac, a series of 100 MC simulations is conducted
where the fractionation degrees are chosen randomly in that range. The values of kurtosis are computed as in the previously described experiment. Fig. 5 shows that the kurtosis is a negative function of both the Nfrac and d. The effect of Nfrac
on the distribution is less important than d regarding the slope of the curves (Fig. 5).
Fig. 5: Combined effect of fractionation on VAVp distribution. To summarize, VAVp distribution gets flatter and its tail lighter as the dispersion patterns represented by the number of delayed leads, fractionation degree and fractionated lead po-sitions are emphasized whether simultaneously or separately.
B. VAVp of Real Data
1) Kurtosis Analysis: We compute the kurtosis of multi-channel EGM samples belonging to both STD and non-STD datasets. The ranges of values are in the following intervals: κSTD ∈ [2, 410] while κnon-STD∈ [1, 621] and mean values are
both very high, namely, κSTD= 23±34 and κnon-STD= 29±41,
which means that in average both VAVp distributions have sharp histograms but the STD is slightly flatter than the non-STD VAVp distribution. As a result, we conclude that looking at metrics related to the VAVp histograms like kurtosis is not a significant hand engineered feature in STD identification.
2) Histogram Clustering and Classification: We attempt to analyze the VAVp histograms coming from both STD (h(VAVp)STD) and non-STD (h(VAVp)non-STD) datasets. We
first cluster the histograms of each class separately using the HCA [7] algorithm. We opt for Hellinger distance [11] as a homogeneity criterion because it is a recommended metric to measure the similarity between sparse data like histograms. Cutoff values are chosen visually from the dendrograms. We opt for 6 STD and 10 non-STD clusters of h(VAVp) then we compute the averaged histograms of the representative element of each cluster. No obvious dissimilarity in terms of histogram sharpness nor flatness is obtained by comparing STD to non-STD clusters as shown in Fig. 6. For instance, clusters 4 and 5 belonging respectively to STD and non-STD categories are both sharp reflecting a synchronized cardiac activation between the channels of the EGM sample. Similarly, clusters 3 and 8 belonging respectively to STD and non-STD categories are both flat reflecting a non-synchronized cardiac activation between the EGM channels. However, we notice that the h(VAVp)non-STD of some clusters (cluster10)
are sparse compared to h(VAVp)STD. This finding rejects the
hypothesis that VAVp distribution is a key variable in STD identification, as confirmed by both experiments on simulated data in Sec. V-A added to Figures 7 and 8 in the medical reference [2]. To confirm this finding, we try to classify the
Fig. 6: VAVp histograms of the STD (blue) and non-STD (red) clusters.
labeled histograms into STD vs. non-STD using ML tools like LDA, SVM with both linear and Gaussian filter and a shallow CNN but the classification performance is very poor. Similar results are obtained with both balanced and non balanced training sets. This result may be explained by the two following reasons:
• First, the non-STD class contains a wide range of mul-tichannel EGM types that certainly have different patterns
that would result in a wide range of kurtosis and VAVp distributions.
•Second, the labels of STD samples do not contain detailed information about the number of CFAE leads neither the positions of delayed leads. As a result the STD dataset can be assimilated to a bag containing samples with all possibilities of delay values, Ndelay, Nfrac and fractionation degrees.
3) Raw VAVp Classification: Motivated by the poor results obtained with the analysis of VAVp distribution, we propose in this section to analyze the raw VAVp time series. To this end, we train supervised ML models with the labeled dataset. The classifiers used are: 1) LDA; 2) SVM with a Gaussian kernel (experiments showed that the performance of a Gaussian kernel is superior to the linear one); 3) shallow CNN composed of a 1D convolutional layer with 32 nodes followed by a dropout layer with a probability equal 0.2 then a fully connected layer with a sigmoid (linear regression) activation function. Dropout is a regularization technique [12]. We tried to add several types of pooling layers (max, average and global average) to the CNN architecture but it degraded the classifiers’s performance. In order to handle overfitting and asses the ability of the trained ML models to generalize the classification rule, we use 5-fold cross validation (CV) technique [8] [13]. In order to train the CNN, we use ADAM optimizer [14] with validation AUC as an early stopping criteria. In each CV round, the test dataset is partitioned into two equal-sized subsets that will form the new validation and test sets. This guarantees that the model does not see the test samples during the training phase. Classification results on the test set are given in Tab. I. The values of accuracy, AUC, sensitivity and specificity are around 90% and present a very low variability (10−3). However, we notice that the performance of LDA is inferior to the non linear classifiers (SVM and CNN). For instance, the AUC value of the CNN is 96% while it is equal to 90% for the SVM and 87% for the LDA. The AUC informs about the combined true classification rates of both STD and non-STD classes. The superiority of the CNN may be explained by the ability of this model to automatically extract key classification features through its convolutional filters.
TABLE I: VAVp time-series classification performance.
Accuracy AUC Sensitivity Specificity LDA 0.883 ± 0.007 0.866±0.006 0.848±0.020 0.885±0.008 SVM 0.927±0.004 0.905±0.009 0.880±0.022 0.930±0.005 CNN 0.917±0.005 0.964±0.009 0.867±0.015 0.922±0.004
VI. CONCLUSION ANDPERSPECTIVES
Motivated by the finding [2] that the distribution of VAVp signals is affected by the STD pattern, we propose to auto-matically identify STD areas in multichannel EGM recordings in persistent AF through two complementary approaches. Preliminary experiments using synthetic signals in controlled conditions demonstrate that VAVp engineered features like kurtosis are indeed good indicators of STD in AF multipolar
EGMs. However, experiments on real AF data show that these features do not allow STD identification. Likewise, VAVp histograms of STD and non-STD datasets clustered using HCA do not present significant dissimilarities. Modern ML tools that automatically identify characteristic features from the raw VAVp time series are more efficient, with AUC up to 96% for CNN.
Further research will aim at designing optimized ML ar-chitectures with higher performance rates. Building deeper classifiers and interpreting, from a medical perspective, the automatic features synthesized by the deep architecture would bring knowledge to better characterize the persistent AF ar-rhythmia. Another perspective is to increase the database of persistent AF patients in order to provide more relevant clinical results.
ACKNOWLEDGMENT
This work is partly funded by the French government PIA program, IDEX UCAJEDI project (ANR-15-IDEX-0001).
REFERENCES
[1] C. T. January, et al. “2014 AHA/ACC/HRS guideline for the manage-ment of patients with atrial fibrillation: a report of the American College of Cardiology / American Heart Association Task Force on Practice Guidelines and the Heart Rhythm Society,” Journal of the American College of Cardiology, 64(21), 2014.
[2] J. Seitz, et al. “AF ablation guided by spatiotemporal electrogram dispersion without pulmonary vein isolation: a wholly patient-tailored approach,” Journal of the American College of Cardiology, 69(3), pp. 303–321, 2017.
[3] D. I. Ellis and G. Royston. “Metabolic fingerprinting in disease di-agnosis: biomedical applications of infrared and Raman spectroscopy,” Analyst 131(8), pp. 875–885, 2006.
[4] F. Melgani and B. Yakoub. “Classification of electrocardiogram signals with support vector machines and particle swarm optimization,” IEEE Trans. on Information Technology in Biomed. 12(5), pp. 667–677, 2008. [5] B. Pyakillya, N. Kazachenko, and N. Mikhailovsky. “Deep learning for ECG classification,” Journal of Physics: Conference Series, 913(1), IOP Publishing, 2017.
[6] D. N. Joanes and C. A. Gill. “Comparing measures of sample skewness and kurtosis,” Journal of the Royal Statistical Society: Series D (The Statistician) 47(1), pp. 183–189, 1998.
[7] C. D. Manning, R. Prabhakar and S. Hinrich. Hierarchical clus- tering. “In Introduction to information retrieval,” Cambridge University Press, pp. 378–401, 2008.
[8] R. Kohavi, et al. “A study of cross-validation and bootstrap for accuracy estimation and model selection,” Proceedings of the Fourteenth Interna-tional Joint Conference on Artificial Intelligence, 14(2), 1995. [9] C. Shorten and L. K. Taghi. “A survey on image data augmentation for
deep learning,” Journal of Big Data 6(1), p. 60, 2019.
[10] A. Verma, et al. “Approaches to catheter ablation for persistent atrial fibrillation,” New England Journal of Medicine, 372(19), pp. 1812–1822, 2015.
[11] S. H. Cha. “Comprehensive survey on distance/similarity measures between probability density functions,” City 1(2) , p. 1, 2007. [12] N. Srivastava, et al. “Dropout: a simple way to prevent neural networks
from overfitting,” The Journal of Machine Learning Research 15(1), pp. 1929–1958, 2014.
[13] M. Kuhn and J. Kjell. Applied predictive modeling. Springer, 26, p. 70, 2013.
[14] P. K. Diederik and B. Jimmy . “Adam: A method for stochastic optimization,” ICLR, ArXiv Preprint arXiv:1412.6980 9, 2015.
![Fig. 1: Dispersion areas delineated via a mapping approach [2].](https://thumb-eu.123doks.com/thumbv2/123doknet/13430821.408846/3.918.471.854.77.260/fig-dispersion-areas-delineated-via-a-mapping-approach.webp)