HAL Id: hal-00736721
https://hal.archives-ouvertes.fr/hal-00736721
Submitted on 28 Sep 2012
HAL is a multi-disciplinary open access
archive for the deposit and dissemination of
sci-entific research documents, whether they are
pub-lished or not. The documents may come from
teaching and research institutions in France or
abroad, or from public or private research centers.
L’archive ouverte pluridisciplinaire HAL, est
destinée au dépôt et à la diffusion de documents
scientifiques de niveau recherche, publiés ou non,
émanant des établissements d’enseignement et de
recherche français ou étrangers, des laboratoires
publics ou privés.
rate estimation from weather radar
Sébastien Verrier, Laurent Barthès, Cécile Mallet
To cite this version:
Sébastien Verrier, Laurent Barthès, Cécile Mallet. Scaling properties of rainfall and their impact
on rain rate estimation from weather radar. ERAD 2012, 7th European Conference on Radar in
Meteorology and Hydrology, Jun 2012, Toulouse, France. 5 pp. �hal-00736721�
Scaling properties of rainfall and their impact on
rain rate estimation from weather radar
S. Verrier1, L. Barthès1, C. Mallet1
1Université Versailles Saint-Quentin – CNRS/INSU – LATMOS/IPSL,
11 bd d’Alembert 78280 Guyancourt, France, contact : verrier@latmos.ipsl.fr
1. Introduction
Radar rainfall estimates are generally computed from radar measurements using (semi-)theoretical relationships between the reflectivity Z and the rain rate R. The most classical relationships consist of power laws of the form :
(Eq. 1)
where a and b are unknown constants. These constants are strongly dependent on the shape of the drop size distribution (DSD). For instance, in the case of a Gamma DSD with parameters (N0, µ, Λ), b depends on µ and a on (N0, µ). More
generally, a strong uncertainty in the estimation of rainfall intensities from (Eq. 1) remains due to the empirical variability of parameters a and b, which vary respectively in the range of values 30-1000 and 0.8-2 (Smith and Krajewski, 1993; Morin et al., 2003). Various physical and statistical phenomena are expected to contribute to this variability. The parameters a and b depend not only of the rainfall type (i.e. convective vs. stratiform) but also on the more subtle physical processes involved in rainfall (Rosenfeld and Ulbrich, 2003), such as coalescence, breakup, or evaporation. Statistical and observational constraints also affect the empirical Z-R relationships, which are highly dependent on methodological aspects such as the type of regression (Campos and Zawadzki, 2000) and on observational errors (e.g., Ciach and Krajewski, 1999). Another possibly important statistical source of uncertainty is the intrinsically statistical definition of the DSD, which is well defined over large spatial and temporal domains of integration, but which may be expected to be largely variable in the interior of such domains.
Due to inhomogeneities in DSD and to the extreme spatial and temporal variability of rain intensities and reflectivities, the
Z-R relations are expected to be sensitive to aggregation over domains of different volumes and durations. Moreover, the
non-linearity of the Z-R equation associated with the (at least approximate) linearity of aggregation processes prevents the (a,b) couple of parameters to be strictly conserved. Morin et al. (2003) have shown empirically the existence of a scale-dependency of Z-R law parameters based on the study of collocated radar and rain gauge data aggregated at different scales (1-5 km, 5-120 min). These authors found a quick increase of a with scale as well as a moderate decrease of the parameter b. They attributed a significant part of the change in parameters to the averaging of observational errors with pixel aggregation. However, they cannot distinguish the purely statistical contribution of rain inhomogeneities since their study involved systematic comparison of radar data and rain gauges which adds instrumental and methodological errors.
In this paper we consider an alternative approach based on the measurements of a Dual-Beam Spectropluviometer (DBS), in Palaiseau (France). This instrument, described elsewhere (Verrier et al., 2011), provides measurements of diameter, fall speed and time of arrival of raindrops. The latter data can therefore be used to compute simultaneous rain rates and reflectivity factors that can be compared without instrument-to-instrument discrepancy. In Sect. 2, some notions of statistical scaling are quickly recalled and consequences on Z-R relations are derived. In Sect. 3, we present the empirical methodology and we end with a discussion in Sect. 4.
2. From scaling to scale-dependent Z-R relationships
Rainfall variability is characterized by remarkable statistical symmetries that can be interpreted in the framework of (multi)fractals and turbulent-like random cascade models (e.g., Tessier et al., 1993; Fraedrich and Lardner, 1993; Deidda et al., 1999; Lilley et al., 2006; Verrier et al., 2011). These symmetries can be represented by a variety of stochastic models yet generically result in remarkable power law scaling properties of power spectra, namely
(Eq. 2)
As reported in (Molini et al., 2009), different scaling regimes can be distinguished for rainfall processes with different meteorological interpretations. Scales smaller than a few hours are characterized by a steep scaling regime with exponent β > 1, likely associated with storms and convection. At larger timescales up to a few days, a scaling with β ~ 0.5 holds and seem to be representative of large frontal systems. Finally, timescales larger than a few weeks are characterized by a spectral plateau with constant power density.
Moreover, more subtle scaling properties have been empirically demonstrated for rainfall (de Lima and Grasman, 1999; Lovejoy et al., 2008; Verrier et al., 2011), i.e. “multifractal” symmetries which consist of scaling properties of statistics of various orders (i.e. not only spectra or autocorrelations). By denoting a field (e.g., rain intensity) aggregated over grid of pixel size l, the field is said multifractal if there exist a range of (possibly non-integer) orders such that all moments of order q in this range are power law functions of scale:
(Eq. 3)
The scaling exponent is dependent on the order q and defines the “moment scaling function” K(q) that entirely characterizes the statistics of the field. Usually, K(q) is determined by the knowledge of a reduced set of “universal” parameters (Schertzer and Lovejoy, 1987, She and Levêque, 1994).
Let us now derive some consequences of the (multi)fractality of rain on Z-R relationships. At the spatial (or even temporal) scale l, suppose that (Eq. 1) is accurately followed:
(Eq. 4)
where a and b can now depend on the scale l (but are independent on Z and R).
Now we can use the fact that both Z and R follow well-established multifractal properties (e.g., Lilley et al., 2006; Lovejoy et al., 2008). By taking the q-th order moment in both sides of (Eq. 4) and from the multifractal equation (Eq. 3), we obtain with trivial notations:
(Eq. 5)
The previous equation subtlety constraints the “universal” parameterization of KR(q) and KZ(q). For simplification, let us
assume that a and b are deterministic functions of scale. Since the scaling exponent do not depend (by definition) of scale , b should therefore be constant with scale. Let us now focus on the special case q = 1, we find:
(Eq .6)
In the case of linear averagings, the mean of the reflectivity should be conserved scale by scale, hence KZ(1) = 0.
Therefore, if multifractality simultaneously holds for R and Z, the Z-R relationships are characterized by:
b = constant
(Eq. 7)
The coefficient a should therefore be power-law of scale, with scaling exponent that can be demonstrated (from multifractal theory) to be positive when b>1 and negative when b <1.
3. Empirical study
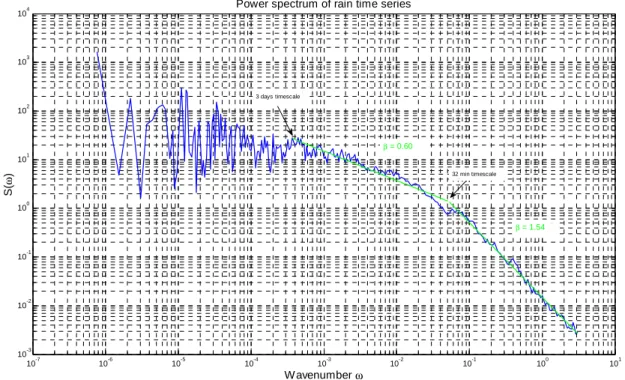
The measurements of the DBS (drop diameter and fall velocity), starting in July 2008 and ending in July 2010, are used to estimate rain rates and reflectivities. The rain rates can be estimated from the counting of the drops, and from their diameters and fall speed consistently with the definition . Similarly, the reflectivity factors are estimated from the definition . This provides time series of R and Z at 15-s resolution. These series have been previously demonstrated to follow multifractal statistics at mesoscale and submesoscale in a detailed study (Verrier et al., 2011). To illustrate more simply the scaling properties of these series, let us consider the graph represented on Fig. 1. The latter represent the power spectrum of the rain rate series with logarithmic axes. The two linear portions correspond to scaling regimes with different scaling exponents. These scaling regimes (3 days - 32 min, 32 min – 30 s) are coherent with those reported by Fraedrich and Lardner (1993) and Molini et al. (2009), yet this figure shows that the submesoscale regime extends down to very small scales.
10-7 10-6 10-5 10-4 10-3 10-2 10-1 100 101 10-3 10-2 10-1 100 101 102 103 104
Power spectrum of rain time series
W avenumber ω S ( ω ) β = 0.60 β = 1.54 3 days timescale 32 min timescale
Fig. 1 Power spectrum of the DBS rain rate series, represented in logarithmic coordinates
These Z and R high resolution time series can then be degraded at various coarser resolutions by simple averages of contiguous values. In this study, we are mainly interested by Z-R relationships at submesoscale, hence mainly for scales smaller than 0.5-1 h. Since a power-law phenomenology is expected, it is pertinent to systematically consider logarithmically regularly spaced averaging factors.
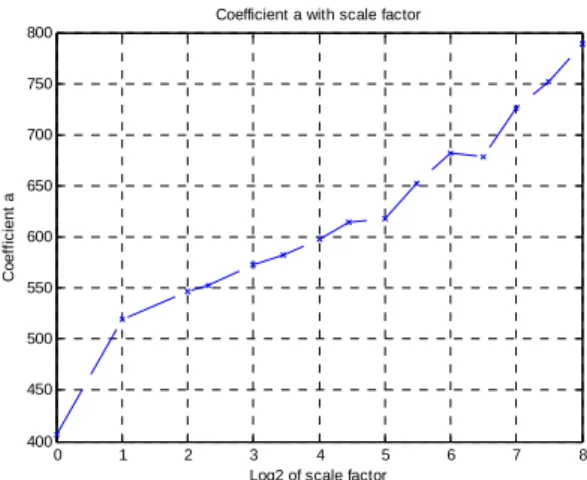
Linear regressions may be performed on log(R)-log (Z) scatterplots in order to estimate a and b. However, this leads (at 15 s resolution) to a rather unsatisfactory coefficient of determination R² of about 0.6. In order to limit the discrepancies due to the specific properties of individual events (unusual weather types etc.), we averaged log(R) and log(Z) over logarithmically equally spaced bins of rain intensities. This provides the plot represented on Figure 2a. The good linearity of the graph (in logarithmic scale) demonstrates the existence of an underlying optimal Z-R relation for most rainfall events, with exponents a = 406 and b =1.54 at 15 s resolution (and R² = 0.997). Then, the same kind of regression is applied to coarse-scale points, namely the rain intensities and reflectivity factors averaged at coarser resolutions (i.e., timescales comprised between 30 s and 64 min). The graphs of a and b as functions of the log of the scale factor are given on Fig. 2b and 2c. We notice a slight decrease of b and a quicker increase of a as scale increases (note that the spatial scale are represented in logarithmic scale). If we now plot the graph of a in log-log coordinates (see Fig. 2d), the variations of a are rather coherent with a power-law of exponent 0.083 for timescales between 30 s and 64 min.
However, the averagings performed above to estimate low-resolution aggregate data did not distinguish rainfall and zero-rainfall data. Then, the coarse-scale estimates may be sensitive to subscale zero-rainfall zeros. In order to avoid this problem, we also selected 15 almost continuous rainfall events of duration ~ 1 h and containing significant peaks (> 20 mm/h). These events were degraded in Z and R at various coarse resolutions in the interval 15 s to 4 min, thus providing a log(R) - log(Z) scatterplot at each of the chosen scales. As shown in Figs. 3a and 3b, the Z-R parameters are also scale-dependent in this case, with b slowly linearly decaying from 1.53 to 1.37 and a increasing like a 0.14-power-law from 270 to 400 in the scale range 15 s – 4 min. This tendency seems even to hold at larger scales even though a significant noise appears due to insufficient sample size in linear regression (figure not shown here). It is not surprising that contrary to Figs. 2, the scaling holds down to scales as small as 15 s, since we have selected intense rainfall events that are not sensitive to any instrumental noise even at such scales.
To sum up, the empirical Z-R relations are indeed scale-dependent in a way that confirms the predictions of the multifractal theory, even though the parameter b seems to vary also (coherently with the study by Morin et al. (2003)). These empirical relations have been confirmed with other complementary methodologies not detailed in this paper (such as nonlinear regressions).
-3 -2 -1 0 1 2 3 4 5 2 4 6 8 10 12 14
Scatterplot logR-logZ for f=1
log(R)
lo
g
(Z
)
Fig. 2a Plot of log(Z)-log(R) of DBS time series, including averaging over logarithmically spaced bins of rain rate. 0 1 2 3 4 5 6 7 8 400 450 500 550 600 650 700 750 800
Coefficient a with scale factor
Log2 of scale factor
C o e ff ic ie n t a
Fig.2b Plot of parameter a for DBS series as a function of the log of the scale factor λ = scale/(15 s). Here abscissa 0 means 15 s, 2 means 1 min, 4 ~ 4 min and so on.
0 1 2 3 4 5 6 7 8 1.4 1.42 1.44 1.46 1.48 1.5 1.52 1.54 1.56
Coefficient b with scale factor
Log2 of scale factor
C o e ff ic ie n t b 0 1 2 3 4 5 6 7 8 8.4 8.6 8.8 9 9.2 9.4 9.6 9.8
Coefficient a with scale factor
Log2 of scale factor
C o e ff ic ie n t a ( lo g 2 )
Fig. 2c Plot of parameter b as a function of the log of the scale factor λ = scale/(15 s).
Fig. 2d Same as Fig. 1b with a represented in logarithmic scale. The fit line has slope 0.083.
0 0.5 1 1.5 2 2.5 3 3.5 4 4.5 5 1.3 1.35 1.4 1.45 1.5 1.55
Coefficient b with scale factor
Log2 of scale factor
C o e ff ic ie n t b 0 0.5 1 1.5 2 2.5 3 3.5 4 4.5 5 8 8.1 8.2 8.3 8.4 8.5 8.6 8.7 8.8 8.9 9
Coefficient a with scale factor
Log2 of scale factor
C o e ff ic ie n t a ( lo g 2 )
Fig. 3a Plot of parameter b as a function of the log of the scale factor, for 15 selected rainfall events
Fig. 3b Log-log plot of a as a function of scale factor, for the rain events. The fit line has slope 0.14.
4. Discussion
In this paper, a scaling approach was proposed to model scale dependency of Z-R relationships parameters. This approach predicts that the parameter a increases like a (slow) power law of spatial or temporal scale, which is accurately retrieved from rain intensities and reflectivities computed from disdrometer measurements. If the parameter b is constant, this would lead to a systematic underestimation of rainfall rates at larger scales. For instance, suppose that a relation Z = 200R1.5 is valid at some place and time for a ground based radar with resolution 400 m. If this relation was applied to a space-borne precipitation radar with pixel size 4 km, the rain rate will not be retrieved accurately since the a parameter should be multiplied by (4000/400)α where α is a scaling factor (say, 0.08, accordingly with previous section). With b = 1.5, rain rates estimated from space-borne radar reflectivities will therefore be multiplied by a spurious factor (4000/400)-α/b = 0.86, hence -11.5 % of systematic statistical error.
Furthermore, even with a single radar of fixed resolution a “scale problem” is likely to occur. With a ground based radars, maps in polar coordinates have pixels whose surface is proportional to the distance. Hence, pixels that are far from the radar are possibly subject to a systematic underestimation of rain rates (at 100 km of distance and with the α and b parameters of the above example, this would lead to a similar error).
The “scale problem” could even be more critical since the study of rain events in the previous section seems to show that within rain events, the scaling exponent α such that would be greater (~ 0.14). In this case, the error in rain rate associated with scale-dependent Z-R relationships would reach -20%.
An important additional remark is that the scale-dependency described in Sects. 2 and 3 is a purely statistical property. In real radar applications, other artifacts such as the influence of the observational errors that decrease with spatial and temporal integrations, or as the difficulties associated with instrument-to-instrument intercomparison (radar-gauges) also contribute to an additional scale-dependency. The contributions of each artifact need to be estimated and compared, and the addition of all of them should significantly impact the estimation of rainfall intensities by radar.
References
Campos E., Zawadzki I., 2000: Instrumental uncertainties in Z-R relations. J. Appl. Met., 39, 1088-1102
Ciach, G., Krajewski, W. F., 1999: Radar-Rain Gauge Comparisons under Observational Uncertainties. J. Appl. Met., 38, Issue 10, 1519-1525
Deidda R., Benzi R., Siccardi F., 1999: Multifractal modeling of anomalous scaling laws in rainfall. Wat. Resour. Res., 35, 1853-1867 Fraedrich K., Larnder C., 1993: Scaling regimes of composite rainfall time series, Tellus, 45, 289-298.
Lilley, M., Lovejoy S., Desaulniers-Soucy N., Schertzer D., 2006: Multifractal large number of drops limit in rain. J. Hydrol., 328, 20-37. Lovejoy, S., Schertzer D., Allaire V., 2008: The remarkable wide range spatial scaling of TRMM precipitation. Atmos. Res., 90, 10-32, doi
10.1016/j.atmosres.2008.02.016.
Molini A., Katul G. G., Porporato A., 2009: Revisting rainfall clustering and intermittency across different climatic regimes. Wat. Resour.
Res., 45, doi:10.1029/2008WR007352
Morin E., Krajewski W.F., Goodrich D., Xiaogang G., Sorooshian S., 2003: Estimating rainfall intensities from weather radar data: the scale-dependency problem. J. Hydromet., 4, 782-797
Rosenfeld, D. and C. W. Ulbrich, 2003: Cloud microphysical properties, processes, and rainfall estimation opportunities. Meteorological
Monographs, 30, 237{237.
Schertzer, D., S. Lovejoy, 1987: Physically based rain and cloud modeling by anisotropic, multiplicative turbulent cascades. J. Geophys.
Res., 92, 9692-9714.
She Z. S., E. Levêque, 1994: Universal scaling laws in fully developed turbulence. Phys. Rev. Lett., 72, 336–339.
Smith, J. A. and W. F. Krajewski, 1993: A modeling study of rainfall rate-reflectivity relationships. Water Resour. Res., 29(8), 2505– 2514, doi:10.1029/93WR00962.
Tessier, Y., Lovejoy, S., Schertzer, D., 1993: Universal multifractals in rain and clouds: theory and observations. J. Appl. Meteorol.; 32, 223–250.
Verrier, S., C. Mallet, and L. Barthès, 2011: Multiscaling properties of rain in the time domain, taking into account rain support biases.