HAL Id: insu-00800017
https://hal-insu.archives-ouvertes.fr/insu-00800017
Submitted on 13 Mar 2013
HAL is a multi-disciplinary open access archive for the deposit and dissemination of sci-entific research documents, whether they are pub-lished or not. The documents may come from teaching and research institutions in France or abroad, or from public or private research centers.
L’archive ouverte pluridisciplinaire HAL, est destinée au dépôt et à la diffusion de documents scientifiques de niveau recherche, publiés ou non, émanant des établissements d’enseignement et de recherche français ou étrangers, des laboratoires publics ou privés.
coastline for investigating erosion by cliff collapse
Albert Genter, Anne Duperret, A. Martinez, R.N. Mortimore, J.-L. Vila
To cite this version:
Albert Genter, Anne Duperret, A. Martinez, R.N. Mortimore, J.-L. Vila. Multiscale fracture analysis along the French chalk coastline for investigating erosion by cliff collapse. Geological Society of London. Coastal Chalk Cliff Instability, Geological Society of London, pp.57-74, 2004, Engineering Geology Special Publications 20, �10.1144/GSL.ENG.2004.020.01.04�. �insu-00800017�
Multiscale fracture analysis along the French chalk coastline for investigating
erosion by cliff collapse
Albert Genter
1, Anne Duperret
2, Alexandra Martinez
2, Rory N. Mortimore
3,
Jean-Lou Vila
11. BRGM, CDG/ENE, 3 avenue Claude Guillemin, BP 6009, 45060 Orléans Cedex 2, France
2. Laboratoire de Mécanique, Physique et Géosciences, Université du Havre, 25 rue Philippe Lebon,
BP 540, 76 058 Le Havre Cedex, France
3. Applied Geology Research Unit, University of Brighton, Moulsecoomb, Brighton, BN24GJ, United
Kingdom
Corresponding author: a.genter@brgm.fr
Revised version to the Geological Society of London : 20th March 2003 Special issue: ”Coastal chalk cliff instability”
Numbers of words of text: 6569
Numbers of references: 18
Numbers of tables: 2
Numbers of figures: 13
Abbreviated title : Fractures and coastal cliff collapse
Abstract: Coastal cliffs of Upper Normandy and Picardy are eroded by cliff collapses of various sizes. This paper presents a multi-scale analysis of the pre-existing fractures embedded within the
Cretaceous chalk. About 20 representative sites equally spaced along the 120-km long coastal section
were analyzed and compared to a continuous structural analysis of the coast derived from aerial
photographs taken in 1986. Ancient collapses interpreted on the aerial photos were compared to the
pre-existing fracture content. Regional faults, pre-1986 collapse location and fracture density are
spatially correlated. However, recent collapses observed on the field between 1998 and 2001 did not
systematically correlate to the pre-existing fracture occurrence and therefore, there is no clear link
Keywords: Coastal cliff erosion, Fracture network, Cretaceous chalk, Upper Normandy, France
Coastal cliff erosion in Cretaceous chalk
Erosion of chalk cliffs by collapse is a serious geohazard that induces coastal retreat. In order to
understand the cliff collapse mechanism, a multidisciplinary research project co-funded by Europe,
called ROCC (Risk Of Cliff Collapse), was carried out between 1999 and 2001. The ROCC project
focused on Upper Normandy and Picardy regions in France, from Le Tilleul to Ault (120 km long) and
on East-Sussex in UK, from Brighton to Eastbourne (40 km long). Previous studies based on long
period analysis suggest that the mean rate of chalk cliff erosion along the Channel coasts varies
between 0.2 m/year and 0.3 m/year (May, 1971; Costa, 2000; Dornbursch et al., 2001). Recent field
observations in France show that the coastal erosion is spatially and temporally variable and occurs by
sudden cliff collapse that could generate significant cliff retreats of 1-10s of metres (Duperret et al.,
this volume). Cliff instability is governed by a series of parameters of different origins. Pre-existing
fractures as well as lithology represent two of those parameters. In the period 1998-2001, a minimum
of 55 collapses have been observed along the French chalk coastline and about 10 collapses along
the English chalk coastline. For example at Beachy Head in UK, a huge collapse of 150 000 m3 occurred in 1999 controlled by vertical pre-existing fractures were involved (Mortimore et al., this
volume). At Yport in France, a collapse occurred in 2001 in a fractured cliff characterized by the
presence of a series of vertical fractures and of dissolution pipes (Duperret et al., this volume). At Puys
in France, a collapse occurred on May 2000 within a very low fractured zone bounded by large-scale
fractures (Duperret et al., 2002). From these observations, a preliminary hypothesis was suggested
that fractures embedded within the Cretaceous chalk of NW France could influence cliff collapse. The
aim of this paper is, therefore, to investigate the relationships that exist between fracture
characteristics and cliff collapses. In order to investigate the role of fractures in cliff collapse, we: (1)
analysed cliffs forming the French coast at two different scales by combining fracture characterisation
(attitude, density, types) on selected sites at field scale, with a continuous analysis of aerial oblique
photographs of the coastline; (2) made a complete interpretation of the ancient collapses visible on
made a comparison between pre-1986 collapses observed on aerial photographs and recent
collapses observed in the field in terms of spatial distribution along the French coast. A scar is the
fresh rupture surface visible on the vertical coastal cliff after a rock fall event, called here a collapse.
Its state of freshness is indicated by the colour differences in the cliff. On the coastal chalk cliff, a fresh
scar surface is easily detectable because the chalk colour is white. The scar width is the maximum
width of the rupture surface located between the flanks of the cliff collapse. In this paper, a collapse is
a generic term that describes a cliff rock fall (Dikau et al., 1996).
The French chalk cliffs of upper Normandy and Picardy regions represent a 3D rock mass with a
horizontal distance, about 2000 times greater than the vertical height. The average cliff height is about
60 m for a coastal strip of about 120-km long. As pre-existing fractures are on scale of metres to 10s
of metres, it was not possible to investigate them continuously at field scale along 120-km. Then, we
were obliged to combine geological acquisition based on a series of control areas and a continuous
information set represented by the aerial photographs. The choice of the control areas was mainly due
to the most accessible valleys, knowing that the cliff height is in average 50 meters in upper
Normandy. About 34 zones were visited for geological characterisation (lithology, stratigraphy,
structural framework) and collapse data (occurrence, size, run-out, etc...). Furthermore, between St
Valéry en Caux and Pourville, that represents about 25 km length, an exhaustive geological survey
has been done along the coastal cliff foot in order to calibrate field analysis and aerial photograph
interpreation. Consequently, on the French coast, 2,000 of data (1400 on the cliff, 600 on the beach)
were acquired mainly along the coast but also on the beach platform allowing at least a 2D
characterisation of the fracture pattern.
Fracture analysis at field scale
Fracture typology
In order to determine the fracture characteristics, a selection of about 20 more or less relatively equally
spaced sites were investigated along the French coast (Fig. 1). As the lithology was not uniform along
the coast, the analysis was conducted in different lithostratigraphic units. Based on field observations
attitude (strike, dip) as well as their vertical extension were measured. The occurrence of shear
movements such as slickensides, striation or vertical offsets of flint layers was used to determine the
presence of faults. On the beach platform, fracture orientations and more local horizontal fracture
traces were collected. Locally, large-scale fractures were observed both on the beach platform and on
the cliff. On the cliff, the main fracture types collected in the field were pre-existing fractures
(synsedimentary fractures, strata-bound fractures, master-joints, normal faults, joints) and newly
created fractures (stress release fractures). Other kinds of structures related to stratification were also
recorded including flint levels or marl seams. As the French coast is gently folded, stratification
represents a sub-horizontal anisotropy within the cliffs.
(1) Synsedimentary fractures are characterized by 10-mm thick filling made of flint. The presence of
flint within the fracture plane is interpreted as a very early genesis for those structures in the chalk
basin development. They are small-scale fractures and show a zigzag pattern characterising low
anisotropic palaeostress field conditions consistent with the basin creation. They are low dipping
fractures. Locally, some vertical striations are visible indicating that they correspond to synsedimentary
small-scale normal faults. They are slightly isolated at outcrop scale and they do not constitute
well-organized network. (2) Strata-bound fractures correspond to small-scale normal faults well
developed in a given chalk unit (Mortimore, 1990). Those fractures are also interpreted as early
synsedimentary fractures. (3) Master-joints are large nearly vertical fractures that cross the whole cliff
with an apparent extension of 10 to 100s metres. They are tiny fractures whose vertical trace is
underlined by a Fe-oxide coloration. As they show no indicator of movement, they were defined as
master-joints. Vertical dissolution pipes of karstic origin nucleate on vertical master-joints. (4) Normal
faults show typical apparent vertical offsets of cm to metric scale. In some case, vertical slickensides were observed as well as a cataclased damaged zone associated to the major fault plane. They are
steeply dipping fractures. Their fracture filling was not investigated systematically but some clay
minerals, iron oxides as well as carbonates could be partly sealed the normal fault planes. (5) Joints
represent small-scale fractures with no indication of movement. They are isolated structures or
organized in more pervasive vertical network embedded within the chalk unit. Their origin is not well
constrained. (6) Stress release fractures occur in the vicinity of some valleys, e.g. where the cliff
from the valleys. Locally, some newly created vertical fractures parallel to the cliff face were also
observed, but they were not investigated systematically. There is no stress release fractures on the
beach platform.
Fracture orientation
About 2,000 fracture orientation measurements were collected on the field (Table 1). The directional
fracture set analysis shows a major fracture set, as well as a series of secondary sets. The nearly
vertical N110-N130E fracture is the dominant set (Table 2). This set is ubiquitous through the chalk
coastline except between Eletot and Senneville sur Fécamp which shows a strata-bound fracture
pattern. The secondary fracture sets are characterized by a N0-20E set, a N20-30E set which
occurred only at Eletot, and a N40-60E set mainly parallel to the cliff face, which is well represented on
the beach platform (Tilleul, St Pierre en Port, Petites Dalles, Bois de Cise) but difficult to observe and
then to sample on the cliff face (Fig. 2). The secondary N90-N100E and N160-170E sets have been
observed north of Fécamp but are not well represented, whereas the N140-160E set is well
represented between Fécamp and Dieppe and north of Criel sur Mer.
In the vicinity of Eletot and Senneville sur Fécamp, the fracture network has an orientation, which is
not related to the regional NW-SE trend. The measurements were made in specific chalk units at the
bottom of the cliff. Strata-bound fractures consisted of conjugate normal faults, with 10s metre length
such as at Senneville sur Fécamp in the New Pit Chalk Formation and at Eletot in the Lower Lewes
Chalk Formation where the network was more or less isotropic (Fig. 2). At Quiberville, strata-bound
fractures consisted of dual conjugate normal faults with 10s metre length, giving a pyramidal
morphology to the cliff face in the Newhaven Chalk Formation.
From Antifer to Ault, the coastline is mainly oriented NE-SW, whereas the dominating fracture set is
oriented N120E with a certain degree of scattering (Table 2). This regional fracture set is made mainly
of master-joints and normal faults. It suggests that this NW-SE fracture set could be related to a
palaeostress field event oriented NE-SW active from late Cretaceous to early Tertiary times
(Vandycke, 1992; Vandycke et Bergerat, 1992). Hibsch et al. (1995) suggest that the normal faulting in
extensional stress tensor. On the field in Upper-Normandy coastline, the normal faults show a
significant N120 E directional anisotropy probably indicative of anisotropic palaeostress tensors. The
compaction processes proposed by Hibsch et al. (1993, 1995) could have generated the isotropic
small-scale normal faults observed at Eletot and Senneville sur Fécamp (Fig. 2) and qualified of
stratabound fractures by Mortimore (1993). Along the upper Normandy coastline, as the N120E
normal faults are not synsedimentary faults, they are not linked to compaction processes.
A comparison between fracture content on the beach platform and on the cliff face was done in
several sites for minimizing the fracture sampling bias. The fracture sampling along the coast is very
powerful for collecting fractures intersecting the coast but is not sufficient for characterising what part
of the fracture system could be parallel oriented to the coast. On the beach platform, fracture data
were collected on profiles which are not parallel to the coast. However, as the fracture system is
nearly-vertical, it was rather difficult to measure fracture dips on the platforms. Then, fractures were
mainly characterised by their azimuth as only their horizontal traces are visible. Moreover, along the
coast, all the beach platforms are not easily accessible due to beach sediment deposits (sand,
shingle). Then, only 11 sites were investigated on the beach platform for evaluating the fracture
content. About 600 fractures were collected on these different horizontal accessible surfaces (Table
2). On the vertical cliff faces, about 1400 fractures were collected in 34 different sites. In order to
minimize the sampling bias along the coast, some field works were focused on the best outcropping
cliff and beach platform. For example, in Bois de Cise, 100 and 123 fractures were collected on the
cliff and the platform respectively (Fig. 2). On the beach platform, the fracture system is mainly
organized around two fracture sets : (1) a dominating fracture set oriented NW-SE and (2) a
secondary fracture set oriented NE-SW. On the cliff face, the fracture system is more scattered around
the principal fracture set oriented NW-SE. A secondary fracture set is oriented NNE-SSW. Based on
this analysis, we can concluded that the main fracture system is mainly oblique to the coast and is well
revealed on both the cliff and the beach platform. Parallel fractures to the coast occur but they do not
correspond to a principal fracture set (Table 2).
The fracture pattern embedded within the Cretaceous chalk of upper Normandy and Picardy is
presence of two secondary fracture sets oriented NE-SW and NNW-SSE, better sampled on the
beach platform (Table 2) and, (3), locally, the presence of relatively isotropic conjugate small-scale
normal faults developed in particular chalk units and called strata-bound fractures. The fracture
network encountered within the Cretaceous chalk of Normandy has a pattern made of at least
two-secant fracture sets (Fig. 3). The interpretation of aerial photos described below is used to determine
the fracture density continuously along the coast.
Fracture analysis on aerial photography
A series of oblique black and white aerial photographs of the coastline taken in 1986 was available at
an approximate scale of 1:5,000 for an exhaustive interpretation of the cliff and its beach platform.
Before carrying out the photo interpretation, some corrections were applied for the oblique nature of
the dataset and the problem related to the photograph shot. During the data acquisition, the horizontal
distance between the aeroplane and the cliff face was not constant. As a result, some distortions
occurred and the photos were mainly interpreted in their central part, for minimising the sampling bias.
In order to generalize the local structural information collected on the selected sites, about 450 photos
were interpreted (Vila, 2000). An interpretative methodology was thus outlined on the best quality
photographs in which several features (collapses, fractures, dissolution pipes, shingle platform, cliff
limits, etc…) were analysed continuously from Antifer to Ault (Vila, 2000). As the aim was to provide
data for a GIS application, the following relevant layers of information derived from the photo
interpretation were integrated: (1) the fracture content visible on the cliff face, which corresponds to
the fractures orthogonal to the cliff face; (2) the fracture content visible on the beach platform, which
mainly corresponds to the fractures parallel to the cliff and (3) the collapse characteristics (size,
location).
An example of a raw aerial photograph is presented on Figure 4. It shows the Bois de Cise area in the
northern part of the French coastline. The vertical chalk cliff is very fractured and shows several
parallel large-scale fractures dipping north corresponding mainly to normal faults and master-joints
cliff bottom, several collapses are located either in relatively low fractured zones or in highly fractured
zones. They were qualified as ancient collapses or pre-1986 collapses because the aerial
photographs were taken more than 15 years ago. It was not possible to clearly identify what kind of
cliff collapse was involved even though a large diversity of failure collapse types is suspected in chalk
cliff on both sides of the Channel (Duperret et al., this volume, Mortimore et al., this volume). For each
observed ancient collapse, its horizontal extension was measured parallel to the cliff providing a
collapsed width. Those collapses visible on the aerial photo did not all occur in 1986 but correspond to
the cumulative erosional activity of several years of cliff collapse. Actually, it is well known that some
large scale collapses are relatively old and are still visible on the beach platform such as the “Chien
neuf” collapse located close to Senneville sur Fécamp that occurred more than 70 years ago (Rodet,
1992). On the beach platform some fractures parallel or orthogonal to the cliff face are also visible as
well as some marine gullies. Even though the sampling bias related to the oblique photos occurred,
the cliffs appear always more fractured than the beach platforms. This observation was also made
during the field analysis. The pre-existing fractures are more visible on the cliff because the fracture
fillings which are generally dark-coloured, were not eroded. On the beach platform, sea erosion takes
place and the pre-existing fractures become more difficult to detect.
Calibration of aerial photo interpretation
As the aerial photographs are continuous, their calibration was necessary in order to get the best
structural identification of the interpreted photo fractures and to determine the actual scale of the
photographs. The structural knowledge of the field scale through the 20 equally spaced selected
studied sites equally spaced was helpful in providing a better understanding of the aerial photo
interpretation.
A continuous section between Pourville to St Valéry en Caux was investigated at field scale and
compared with the cliff photo interpretation (Fig. 5). In this section of about 25 km long, all the
pre-existing fractures visible in the field were classified, measured and located (Fig. 6). Three main types
of fractures were observed in the field: (1) Normal faults characterized by a N120E orientation.
St Aubin where they formed conjugate networks. In terms of size, they were mainly cross-cliff fractures
but the N-S and E-W fault sets were small-scale normal faults. (2) Master-joints, characterized by a
dominant N110-120E orientation, were large-scale steeply dipping fractures. (3) Synsedimentary
faults, which are quite isolated, showed oblique dip values ranging between 50 and 70° and E-W to
NW-SE orientations. These last small-scale to medium scale fractures were mainly filled by black flint.
As the aerial photos are oblique, it was not possible to obtain from them quantitative information about
fracture orientations. However, an apparent dip value can be determined as well as their vertical
extension. The lack of information about fracture orientation from the photo interpretation is not
penalising because the fracture analyses carried out in the 20 different sites and continuously between
Pourville and St Valéry en Caux, showed a very consistent fracture orientation around the N120E
direction (Table 1). It means that the oblique photos of the coastline highlight the dominating fracture
set with steeply dipping planes. The vertical extension of the fractures visible on the cliff face can also
be obtained from the photographs which is especially useful for detecting the largest fractures.
Between Pourville and St Valéry en Caux, the detailed comparison between the field data and the
aerial photo interpretation indicates three main calibrating guidelines applicable at the scale of the
French coastline. (1) The fracture density, e.g. the total number of fractures visible on a given
horizontal distance, observed in the field or interpreted on the aerial photo shows a value in the same
range of magnitude. In this case, the main fracture types visible in the field are large-scale fractures
made of normal faults or master-joints which are, therefore, correctly detectable on the photographs
due to their large vertical extension. (2) The fracture density deduced from aerial photo interpretation
is higher than those measured on the field. The over-estimation of the aerial photo fractures is due to
the presence of small-scale to medium-scale structures that are not well constrained in terms of origin.
For example, a lot of joints not well defined (induced fractures or stress release fractures) or some
vertical morphological structures could be visible in some altered cliffs around Pourville. In some aerial
photos, a given large-scale fracture is divided into several apparent smaller segments due to the
obliquity of the photo shot leading to a slight over-estimation of the fracture density. In other places, a
not well-defined vertical network of pervasively distributed joints may be revealed on aerial photos.
fractures. Such structures lead to an over-estimation of the fracture content on aerial photos. (3) The
fracture density deduced from aerial photo interpretation is lower than those measured on the field. In
this case, inclined synsedimentary fractures filled with flint as well as some small-scale normal faults
oriented N-S and E-W, were not systematically detectable on the aerial photos. There are about 15%
of the field fractures which are not visible on the photos. They correspond generally to tiny
synsedimentary fractures with various orientation and normal faults, parallel to the cliff, and
consequently difficult to characterize even with high resolution photos. Finally, as most of the fractures
show a vertical extension higher or equal to the cliff height, the field fractures were easily detectable
on the photo.
Two fracture sizes are visible on the cliffs that mainly correspond to two main groups of fracture types:
the small-scale fractures (joints, synsedimentary fractures, stress release fractures, induced fractures)
and the large-scale fractures (normal faults, master-joints). Generally, the small-scale fractures are
more poorly sampled than the large-scale fractures, on aerial photos. Therefore, based on the aerial
photograph analysis, two different fracture densities were calculated: the whole fracture density that
mixes all the fractures types, called Total Fracture Type (TFT) and the large-scale fracture density that
takes into account the large-scale fractures only, called Major Fracture Type (MFT).
The second goal of the calibration procedure was to determine the actual scale of the oblique aerial
photographs knowing that there were some distortions on the raw aerial photos. In the field, between
Pourville and St Valéry en Caux, measurements were made to provide some typical beachmarks. The
horizontal distance between similar features identified both in the field and on the aerial photographs
was measured allowing checking the actual photo-scale, which is 1:4,900. This field scale calibrated
value was very close to the initial scale value and allowed us to derive real fracture densities from
aerial photographs.
Fracture data analysis on aerial photographs
For building the geohazard map of the coastline, it was necessary to divide the coast into adjacent
cliff, the coast has been delineated into a series of sectors having a homogeneous fracture content
with a low, average, or high fracture density (Fig. 7). Between Ault and Antifer, 63 sections with
different length have been determined. In each section, the total number of fractures, the section
length as well as the whole linear fracture density were calculated, knowing that the horizontal scale
was calibrated in the field. The sector with the highest density of fractures was Puys with 0.172
fract./m. The sector with the lowest density of fractures was close to Penly with 0.011 fract./m. Several
sectors showed a fracture density close to zero because they corresponded to areas with very low cliff
height (perched valleys) or valleys (town, harbour). The average fracture density along the coast was
0.074 fract./m. As we were looking for some relationships between fracture content and cliff collapse,
the fracture data were expressed as fracture spacings. The lower the fracture density, the higher the
spacing values. For example, a fracture density of 0.02 fract./m, means that the minimum horizontal
distance between 2 consecutive fractures, i.e. the fracture spacing calculated as the inverse of the
fracture density, is 50 m.
Between Antifer and Ault, the map of the Total Fracture Types (TFT) shows some sectors with low
fracture spacing, ranging from 5 to 10 m, which alternate with sectors with high fracture spacing,
ranging from 50 to 100 m. 90% of the fracture spacing range between 5 and 25 m, the average value
being 13 m. At regional scale, the most fractured sectors match with large scale faults such as the
Fécamp-Lillebonne fault (at Fécamp), the Bray Fault (at Dieppe) and the Eu Fault (at Mers les Bains)
(Fig. 8). The length of the highly fractured coastal sections extends of a few kilometres on each side of
the regional faults, such as observed between Yport and St Martin aux Buneaux. The coastal sections
located south of Yport, as well as between St Martin aux Buneaux and Cap d’Ailly, and Penly and Criel
sur Mer, are characterized by a low fracture content. These sections are both far away but relatively
equally spaced from the major regional faults.
The map of the Major Fracture Types (MFT) which corresponds to the master-joints and the normal
faults is herein compared to the TFT strip (Fig. 8). The fracture spacing varies between 7 and 182 m,
the average value being 30 m. Due to the lower fracture content, the MFT strip systematically shows
higher spacing values than the TFT strip, except in the north between Criel sur Mer and Ault. In this
similar for both MFT and TFT and corresponds mainly to large-scale normal faults oriented N120E
checked in the field. The MFT strip shows moderate fracture content around the Bray fault. Near the
Fécamp-Lillebonne fault, the MFT strip reveals very low fracture content as well as between St Martin
aux Buneaux and Veules-les-Roses.
From the MFT strip, here appear to be two main domains of fracture content. Northward from the Bray
fault, the high fracture density due to normal faults is indicative of a high tectonic paleo-activity,
whereas southward from the Bray fault, the fracture density is lower, suggesting that normal faulting is
not so well developed. At larger scale, the tectonic activity of the Bray and Eu faults is better
expressed topographically by rectilinear and sharp lineaments than the Fécamp-Lillebonne fault, which
shows a curved and smooth topographic signature (Fig. 8).
Pre 1986 collapse data analysis on aerial photos
Methodology
Within the 63 sections derived from the fracture analysis, the size of the collapse process was
evaluated from the aerial photo interpretation. Several parameters related to the pre-1986 collapses
visible in 1986 were collected or calculated:
(1) the total number of pre-1986collapses per section (PC) ;
(2) the cumulative scar length (CSL) along the cliff face in each section of a given length;
(3) the percentage of Pre-1986collapsed cliff surface(PCS), which is the ratio between the cumulative
scar length (CSL) divided by the length (L) of the given section;
(4) the percentage of normalized Pre-1986collapsed cliff surface, which is the ratio between PCS and
the total number of pre-1986collapse in a given section (NPCS). This ratio is given by:
NPCS=(CSL/L)/(PC)=PCS/PC
For example, in a given cliff section length, high PCS values could be interpreted as a series of
small-scars or an isolated huge scar representing an equivalent scar length. Low PCS values could
represent the same scar population (a lot of small scars or a huge scar) but it occurs in a larger cliff
calculated a normalized parameter NPCS which is not dependent of the number of collapse. For
example, high NPCS values mean a cliff section with a significant tendency for collapsing whatever
the number of collapse. This parameter represents a kind of collapse intensity normalized on the scar
length.
Number of Pre-1986collapses per section (PC)
300 ancient collapses have been recorded from the aerial survey conducted in 1986 (Fig. 9). The
average value per section is close to 7 pre-1986 collapses, with a maximum of 27 and two minima of
zero. The areas with no collapse correspond to the valleys, with no significant cliff. The map of PC
shows three sections with the highest concentrations of collapses, which are located southward of
Criel sur Mer, westward of St Valéry-en-Caux and southward of Vaucottes, with the maximum PC
southward of Criel sur Mer, between Val Pollet and Penly. The two minima are located north of
St Pierre-en-Port valley and north of Dieppe up to Puys in a 50-m height cliff. The sections with high to
moderate collapse concentrations do not show a preferential distribution. The PC is not related to the
well-known regional faults. There is no significant concentration of ancient collapses in the vicinity of
the Eu, Bray and Fécamp-Lillebonne faults (Fig. 9). On the contrary, the highest PC values are located
far away from the regional faults. The number of collapses is therefore not directly related to the
paleo-tectonic activity.
Percentage of Pre-1986collapsed cliff surface per section (PCS)
By ignoring the valleys, the average value of the PCS rate is 21 %. The map of PCS shows three main
areas, from SW to NE (Fig. 9): (1) the highest PCS values are located between Le Tilleul and
Veules-les-Roses, with the maximum value (66%) located south to Fécamp; (2) the lowest PCS rates are
located between Veules-les-Roses and Dieppe; and (3) North of Dieppe, PCS rates are intermediate.
The PCS is not systematically related to the location of regional faults. For the Bray and the Eu faults,
there is no spatial correlation, whereas for the Fécamp-Lillebonne fault, the PCS value is rather high.
The low PCS values are located far away from the regional faults.
The average value of NPCS rates is about 5%. By normalising the PCS, extreme values are reinforced
and minima and maxima alternate spatially (Fig. 9). Three maxima located at Fécamp, Dieppe and
Mers-les-Bains are clearly identified. The minima are located south of Yport, between St Martin aux
Buneaux and Dieppe, and from Puys to Criel sur Mer.
The high NPCS values mimic the regional fault locations, whereas the low NPCS values are located
far from the regional faults. The NPCS rate is the most relevant parameter for characterising the
ancient collapse intensity, because it takes into account the collapse size effect (small to large
size-scar), the section dimension (horizontal length) and the number of events (i.e. number of ancient
collapses).
Several points arise from this part of the study. TFT spacing distribution and NPCS values are both
spatially correlated with the location of the regional faults. Fractures visible in the cliff and ancient
collapses are also correlated for the maximum values. This correlation is not well constrained for the
minimum and intermediate values. For example, between Dieppe and Veules-les-Roses, the NPCS
values are very low whereas the TFT values are moderate. By considering only the large-scale
fractures (MFT), the spatial correlation between pre-1986collapses and fractures is less clear than for
the whole fracture population (MFT). At a regional scale, the pre-1986 collapse distribution derived
from aerial photos and the whole fracture distribution is spatially correlated to the regional faults of
Fécamp-Lillebonne, Bray and Eu.
Recent collapses analysed from field observation
Between 1998 and 2001, a minimum of 55 cliff collapses of various size has been recorded along the
coastline of Upper-Normandy and Picardy (Fig. 10). About 75% of them correspond to large-scale
collapses, which affect the whole cliff height. 70% of the recent collapses occurred in 2001 and are
mainly interpreted as a consequence of high rainfall (Duperret et al., this volume). Recent collapses
are not equally spaced along the coastline, some areas with high concentrations alternating with areas
of low concentrations creating a clustered distribution pattern. Between Veules-les-Roses and cap
d’Ailly, many collapses have been observed (mainly small-scale failures). However, the sampling of
for this reason there are a lot of small-scale collapses between Veules-les-Roses and cap d’Ailly, this
section being fully surveyed in the field. This is also the reason why only larger collapses are recorded
everywhere else, whereas the small ones are missing.
In order to evaluate the role of the pre-existing fractures on recent collapse location, the fracture
content controlling or not the scar collapse, as well as those embedded within the scar, has been
analysed. Based on the recent collapse database, field observations show that 40% of the collapses
are not bounded laterally by pre-existing fractures, 55% are bounded by at least one fracture and 5%
are bounded by two fractures. 58% of the recent collapses show no significant pre-existing fractures
within the scar. Stress release fractures could exist but they were not observed. An example of a
recent collapse limited by a pre-existing fracture is presented in Fig. 11. As the fractures observed
within the collapse are generally transverse fractures relatively orthogonal to the cliff face, we assume
that they do not create the collapse trigger. They could represent either mechanical barrier by halting
the lateral progression of failure scar or behave as a passive mechanical structure when they are
developed inside a given scar.
The number of collapses observed on the cliff face in 1986 is 6 times higher than those observed
during three years (1999-2001). However, between St Aubin sur Mer and Quiberville, recent collapses
are more numerous but they mainly correspond to small-scale collapses (Fig. 12). As this section was
better sampled during the field survey, this result is not significant in terms of degree of erosion. In the
other sections, small-scale collapse inventories were underestimated as well as the related degree of
erosion. Actually, the collapses reported in 1986 correspond to the footprints of successive collapse
events visible as scars on our photograph that may have occurred a few years before the observation,
whereas collapses reported between 1998 and 2001 are better constrained in terms of time of
occurrence. There is consequently a significant uncertainty for the real timing of occurrence for
collapses identified on the aerial photos taken in 1986. Those photos probably contain some collapse
marks, which occurred several years before 1986, increasing the pre-1986 collapse number. The
coastal sections having a higher number of collapses in 1986 do not match with those defined
between 1998 and 2001. For example, between Fécamp and Eletot, no collapse is observed between
The comparison between the two survey periods suggests a different spatial evolution of collapse
events along the coast. The areas active in 1986, are not exactly the same as those observed in
1998-2001. The results suggest that the erosion by collapse is not continuous in space and time, but occurs
suddenly at different locations and at different time periods. The absence of long-term observations
reduces the accuracy of conclusions that can be drawn from this study.
Discussion
The erosion of the coastal chalk cliffs of Upper-Normandy and Picardy is mainly controlled by
collapses of various sizes. From Le Tilleul to Ault, the coastline is made of three large-scale linear
segments oriented N60E (from Le Tilleul to Veulettes sur Mer), N80E (from Veulettes sur Mer to
Dieppe) and N50E (from Dieppe to Ault) (Fig. 13). The N60E and N50E coastal segments present the
same chalk succession, whereas the N80E segment is completely different from a lithological point of
view (Duperret et al., this volume). As the dominating fracture set observed both from regional scale,
aerial photos and field observations is oriented normally to the coastline, the coast is not directly
controlled by this regional fracture orientation. A secondary fracture set roughly parallel to the
coastline has been observed, but only locally, and does not seem to influence the coastline
orientation. Therefore, as field observation shows, the chalk cliffs are not affected by a systematic
fracture set parallel to the coastline and the observed collapses are not directly linked to this fracture
orientation. However, we infer that stress release fractures newly created and parallel to the cliff face
could be a control on some collapse mechanisms. The fractures orthogonal to the coastline are
dominant, but their orientation does not tend to favour a cliff collapse, from a geometrical point of view.
A part of these fractures may limit the lateral extension of the collapse on the cliff face, by forming
mechanical barriers.
The erosion of the coastal chalk cliffs could be also derived from the whole fracture density. The
fracture density is heterogeneously distributed along the coastline, the maxima being linked to the
regional faults. As the fracture density correlates better to areas with more pre-1986 collapses than
collapse process. The impact of the fracture density on the cliff collapses can be deciphered by
analysing the coastal orientation in relation with the fracture content. Coastal segments with the higher
fracture density are mainly oriented N60E (around the Fécamp-Lillebonne fault) and N50E (northward
of the Bray fault). In that case, the coastline is roughly perpendicular to the main fracture orientation.
Coastal segments with a low fracture density are mainly oriented N80E (between Veulettes sur Mer
and Dieppe). In that case, there is no dominating fracture set and the orientation of the coastline could
be controlled mainly by the chalk lithology (Fig. 13).
In spite of the uncertainties related to the collapse data acquisition, both from aerial photos and field
measurements, the collapse datasets (1986, 1998-2001) show different responses along the
coastline. The pre-1986 collapses are correlated with the regional fault location and the fracture
content, whereas the recent collapses do not show the same spatial relationship with fracture content.
We thus suppose that this discrepancy is due to the superimposition of some other parameters
(rainfall, marine erosion, …) or to the recent collapse sampling period, which is probably too short in
relation to the long-term erosion process. The coastal erosion by collapse is difficult to measure on
short-term periods (for example, three years) because cliff collapses are spatially and temporally
variable and discontinuous.
The role of fractures on collapse occurrence is determined by means of observations conducted over
two time periods and a multiscale fracture analysis. Some fracture characteristics (filling, aperture,
rugosity, channelling) have not been investigated which could influence collapse characteristics
(location, size, triggering effect). For instance, according to the nature of the fracture filling
(impermeable clays, karstic network), a fracture could be well drained or undrained and consequently
could influence collapse mechanism.
Conclusion
Multi-scale fracture analysis, based on field survey and aerial photograph interpretation, was used to
investigate erosion by cliff collapse of the Upper Cretaceous Chalk coastline of NW France. The field
detailed fracture and collapse data not obtainable from aerial photographs. The coastline is divided
into 63 sections derived from fracture analyses within which cliff collapse processes have been
evaluated. A new method of delineating the extent of cliff erosion within sections of cliff is based on
total number of collapses (PC), cumulative cliff failure scar width, percentage of pre-1986 collapsed
cliff surface (PCS) and on percentage of normalized pre-1986 collapsed cliff surface (NPCS). The
NPCS in particular helps identify where maxima and minima in cliff collapse erosion are located. In
addition, the results of applying the NPCS to the 120-km of coastline illustrate the importance of major
structural features (the major faults at Fécamp, Bray and Eu) in the location of maxima and minima. At
a local scale, in contrast to the aerial photograph analyses, the field study of recent collapses suggests
no systematic correlation of cliff collapse and fracture occurrence.
Fracture evaluation shows that the dominating fracture set is N120E and this corresponds mainly to
normal faults roughly perpendicular to the coastline orientation. Several secondary fracture sets have
been identified one of which is locally parallel to the coastline. Field observations have shown three
relationships between fractures and the scars left by cliff collapses (i) fractures limit the scar laterally
(ii) fractures are located only within the scar (iii) no pre-existing fractures are involved in the scar.
The study also illustrates the differences in location, frequency and structural interpretation of cliff
collapses between two periods of observation (pre-1986 and 1998-2001) and the need, therefore, for
a long and detailed historical record of cliff collapses before final conclusions can be drawn about the
mechanisms, frequency, location and size of cliff collapses.
Acknowledgements
The ROCC project was funded by the European community through the INTERREG II Rives-Manche
community initiative (contract I99059). This research work has also been partly funded by the Centre
National de la Recherche Scientifique in the framework of Programme National des Risques Naturels,
through the contract PNRN 99-35-AS, by the Regional Council of Somme, the French Geological
Survey (BRGM) and the University of Brighton. We thank the Maritime Direction Départementale de
l’Equipement at Dieppe for providing us with oblique aerial photographs of the French coastline. The
References
Bristow, R., Mortimore, R.N., & Wood, C.J. 1997. Lithostratigraphy for mapping the chalk of southern
England. Proceedings of the Geologist’s Association, 109, 293-315.
Costa, S. 2000. Le recul des falaises du pays de Caux. Bulletin d’Information des Géologues du
Bassin de Paris, 37, n°1, 31-34.
Dikau, R., Brunsden, D., Schrott, L., Ibsen, M-L. 1996. Landslide recognition, identification, movement
and causes, International Association of Geomorphologists, Wiley Ed., 243 p.
Dornbusch, U., Williams, R.B.G., Robinson, D.A., & Moses, C. 2001. Disappearing act : Contribution
of cliff erosion and in situ abrasion of flint to the shingle budget on the East Sussex coast,
European Rock Coasts 2001 conference, Brighton, UK, 17-18 December 2001.
Duperret, A., Genter, A., Mortimore, R.N., Delacourt, B., & De Pomerai, M. 2002. Coastal rock cliff
erosion by collapse at Puys, France : the role of impervious marl seams within chalk of NW
Europe. Journal of Coastal Research, 18, n°1, 52-61.
Duperret, A., Genter, A., Martinez, A., & Mortimore, R.N. this volume. Coastal chalk cliff instability in
NW France : the role of lithology, fracture pattern and rainfall, in : Mortimore R.N. and Duperret
A. (eds), Coastal Chalk Cliff Stability, Geological Society, London, Special Publications.
Hibsch, C., Cushing, M., Cabrera, J., Mercier, J., Prasil, P., & Jarrige, J-J. 1993. Palaeo-stress
evolution in Great Britain from Permian to Cenozoic : a microtectonic approach to the geodynamic
evolution of the southern UK. Basins. Bull. Cent. Rech. Explor. Prod. Elf Aquitaine, 17 (2), 303-330.
Hibsch, C., Jarrige, J-J, Cushing, E.M., & Mercier, J. 1995. Palaeostress analysis, a contribution to the
understanding and geodynamic evolution : Example of the Permian/Cenozoic tectonics in Great
Britain and geodynamic implications in western Europe., Tectonophysics, 252, 103-136.
May, V.J. 1971. The retreat of chalk cliffs, Geographical Journal, 137, 203-206.
Mortimore, R.N. 1983. The stratigraphy and sedimentation of the Turonian-Campanian in the Southern
Province of England. Zittelania, 10, 27-41.
Mortimore, R.N. 1986. Stratigraphy of the Upper Cretaceous White chalk of Sussex. Proceedings of
Mortimore, R.N., & Pomerol, B. 1987. Correlation of the Upper Cretaceous White chalk (Turonian to
Campanian) in the Anglo-Paris Basin. Proceeding of the Geologist’s Association, vol. 98, part 2.
Mortimore, R.N., Pomerol, B., & Foord, R.J. 1990. Engineering stratigraphy and palaeogeography for
the chalk of the Anglo-Paris Basin. In : Chalk, Thomas Telford (ed), London.
Mortimore, R.N., Lawrence, J., Pope, D., Duperret, A., & Genter, A. this volume. Coastal cliff
geohazards in weak rock : the UK Chalk cliffs of Sussex, in : Mortimore R.N. and Duperret A.
(eds), Coastal Chalk Cliff Stability, Geological Society, London, Special Publications.
Pomerol, B., Bailey, H.W., Monciardini, C., & Mortimore, R.N. 1987. Lithostratigraphy and
biostratigraphy of the Lewes and Seaford chalks : A link across the Anglo-Paris Basin at the
Turonian-Senonian boundary. Cretaceous Research, 8, 289-304.
Vandycke, S. 1992. Tectonique cassante et paléo-contraintes dans les formations crétacées du
Nord-Ouest européen. Implications géodynamiques. Thèse de l’Université de Paris VI, 180 p.
Vandycke, S., & Bergerat, F. 1992. Tectonique de failles et paléo-contraintes dans les formations
crétacées du Boulonnais (France). Implications géodynamiques. Bull. Soc. Géol. France, 163, n°5,
553-560.
Vila, J.L. 2000. Étude du littoral cauchois : méthode descriptive des falaises côtières à partir des
photos aériennes obliques dans l’optique de l’évaluation de leur sensibilité à l’érosion. Rapport de
DESS « Télédétection, méthodes, application, environnement ». Université Pierre et Marie Curie,
Paris.
Figure Captions
Fig. 1 : Location of the fracture sites investigated at field scale, on the French coastline of
Upper-Normandy and Picardy
Fig. 2 : Rose diagrams of fracture azimuth collected on the cliff face (A) and on the beach platform (B)
at Bois de Cise. Rose diagrams of stratabound fracture azimuth collected on the cliff face at Eletot (C)
Fig. 3 : Conceptual model of the fracture system embedded within the chalk of Upper-Normandy and
Picardy (map view) based on field survey
Fig. 4 : Example of an oblique aerial view (shot taken in 1986) of the French coastline (on the left, Bois
de Cise area), with its main features
Fig. 5 : Location of the detailed coastal sections analysed on the field between St Valéry-en-Caux
(SW) and Pourville (NE) and fracture location
Fig. 6 : Stereographical projections (Schmidt plot in lower hemisphere) of the fractures collected on the
field between St Valéry-en-Caux and Pourville. A: master-joints, B: normal faults, C: synsedimentary
fractures
Fig.7 : Example of fracture density sectoring along the cliff face. Each sector having a given fracture
organisation is characterized by its linear fracture density or its fracture spacing. This section is
oriented NE-SW, i.e. Bois de Cise to Mers les Bains
Fig. 8 : Fracture density based on aerial photos, between Le Tilleul and Ault on the chalk coastline of
NW France. TFT (Total Fracture Types) strip : mean fracture spacing in each coastal sectors for all the
fracture types. MFT (Main Fracture Types) strip : mean fracture spacing in each coastal sectors for
large-scale fractures only
Fig. 9 : Map of pre-1986 collapse data recorded in 1986 from aerial photographs, between Le Tilleul
and Ault on the chalk coastline of NW France. NPC, Number of Pre-1986 Collapse, in each coastal
sector. PCS, Percentage of Pre-1986 Collapsed Cliff Surface, per section. NPCS, Percentage of
Normalized Pre-1986 Collapsed Cliff Surface, per section
Fig. 10 : Location of recent collapses recorded on the field between October 1998 and December
2001. The size of the circles is proportional to the size of the collapse. The grey scale within the circles
Fig. 11 : Example of recent collapse at St Pierre en Port, that occurred on March the 15th 2001, showing a scar bounded laterally by a pre-existing vertical fracture. The total cliff height is about 90 m
Fig. 12 : Comparison between the Number of Pre-1986 Collapses (NPC) observed in 1986 on aerial
photos and the number of collapses observed on the field between 1998 and 2001
Fig. 13 : Schematic sketch of the coastline orientation versus regional faults in upper Normandy and
Picardy
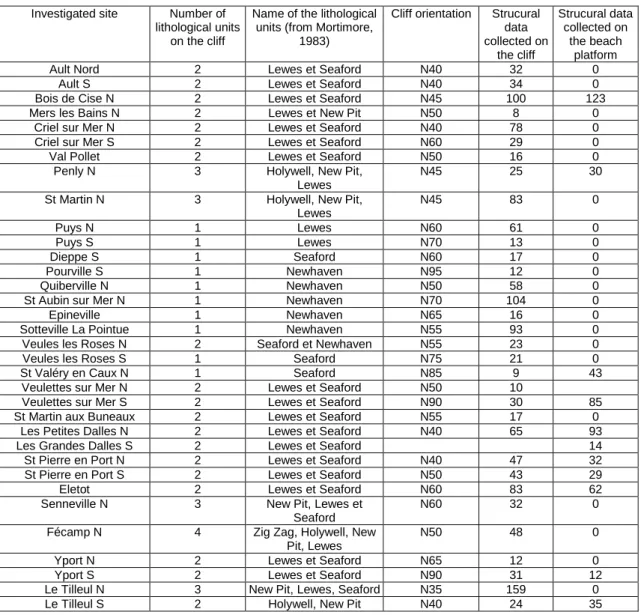
Table 1 : Characteristics of the sites investigated for fracture evaluation
Number of data : 100
report from the cliff face
Number of data : 123
report from the beach platform
Eletot (North)
Number of data : 54
report from the cliff face
(only normal faults)
Senneville (South)
Number of data : 32
report from the cliff face
0 4000 8000 12000 16000 20000 24000 Veules St Valéry Sotteville Epineville St Aubin Quiberville-plage Phare d'Ailly
Pourville Le petit Ailly
Investigated zone during the field work
0 4000 8000 12000 16000 20000 24000 distance (m)
B
C
the cliff platform
Ault Nord 2 Lewes et Seaford N40 32 0
Ault S 2 Lewes et Seaford N40 34 0
Bois de Cise N 2 Lewes et Seaford N45 100 123
Mers les Bains N 2 Lewes et New Pit N50 8 0
Criel sur Mer N 2 Lewes et Seaford N40 78 0
Criel sur Mer S 2 Lewes et Seaford N60 29 0
Val Pollet 2 Lewes et Seaford N50 16 0
Penly N 3 Holywell, New Pit,
Lewes
N45 25 30
St Martin N 3 Holywell, New Pit,
Lewes N45 83 0 Puys N 1 Lewes N60 61 0 Puys S 1 Lewes N70 13 0 Dieppe S 1 Seaford N60 17 0 Pourville S 1 Newhaven N95 12 0 Quiberville N 1 Newhaven N50 58 0
St Aubin sur Mer N 1 Newhaven N70 104 0
Epineville 1 Newhaven N65 16 0
Sotteville La Pointue 1 Newhaven N55 93 0
Veules les Roses N 2 Seaford et Newhaven N55 23 0
Veules les Roses S 1 Seaford N75 21 0
St Valéry en Caux N 1 Seaford N85 9 43
Veulettes sur Mer N 2 Lewes et Seaford N50 10
Veulettes sur Mer S 2 Lewes et Seaford N90 30 85
St Martin aux Buneaux 2 Lewes et Seaford N55 17 0
Les Petites Dalles N 2 Lewes et Seaford N40 65 93
Les Grandes Dalles S 2 Lewes et Seaford 14
St Pierre en Port N 2 Lewes et Seaford N40 47 32
St Pierre en Port S 2 Lewes et Seaford N50 43 29
Eletot 2 Lewes et Seaford N60 83 62
Senneville N 3 New Pit, Lewes et
Seaford
N60 32 0
Fécamp N 4 Zig Zag, Holywell, New
Pit, Lewes
N50 48 0
Yport N 2 Lewes et Seaford N65 12 0
Yport S 2 Lewes et Seaford N90 31 12
Le Tilleul N 3 New Pit, Lewes, Seaford N35 159 0
Le Tilleul S 2 Holywell, New Pit N40 24 35
Ault Nord N120 N25 N105 N160 Fractures
Ault S N140 N110
Bois de Cise N N130 N110 N020 N155 Fractures N120 N055
Mers les Bains N N110 N90 Normal faults
Criel sur Mer N N000 Fractures
Criel sur Mer S N140 N120 N155 N105 Master joints
Val Pollet N135 Master joints
Penly N N090 N015 N070 Normal faults N080 N040 N060
St Martin N N120 N010 N070 Master joints Joints
Puys N N110 N050 Master joints Normal faults
Puys S N110 Master joints Normal faults
Dieppe S N115 Joints Master joints
Pourville S N130 Master joints
Quiberville N N110 N095 N145 Master joints Normal faults
St Aubin sur Mer N N125 N140 N160 Normal faults
Epineville N125 Normal faults
Sotteville La Pointue N120 Normal faults Master joints
Veules les Roses N N130 Normal faults
Veules les Roses S N140 Normal faults
St Valéry en Caux N N115 N90/ N165 Master joints Normal faults N130
Veulettes sur Mer N N135 Joints
Veulettes sur Mer S N110 Joints Master joints N120
St Martin aux Buneaux N130 Master joints Joints
Les Petites Dalles N N120 Master joints Joints N120 N35 N160 N100
Les Grandes Dalles S N60
St Pierre en Port N N110 N10 Master joints Joints N110 N10 N25 N165
St Pierre en Port S N105 N170 Master joints Joints N60
Eletot N145 N30 Normal faults N160 N100
Senneville N N140 N150 N165 Normal faults
Fécamp N N120 N000 Master joints
Yport N N110 Master joints
Yport S N115 Joints Master joints N150 N100
Le Tilleul N N115 N15 N165 Fractures