Development of a Precision Hot Embossing
Machine with In-Process Sensing
by
Maia R. Bageant
B.S., Massachusetts Institute of Technology (2011)
Submitted to the Department of Mechanical Engineering
in partial fulfillment of the requirements for the degree of
Master of Science in Mechanical Engineering
at the
MASSACHUSETTS INSTITUTE OF TECHNOLOGY
June 2013
c
Massachusetts Institute of Technology 2013. All rights reserved.
Author . . . .
Department of Mechanical Engineering
June 3, 2013
Certified by . . . .
David Hardt
Ralph E. and Eloise F. Cross Professor of Mechanical Engineering
Thesis Supervisor
Accepted by . . . .
David Hardt
Ralph E. and Eloise F. Cross Professor of Mechanical Engineering
Graduate Officer
Development of a Precision Hot Embossing Machine with
In-Process Sensing
by
Maia R. Bageant
Submitted to the Department of Mechanical Engineering on June 3, 2013, in partial fulfillment of the
requirements for the degree of
Master of Science in Mechanical Engineering
Abstract
Microfluidic technologies show great promise in simplifying and speeding biological, medical, and fluidic tasks, but transitioning these technologies from a laboratory environment to a production environment has proven difficult. This work focuses on hot embossing as a process suitable to produce these devices. In this work, a precision micro-embossing machine capable of maintaining precise setpoints in force and temperature input as well as displaying highly linear, repeatable motion and force application is developed and characterized. Additionally, this equipment is then outfitted with additional sensors that allow for three measurements relevant to process physics and product quality to be captured: initial substrate geometry; substrate bulk deformation; and glass transition temperature of the material. These measurements can be captured in-process without modifying the production cycle. The end goal is to incorporate this precision micro-embossing machine into a micro-factory cell and to implement closed-loop cycle-to-cycle process control.
Thesis Supervisor: David Hardt
Acknowledgments
The work completed in this thesis could never have happened without the support of many.
I would like to thank my research colleagues; Melinda Hale, Joseph Petrzelka, and Caitlin Reyda were tremendous sources of support and feedback in the early development of the project, and the other newer members of the Hardt Lab provided a helping hand upon their later arrival. In addition, undergraduate researcher Spencer Wilson provided much appreciated support during fabrication of the machine.
I would also like to acknowledge my family, who always supported my work, no matter how obscure my end purpose seemed, and who imparted in me from a young age the curiosity and drive to pursue these studies. My friends at home and across the country also helped keep my head up and my nose to the grindstone, and I must thank them too.
And of course I must acknowledge the terrific help and guidance from my advisor, Professor Hardt. From the very beginning of this project he has guided its course with an expansive understanding of its context and meaning. But he has also never feared to dive into the finer details of the work and metaphorically dirty his hands beside his students. Without his patience, dedication, and wisdom this project would never have succeeded.
Finally, this research is part of a 10-year program sponsored by the Singapore-MIT Alliance Manufacturing Systems and Technology Programme, and without their financial and academic generosity this work would not have been possible.
Contents
1 Introduction 21
1.1 Microfluidic Devices . . . 21
1.2 Fabrication of Microfluidic Devices . . . 23
1.3 Hot Embossing . . . 25
1.4 Equipment Needs and State of the Art . . . 26
1.5 Project Motivation . . . 28
2 Process Physics of Hot Embossing 31 2.1 The Hot Embossing Process . . . 31
2.2 The Demolding Process . . . 35
2.3 Input Parameters and Sources of Variation . . . 38
3 Project History and Objectives 39 3.1 Historical Designs . . . 39
3.2 Microfactory Project Objectives . . . 42
4 Design of Precision Equipment 49 4.1 Motivation and Design Specifications . . . 49
4.2 Design . . . 50
4.2.1 Precision Linear Motion . . . 50
4.2.2 Precise and Repeatable Force Actuation . . . 54
4.2.3 Precision Substrate Registration . . . 58
4.3 Completed Hardware Design . . . 63
4.4 Control System Design . . . 67
4.5 Pneumatic and Coolant System Design . . . 70
4.6 Tooling . . . 72
4.7 Performance of Precision Equipment . . . 74
5 In-Process Sensing 79 5.1 Possible In-Process Measurements and Relationship to Quality . . . . 79
5.2 Hardware Implementation . . . 82
5.3 LVDT Measurement Capability . . . 84
5.4 Force Measurement Capability . . . 84
5.5 Relevant Measurements and Data . . . 86
5.5.1 Initial Blank Geometry . . . 86
5.5.2 Bulk Deformation . . . 88
5.5.3 Glass Transition Temperature . . . 89
6 Conclusion 93 6.1 Thesis Contributions . . . 93
6.2 Utility of Work . . . 94
6.3 Future Work . . . 96
A System Circuit Diagrams 99
B System Diagram 103
List of Figures
1-1 Example of a Microfluidic Device: This diagnostic device performs sandwich immunoassays. The tiny screws act as manual valves, and the assays are done in the complex networks of channels. [1] . . . 22 1-2 Nanoscale features in PDMS: This figure shows images of molds
cre-ated by casting PDMS onto self-assembled polystyrene structures, and then again casting PDMS into the resulting negative. Note the feature replication down to the scale of 100nm. [17] . . . 22 1-3 Schematic of the Hot Embossing Process: In step 1, a blank substrate
is pressed against a rigid patterned tool; in step 2, the substrate flows and conforms to the tool; and in step 3, the substrate is removed from the tool, retaining permanent features in the negative of the tool [20]. 27 2-1 Ideal Forming Cycle for Hot Embossing: This diagram indicates typical
levels of force and temperature (the selected input parameters) during a forming cycle for PMMA substrates [18]. . . 32 2-2 Experimental Compression Data for PMMA at Various Temperatures:
In this experimental data, the dramatic change in flow stress as the temperature is increased from ambient to above glass transition (110◦C) is clear. The 110◦C curve displays remarkably plastic behavior, show-ing very little increase in stress with large strains. This particular test was performed at a fixed strain rate, but the behavior is also rate dependent [12]. . . 33
2-3 Mechanical Elements Model of PMMA: A mechanical elements model representing the 3 micromechanisms that control the material proper-ties of amorophous polymers such as PMMA. Each micromechanism is numbered for referencing in the text [12]. . . 33 2-4 Stress-Strain Contributions of Individual PMMA Micromechanisms:
The contributions of micromechanisms 1 through 3 for temperatures above the glass transition temperature show that both mechanisms 1 and 3 have nonlinear combined elastic and plastic behavior. The con-tribution of micromechanism 2 is reduced to being essentially negligible in this regime [12]. . . 35 2-5 Experimental Embossing Formation Results for PMMA at Varying
Force Levels: Experimental profiles for a channel measuring 500µm by 50µm (axes not to scale) are shown. As the force level is increased, the shoulder fills up into the corners of the tool features, better repli-cating the sharp stepped profile of the tool; at all force levels, the bottom of the channel is well-formed. [10]. . . 36 2-6 Demolding Energy as a Function of Part Temperature: Mechanical
in-terfacial energy dominates at low temperatures, and decreases approx-imately linearly as temperature increases; adhesion interfacial energy dominates at high temperatures, and increases nonlinearly as temper-ature increases. The optimal demolding tempertemper-ature is taken to be at the minimum of these energies. [18]. . . 37 3-1 Temperature Profile for Generation 1 Machine: Though the
tempera-ture uniformity is good, some five minutes are required to get close to forming temperature [20]. . . 40 3-2 Temperature Profile for Generation 2 Machine: The Generation 2
ma-chine showed an excellent ability to match temperature setpoints, but takes approximately 2 minutes to heat and cool, requiring the cycle time to be on the order of 5 minutes [18]. . . 41
3-3 Asymmetric Temperature Profiles in Generation 3 Hardware: In this plot, the top (white) and bottom (red) temperature profiles for the generation 3 equipment can be observed; the numbers overlaid on the graph indicate the power output of each heater at that point in time. The initial heating rate of the top and bottom heaters are approxi-mately the same, but when contact between the part and tool is ini-tiated (noted by the peak approximately in the center of the plot), the bottom temperature diverges from the top. Due to the fact that the flow of coolant is never shut off, the bottom heater, exposed to the cooling block, struggles to maintain the setpoint temperature of 140◦C, even at 100% power. . . 43 3-4 Test Micromixer Device: Fluid is input into the two rightmost ports,
and exits in the leftmost port. The channels are 50µm wide. Ad-ditional test and metrology features are distributed throughout the design, including a grid of squares 20µm in size. . . 44
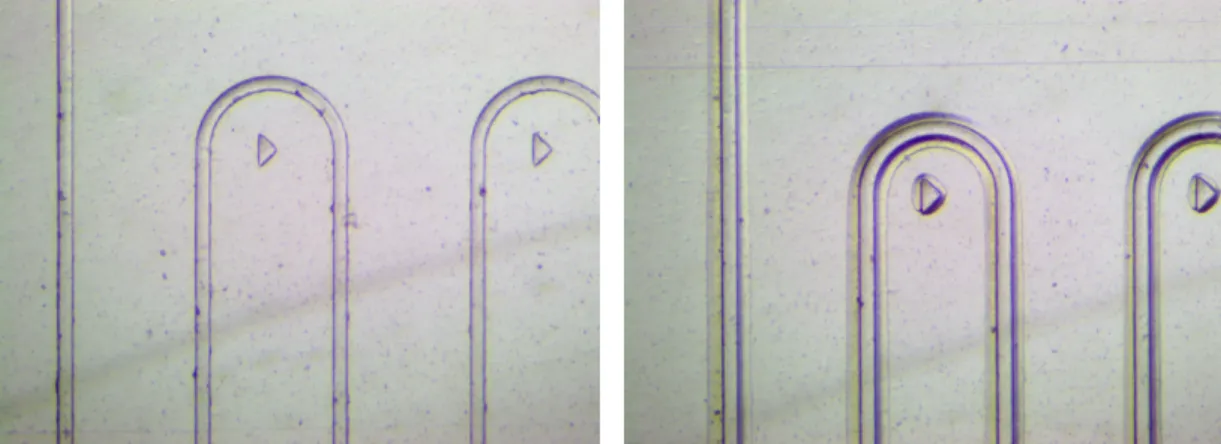
3-5 Well-Formed and Poorly-Formed Channels with Tape Applied: Images of (left) a well-formed device with sharp corners, and (right) a poorly formed device with rounded corners. The line of tape contact marking the channel width is visible by a change in index of refraction [14]. . . 46
3-6 Fluid Flowing through Test Device: The two fluids (blue and clear) enter unmixed, and the color becomes uniform as it passes through the device [14]. The degree of mixing depends only on how long the two streams have been adjacent, as it is a diffusion process; so the mixing point is a measure of flow velocity, which is controlled by the channel profile. . . 46
4-1 Flexural Bearing Design: Shown here are the flexure design (top) and a schematic of how this design would be incorporated into a forming machine (bottom). In this design, the tool was intended to be mounted facing downward on the center stage, and the facing platen mounted on the base at the bottom of the flexure. A shaft passing through the opening at the top would apply a force to the top of the stage during forming. . . 52 4-2 Simulation of Stresses under 12mm Z-Displacement: To ensure a safety
factor of approximately 2, the length of each flexure blade was required to be approximately 100mm. . . 53 4-3 Finite Element Simulations of Planar Stiffness of Flexural Bearing.
Un-der 10N in-plane loads, the flexural bearing deformed 5.56µm parallel to the blades (left) and 12.0µm perpendicular to the blades (right). Under combined downward and cross loading, the planar stiffness de-creases due to buckling effects, and the error becomes worse. . . 54 4-4 Firestone AirStroke Pneumatic Actuator: The actuator consists of a
specially shaped and reinforced rubber cylinder between two metal plates, which have fixtures for mounting. . . 56 4-5 Linearity of Output Force with Pressure: Extracted from the curves
provided by Firestone, at a fixed height of 95mm (the approximate height of the actuator when the platens are in contact), increasing pressure generates a highly linear increase in force [21]. . . 57 4-6 Planar Adjustment Flexure: A solid model of the planar flexure
allow-ing position calibration between the tool and the substrate. The holes visible on the vertical walls are threaded for thumb screws, which are used to manually adjust its planar position and angle. By adjusting sets of screws parallel to a direction of motion (orange or blue), the flexure may be translated; by adjusting two diagonally opposing screws (green), the flexure may be rotated. . . 59
4-7 Final Design for the Thermal Stack: A photograph of the completed thermal stack (left) has key components labeled; an exploded view of the stack (right) shows internal components not visible in the final assembled version. . . 60 4-8 Finite Element Simulation of Cooling Peformance for Aluminum: finite
element models of the cooling block showed that within 30 seconds, the block and a heated piece of PMMA placed on top both achieve a uniform temperature distribution. The scale bar ranges from 283K to 285K. . . 63 4-9 Model of Completed Hardware: This is a solid model of the finalized
hardware with key components labeled. . . 64 4-10 Photograph of Completed Hardware: In this photograph, the actual
physical hardware, with key components labeled, is shown. . . 65 4-11 Step Response for the Actuation System: The step response looks
dominantly first order. The horizontal axis is listed in samples; the sampling rate was 1ksample/s. The vertical axis is labeled in volts output from the load cell. . . 70 4-12 Microfactory Control Loop: Shown in the context of the entire
micro-factory loop, the loop relevant to the hot embosser is shown in the broken blue box. The structure of the force control loop is shown in the green dashed box. The two black dashed boxes indicate subsystems that have internally applied controls. . . 71 4-13 Schematic of the Coolant and Pneumatic System: This diagram
in-dicates the flow path of the pneumatic and coolant inputs into the system. Black arrows indicate airflow only; blue arrows indicate the flow of coolant, potentially mixed with air. . . 73 4-14 Bulk Metallic Glass Tool: Here the machine forming area is propped
open in order to capture an image of the tool. The pattern on the tool is visible, as well as a blank substrate loaded onto the lower platen. . 74
4-15 Heater Temperature Profiles During Production Cycle: One heater’s temperature lags behind the other during ramp-up because of its lower maximum output power, but by the time forming begins at 60 seconds, the two heaters are within 3◦C of each other. . . 75 4-16 Measured Force Profile During Production Cycle: The force output
follows the commanded force setpoint to within a few percent. The observed overshoot is possible due to several possible contributions, such as nonlinearities in the system, accumulated error in the integrator (capped by antiwindup), and unmodeled system behavior. . . 76 4-17 Measured Force for Voltage Command to Actuator: The
actuator-sensor loop was designed and verified to be extremely linear in the regime in which it is in contact with the platens. However, before the platens make contact, nonlinearities in the system, such as the blade flexure at large displacements, give a nonlinear output. . . 77
5-1 Underformed, Well-formed, and Overformed Devices: Shown here is an underformed device (left), in which the channels are not fully impressed into the substrate; a well-formed device (center); and an overformed device, in which the channels are well-formed but the macroscale ap-pearance of the device is distorted and uneven [14]. . . 80 5-2 LVDT Contact Points: The orange arrow indicates the two points
between which the LDVT measures displacement–i.e., the roof of the structure and the moving shaft. The two active thermal stacks and any deformation of the roof of the structure then are included in the total displacement measured by the LVDT. Note that because the clearance gap required for loading is larger than the LVDT’s measured range, the LVDT is not in contact with the structure except for the final 1mm of its travel. . . 83
5-3 LVDT Output During Production Cycle: The LVDT provides a win-dow into what is happening during the process. During the heating cycle, thermal expansion occurs, and then as the polymer reaches its glass transition temperature, imprinting begins; in the forming cycle, large deformations are imparted under high forces; and then in the cooling cycle, thermal contraction occurs. . . 85 5-4 Accuracy of Initial Thickness Measurement: Here, automated
measure-ments are compared to manual micrometer measuremeasure-ments (the dark green and purple bars and the left axis), while the percentage error is also displayed for each measurement (light green bars and the right axis). 87 5-5 Images Taken for Optical Area Measurement: From left to right: an
image of a blank substrate before forming; an image of the same sub-strate post-forming, with some overforming visible on the edges; an image of the substrate, thresholded; and a filled image of the substrate so area may be computed. The resulting area of the substrates is highly sensitive to the threshold level, down to even 2% changes in the level; any variations in light level make changing this threshold level necessary and induce noise. . . 89 5-6 Correlation of Bulk Displacement Measurement with Area
Measure-ment: The bulk deformation measurement matched the expected quadratic relationship fairly well. . . 90 5-7 Experimental Data Measuring Effective Stiffness: The inflection point
is clear in both the experimental data; the glass transition temperature is estimated at 115◦C as indicated by the dashed vertical line. . . 92 A-1 Instrumentation Circuit Diagram: This diagram shows the
implemen-tation of the circuit linking the sensors to the data acquisition device. The circuit signals are amplified, filtered, and then passed to a data acquisition device. . . 100
A-2 Power Electronics Circuit Diagram: This diagram shows the imple-mentation of the circuit providing power to all system components as well as the instrumentation circuit. 120V AC and 24V DC signals are used as main power lines. Signals from the data acqusition device and the heater controllers are conditioned and passed to solid-state relays
to control hardware components. . . 101
B-1 Schematic of Complete System: Here the entire system is diagrammed, showing connections between the pneumatic, coolant, electronic, and mechanical components. . . 103
C-1 Planar adjustment flexure. . . 106
C-2 Structural spacer plate mounted on the ceiling of the O-frame. . . 106
C-3 Bottom cooling block. . . 107
C-4 Top cooling block. . . 107
C-5 Bottom platen. . . 108
C-6 Top platen. . . 109
C-7 One of the two demolding tabs. . . 110
C-8 The second of the two demolding tabs. . . 111
C-9 Figure 8 shaped LVDT clamp. . . 111
C-10 Guiding blade flexure that prevents axial rotation of the shaft. . . 112
C-11 The bottom piece clamping the blade flexure to the O-frame. . . 112
C-12 The top piece clamping the blade flexure to the O-frame. . . 113
C-13 The structural piece clamping the flexure between the bottom thermal stack and the shaft. . . 113
C-14 The O-frame legs. Note that on one the two smallest holes are not featured. . . 114
C-15 The top crossbeam of the O-frame. . . 114
C-16 Cap for Firestone Airstroke actuator. . . 115
C-17 Block on which Firestone Airstroke is mounted. . . 116
C-19 Structural elements used to mount and position the air bushing pillow block. . . 118 C-20 The template for the HIPS safety shield mold, before bending and
Chapter 1
Introduction
1.1
Microfluidic Devices
Microfluidic technologies are a recent development that show great promise in sim-plifying and facilitating various fluidic tasks such as biological assays, polymerase chain reaction (PCR), cell sorting, and more. As detailed by George Whitesides [1], “[i]t is the science and technology of systems that process or manipulate small (10−9 to 10−18 litres) amounts of fluids, using channels with dimensions of tens to hun-dreds of micrometers.” An example of one of these devices is shown in Figure 1-1, in which complex networks of channels used to route fluid are demonstrated. At this scale, individual cells and even large molecules can be manipulated using droplet mechanics and electromagnetic fields. Very small quantities of potentially expensive reactants are required to complete procedures with volumes of this order of magni-tude. Additionally, the size and cost of a microfluidic device is intentionally minimal, circumventing the expense and bulk of full lab test setups. In sum, these devices are an attractive product, in particular for the medical field, and an area of active research development.
Typically, laboratory-scale fabrication of microfluidic device designs is done by casting a two-part soft polymer, polydimethyl siloxane (PDMS), onto a featured sur-face, typically patterned using conventional photolithography techniques. PDMS is capable of conforming to even nanoscale features, making it ideal for replicating a
Figure 1-1: Example of a Microfluidic Device: This diagnostic device performs sand-wich immunoassays. The tiny screws act as manual valves, and the assays are done in the complex networks of channels. [1]
Figure 1-2: Nanoscale features in PDMS: This figure shows images of molds created by casting PDMS onto self-assembled polystyrene structures, and then again casting PDMS into the resulting negative. Note the feature replication down to the scale of 100nm. [17]
finely textured master; in Figure 1-2, an example of the level of fidelity of replication is shown. The PDMS, which now forms three of the four walls of the enclosed chan-nel, is then often plasma treated to change its surface energy and bonded to a glass backplane, thus sealing and completing a device [2].
However, PDMS has several disadvantages as an engineering material; though temperature resistant, it tends to become brittle with age or long-term exposure to heat. It has poor dimensional stability and has a tendency to absorb certain solvents such as hexanes as well as small biologically interesting molecules such as estrogen [3]. And finally, the two-part casting process does not easily lend itself to automated mass manufacture. To this end, investigating alternative materials and means of fabricating these devices from them is a topic of interest.
The next logical step for high-volume production of these devices, then, is to move to hard thermoplastics conventionally used for mass production of low-cost compo-nents and products, such as cyclic oleifin polymers (COPs) or polymethylmethacrylate (PMMA). However, the best method to use these materials to produce microfluidic devices is still under investigation.
1.2
Fabrication of Microfluidic Devices
There exist several methods currently practiced in the state of the art to fabricate mi-crofluidic devices out of hard polymers. The option to utilize serial material removal processes such as directly micromachining or laser engraving channels into substrates is one possibility. In micromachining, a tool tip is used to remove material by shear-ing it away. Diamond turnshear-ing is capable of producshear-ing molds with features sizes of 10µm and surface roughnesses of 1µm but is not well suited for smaller geometries. Additionally, for repeated geometries over a large area, micromachining is a very slow process [2].
Direct laser ablation is another choice, in which a focused laser beam causes the polymer to selectively vaporize in the area of focus. Using photolithography tech-niques, micro and nanopatterns with very high resolution can be obtained. However,
melting occurs in the areas bordering the resulting cavity, and many polymers suit-able for microfluidic device production are not suitsuit-able for laser ablation. In addition, this process is low-throughput, as it is also a serial process [2].
Another possibility is to use injection molding to create devices. The hard thermo-plastics used in injection molding are preferable for mass manufacturing due to their dimensional stability, temperature resistance, and low cost. There are some difficul-ties associated with using injection molding to replicate such small features, however; because of their microscale size, if the mold temperature is lower than the melting point of the polymer, the polymer can thicken or solidify and fail to fill microscale features in the mold, especially those of high aspect ratios. By using heated molds and careful process optimization, injection molding can result in acceptable levels of feature replication on the microscale, which is of the greatest interest to microfluidic device developers [4]. However, the tooling and production capital costs associated with injection molding capability, in particular with molds containing microscale fea-tures, is high compared to other processes. This means that for a very large quantity of devices, injection molding is economical; however, it is an undesirable option for the purpose of producing smaller volumes of devices, or for situations in which the microfluidic device design may be revised (thus requiring a new mold insert, or pos-sibly an entirely new mold, to be fabricated) [5].
Nanoimprint lithography is another technique currently proposed. In this tech-nique, a patterned mold is first pressed into a resist on a backing substrate to impart micro- or nano-structures; the resist is developed; and then a material removal tech-nique such as reactive ion etching is used to remove any residual resist. Success has been reported in utilizing this technique to pattern large areas, but it has yet to be demonstrated as a manufacturing scale technique [2].
Ultraviolet imprinting is another available technique. In this technique, a fluid polymer is allowed to flow into the shape of a mold, and then is exposed to ultra-violet light to harden and cure it. UV imprinting requires a mold transparent to ultraviolet light, such as one made of quartz or certain polymers [6]. However, the mechanical and manufacturing demands of nanoimprint lithography can be similar
to that of conventional lithography, making it a relatively expensive process for the production of what are intended to be low-cost devices [7].
1.3
Hot Embossing
Hot embossing is a process that addresses the high-flexibility, low-cost, medium-volume niche. It is a parallel process like injection molding; however, the equipment and tooling demands are simpler and lower-cost. The cycle time required to produce one part is generally longer due to the need to individually heat each blank substrate, but embossing results in a similar level of fidelity in feature replication as injection molding, with the potential to mold higher aspect ratio features [4]. Plus, because the polymer is only superficially flowed into the mold microstructures, only small residual stresses are produced in the part, making hot embossing both less damaging to molding tools, capable of forming more complex or delicate structures, and suitable for producing optical components such as waveguides [5]. Additionally, producing stamping tools is on par with producing inserts for plastic injection molding, and setup time to exchange tools and adjust machine parameters is shorter, as embossing machines are simple and require few modifications [5].
Thus, the hot embossing process provides a fabrication technique addressing the needs of devices designers who might need to rapidly iterate designs as they port a soft-polymer device to a hard-polymer form; of researchers who might want to produce a limited but consequential number of devices for a large-scale study; or of producers looking for options requiring low capital investment [5]. But, hot embossing is not limited to these environments; the process capabilities are similar or beyond those of injection molding, and the capital equipment required for production is lower cost and suitable for parallelization: hot embossing is a completely feasible process to be employed on a mass production scale. However, perhaps due to a widespread lack of understanding of the process physics and especially of commercially equipment suitable for industrial microembossing, and the process remains a path less frequently tread for industrial production of microfluidic devices. The work completed in this
re-search project seeks to demonstrate that the hot embossing process is in fact an equal or superior industrial scale process to injection molding for certain device designs.
In the hot embossing process, a hard, amorphous polymer is heated until it passes its glass transition temperature, becoming soft and malleable. A patterned tool is then pressed into the polymer, creating regions of high pressure that induce flow of the polymer. This flow is dependent on the viscoplastic properties of the polymer (determined by the material and the temperature), the induced pressures, and the rate at which the stamp is driven into the substrate. After sufficient formation has occurred, the polymer may then be cooled while still engaging the tool, freezing its molecular structure in place, as shown in Figure 1-3. Finally, the tool is withdrawn from the imprinted polymer in a step called demolding. The physical process of hot embossing is further detailed in Chapter 2.
1.4
Equipment Needs and State of the Art
Traditionally, hot embossing had not been applied to precision applications such as the fabrication of microfluidic devices. There exist, then, few available off-the-shelf solutions intended to perform precision hot embossing.
Industrial hot embossing machines do exist, but are primarily targeted at creat-ing macroscale embossed patterns in various materials, includcreat-ing leather, foils, and polymers [24]. But, these machine shop floor products are not intended for use in creating products with microscale precision.
Laminating machines are another tool co-opted for use in hot embossing. Lami-nating machines essentially apply heat and pressure to flat materials passed between two rollers. In work performed by Jeon and Kamm, successful embossing was per-formed using a laminator—but required an entire hour to be completed [8].
More specialized solutions from industry are available, such as those from EV Group. The EVG 750 consists of a fully automated system with cassettes for unformed substrates, temperature capabilities up to 220◦C and the ability to emboss areas of 20cm2 by applying up to 360kN of force [7]. A lower-end model, the semi-automated
Figure 1-3: Schematic of the Hot Embossing Process: In step 1, a blank substrate is pressed against a rigid patterned tool; in step 2, the substrate flows and conforms to the tool; and in step 3, the substrate is removed from the tool, retaining permanent features in the negative of the tool [20].
EVG 520HE, features a maximum force application of some 60kN and is capable of embossing an area 20cm on the diagonal. It does also feature an ultraviolet light source and a vacuum chamber, as well as a loading and unloading mechanism [7]. Both devices outperform more primitive presses, demonstrating the levels of precision and control in forming that are required to produce high quality microfluidic devices [25]. To purchase and install such equipment at the EVG520HE is on the order of some $200,000, a significant investment [26].
Thus, though low-cost but imprecise options and high-cost but high-quality op-tions are available, no existing solution has yet offered a low-cost, “right size” option with sufficient precision for microscale polymer embossing. This serves as a barrier for the adoption of hot embossing both on the medium-volume scale by groups such as microfluidics research labs or startup companies developing their first devices and on the industrial scale in which parallel production could be used to create high throughput.
1.5
Project Motivation
To this end, this research project set out to develop the application of the hot em-bossing process to polymer microscale fabrication in the context of production-scale manufacturing. In order to accomplish this goal, there were numerous considerations that needed to be addressed.
First, there was the lack of existing precision fabrication equipment targeted to this purpose, making the study of the embossing process difficult. Over the course of this research effort, several generations of equipment had been developed by researchers preceding the author. The first two generations were focused on developing process knowledge in an experimental fashion rather than on implementing the process in a manufacturing environment. Though all input parameters could be well controlled, the cycle time to produce a single part was on the order of 30 minutes [18]. Once process knowledge was established, the next generations of hardware could focus on using that knowledge to design precision fabrication equipment with a focus on low
cost, low cycle time, and an appropriate level of precision and parameter control [13]. It was determined that in order to properly study hot embossing as a manufac-turing process, first a suitable testbed system would need to be developed [27]. The testbed, deemed the “micro-factory,” or “µFac,” would consist of several completely automated modules that could be scheduled to produce and measure microfluidic de-vices. The automated modules, combined with an commercial pick-and-place robot to perform materials handling, would remove operator-induced variation from the equa-tion. And, if machine variation could be reduced to a minimum, the testbed would then serve as a suitable platform to investigate natural process variation, produce sta-tistical models of the hot embossing process, and implement closed-loop cycle-to-cycle control of the process based on finished product function.
The contributions of this thesis are then aimed toward accomplishing this goal. The first contribution is to develop automated precision embossing equipment that reduces machine variation to a minimum, building on lessons learned from previous generations of equipment. The second contribution is to utilize this equipment to make relevant and interesting measurements of process phenomena that are indicators of quality as well as physical confirmations of process physics models.
Chapter 2
Process Physics of Hot Embossing
2.1
The Hot Embossing Process
The hot embossing process in one in which permanent plastic deformation is imparted to a polymer substrate using a heated featured stamp. In the process used in this re-search, the substrate is first heated above its glass transition, facilitating plastic flow at low levels of applied pressure. This heating is performed while lightly pressing the tool into the substrate in order to maintain contact and increase the efficiency of the heating process. Once the substrate has reached its forming temperature, a higher force is applied, creating pressures sufficient for viscoplastic flow of the substrate. The substrate flows around and conforms to rigid features on a tool, replicating them on the micro- and even nano-scale, down to 25nm [28]. Once sufficient feature replication has been accomplished, the substrate is cooled to below its glass transition temper-ature, solidifying its molecular structure and returning its mechanical properties to glassy. Finally, the substrate is demolded from the tool, and features are permanently formed into the surface of the substrate. This process is demonstrated in Figure 2-1 using the force and temperature profiles undergone by the substrate.
This process typically completes three walls of the four-walled channel. To finish the device, a roof must also be added. For the purposes of this research, it was found that biocompatible pressure adhesive tape manufactured by Tesa Tape Inc. was sufficient to provide a fourth wall. After forming is complete, tape is applied
Figure 2-1: Ideal Forming Cycle for Hot Embossing: This diagram indicates typical levels of force and temperature (the selected input parameters) during a forming cycle for PMMA substrates [18].
using a compliant roller, and trimmed using an automated device1. The microfluidic device is then complete and ready for quality inspection, testing, and use.
The material that was the focus of this experimentation is polymethylmethacry-late (PMMA), a brittle, glassy polymer with high optical clarity. PMMA has a typical glass transition temperature of approximately 105◦C [10], but this can vary from 85◦C to 165◦C depending on its the specific molecular composition [29]. At this temperature, its mechanical properties suddenly transform, and it changes from being a primarily elastic material to what is better described as an elastic-viscoplastic material; and then, as it reaches its melting temperature of approximately 250◦C [9], it becomes a viscous liquid.
The embossing process takes place in the elastic-viscoplastic regime between the glass transition and melting temperature. Figure 2-2 shows experimental compres-sion data in this region; a large amount of permanent deformation with low, nearly-constant levels of stress is apparent. For amorphous, glassy polymers, as the
tem-1The work to develop the taping process, including the development of the automated tape application and trimming device, as well as work to develop an automatic testing device, is currently being developed by Caitlin Reyda, and is scheduled to be completed by September 2013.
Figure 2-2: Experimental Compression Data for PMMA at Various Temperatures: In this experimental data, the dramatic change in flow stress as the temperature is increased from ambient to above glass transition (110◦C) is clear. The 110◦C curve displays remarkably plastic behavior, showing very little increase in stress with large strains. This particular test was performed at a fixed strain rate, but the behavior is also rate dependent [12].
Figure 2-3: Mechanical Elements Model of PMMA: A mechanical elements model representing the 3 micromechanisms that control the material properties of amorop-hous polymers such as PMMA. Each micromechanism is numbered for referencing in the text [12].
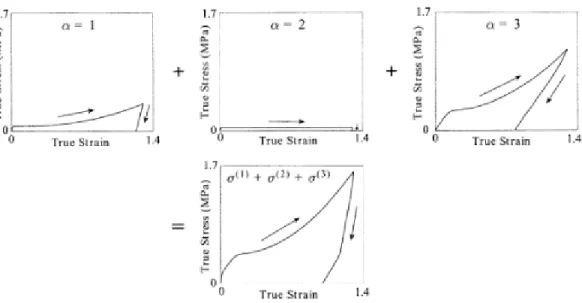
perature increases, their molecules experience greater mobility and ability to twist and rotate, cross-linking between polymer chains weakens, and the shear modulus decreases. At the glass transition temperature, this change becomes suddenly and drastically accentuated, as shown in by the change in the shape of the curves in Fig-ure 2-2. At this point the material can be considered elastic-perfectly viscoplastic, and its behavior can be modeled using the mechanical elements shown in Figure 2-3. This model is intended to cover the behavior of a polymer throughout the tem-perature range from below its glass transition to above it. To accomplish this, the contribution of each component varies with the temperature regime. The first mi-cromechanism indicated in the diagram is indicated with numeral 1. A nonlinear spring models the elastic resistance to molecular bond stretching; the dashpot mod-els thermally-activated plastic flow due to polymer deformation mechanisms such as molecular chain rotation and slippage between cross-linkage locations; and the nonlin-ear spring in parallel with the dashpot models an energy storage property generated by any elastic instabilities caused by viscoplastic flow. The second and third mech-anisms, denoted by numerals 2 and 3, also consist of nonlinear springs representing energy stored in stretching molecular chains between cross-link sites. The dashpots again model thermally-activated plastic flow and slippage between cross-link sites. These mechanisms are duplicated to facilitate modeling complex observed behavior [12]. Above glass transition temperature, mechanism 2 has a negligible contribution to material behavior, and mechanisms 1 and 3 control the material properties. The combined effects of these two micromechanisms appear as an elastic curve that trans-forms into nearly linear creep over large strains, with a small amount of springback during unloading, as shown in Figure 2-4 [12].
The practical application of this understanding is essentially that under the correct conditions, large amounts of plastic flow can be induced in the polymer. During the forming stage of the embossing process, then, a constant high-stress stress state is induced, forcing creep that results in permanent plastic deformation and flow outward on unconstrained surfaces, including into the tool cavities. This flow is dependent on the strain rate (as modeled by the dashpots), the induced stress, and the temperature
Figure 2-4: Stress-Strain Contributions of Individual PMMA Micromechanisms: The contributions of micromechanisms 1 through 3 for temperatures above the glass tran-sition temperature show that both mechanisms 1 and 3 have nonlinear combined elastic and plastic behavior. The contribution of micromechanism 2 is reduced to being essentially negligible in this regime [12].
relative to glass transition (which determines the constants of the nonlinear springs and the dashpots—that is, the material properties). The net result is that as these inputs are adjusted to increase the amount of flow, the initially flat substrate flows up into the cavities on the rigid forming tool, forming a front or shoulder that more and more closely replicates the tool as increasing amounts of plastic deformation are induced. Experimental data showing the profile of this front is shown in Figure 2-5.
That is, in order for the embossing process to be successful, the inputs that control the physics of the process and therefore must be controlled are the strain rate, the induced stress (as controlled by force applied over the fixed area of the stamping tool), and the temperature.
2.2
The Demolding Process
A note should be made here that though the demolding process, if performed at any temperature sufficiently below the glass transition temperature, should have little effect on part formation, it is still important, primarily because loads on the mold
Figure 2-5: Experimental Embossing Formation Results for PMMA at Varying Force Levels: Experimental profiles for a channel measuring 500µm by 50µm (axes not to scale) are shown. As the force level is increased, the shoulder fills up into the corners of the tool features, better replicating the sharp stepped profile of the tool; at all force levels, the bottom of the channel is well-formed. [10].
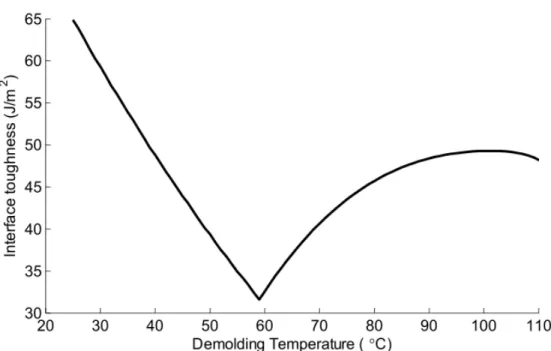
Figure 2-6: Demolding Energy as a Function of Part Temperature: Mechanical inter-facial energy dominates at low temperatures, and decreases approximately linearly as temperature increases; adhesion interfacial energy dominates at high temperatures, and increases nonlinearly as temperature increases. The optimal demolding temper-ature is taken to be at the minimum of these energies. [18].
during demolding are high and potentially damaging due to two mechanisms. The first is the mechanism of adhesion, which can be chemical and mechanical in nature; during forming and thermal contraction, the polymer substrate comes into intimate contact with the tool (replicating features down to 10nm), and tends to mold onto and snag on any surface roughness on the tool [18, 19]. The second is the mechanism of thermally-induced mechanical stresses; simply because the polymer has a much larger coefficient of thermal expansion than the metallic tool, as the temperature is decreased, it contracts with greater and greater stresses on the tool, potentially damaging itself or the tool. These two mechanisms are opposing with temperature, and a point at which the effects are both are minimized can be found, as shown in Figure 2-6. As computed by Dirckx, the optimal demolding temperature for PMMA is approximately 60◦C.
2.3
Input Parameters and Sources of Variation
In order to control the process on a practical level, the input parameters selected were induced stress, in the form of force applied over a fixed area; and temperature. In the context of this thesis work, strain rate is indirectly determined by the force setpoint and the amount of time over which forming occurs, both of which are controlled variables. A second valid set of inputs would be to control temperature and strain rate.
With the goal of this project being to study hot embossing as a process suitable for manufacturing, it is of primary interest to be able to minimize the variations in the process. In general, variations in any of the input parameters will cause some variation to the degree to which the final product is formed. That is, any change to the force setpoint, the temperature, or the forming time will affect the process physics in such a way as to change how far the flow front advances into the features of the tool.
Additionally, material variations in the PMMA sheets from which blank substrates are prepared have been found to be vast. Not only is likely some variation in glass transition temperature, due to its dependence on the precise molecular weight of the polymer, but there is significant variation in geometry. The thickness of these sheets and the resulting blanks has been shown to be wildly inconsistent from the 1.5mm nominal thickness, ranging from 1.1mm to 1.8mm. The major consequence of this fact is that the effective temperature throughout the blank substrate may be differ-ent, though the surface temperature to the forming depth has been experimentally measured to be unaffected by differences in blank geometry.
There is also some inherent variation in any production machine, as well as in any operator interactions with that machine. This is true also in this case, though through thoughtful machine design and a shift to automated processes, equipment and human variations have been minimized. Given an understanding of the relative contributions of each source of variation, development of process control can proceed.
Chapter 3
Project History and Objectives
3.1
Historical Designs
Given the goals of the project and the limitations on commercially available equipment as detailed in Chapter 1, it became clear early in the projects history that customized equipment would need to be constructed.
The first generation of equipment was developed by Ganesan and installed on an Instron 5869 load frame. It consisted of a pair of copper platens, made large to ensure temperature uniformity and heated using cartridge heaters; temperature control was achieved using Chromalox 2110 controllers. Active cooling was accomplished using tap water. The Instron load frame allowed for a variety of load profiles to be imparted to the substrate, as it had a positioning resolution of 0.0625µm and a 50kN capacity [13]. The heating and cooling rates as well as the demolding temperature, however, were not well-controlled, and the machine required some 15 minutes to heat and 5 minutes to cool due to the large thermal mass of the copper platens [13]. A plot showing a temperature profile from this machine is visible in Figure 3-1.
To attempt to improve on input parameter control and to further the goal of studying the embossing process in a manufacturing environment, the second genera-tion of equipment focused primarily on redesigning the platens. Dirckx reduced the thermal mass of the copper platens, and switched to using a mixture of heated and room-temperature Paratherm MR oil. This provided the capability to impart both
Figure 3-1: Temperature Profile for Generation 1 Machine: Though the temperature uniformity is good, some five minutes are required to get close to forming temperature [20].
Figure 3-2: Temperature Profile for Generation 2 Machine: The Generation 2 machine showed an excellent ability to match temperature setpoints, but takes approximately 2 minutes to heat and cool, requiring the cycle time to be on the order of 5 minutes [18].
arbitrary force and displacement profiles as well as temperature profiles. The cycle time was improved to approximately 5 minutes, requiring approximately 2 minutes for heating and 2 minutes for cooling [13]. A sample experimental temperature profile for this system is shown in Figure 3-2.
The third generation of equipment, developed by Hale, broke away from the In-stron load frame and attempted to develop a manufacturing-focused, fast, compact, and capable machine based on process knowledge developed from predecessors work. The machine featured a curved cantilever spine supporting a double-acting air cylin-der with a 9.8kN capacity. Cooling was accomplished by bringing a large copper mass with cooled water flowing through it in contact with the lower platen, serving as a heat sink; by distancing the mass from the platen, the platen could be heated rapidly. This heat sink was guided by ceramic pins, preventing any thermal leak to the
ma-chine structure. Heating was accomplished using 1in by 3in Watlow Ultramic series ceramic heaters, which displayed a high power output as well as exceptional temper-ature uniformity. These heaters were installed in pockets in the aluminum forming platens and were controlled by Watlow SD6C series PID heater controllers. A load cell installed in the line of compression on the device was capable of measuring forces up to the 9.8kN capacity, and thermocouples built into the heaters measured tem-perature. Force control was established using a proportional valve controller on the cylinder, which responded to output signals from the load cell and from a LabVIEW software controller [13]. This equipment successfully achieved the desired cycle time of approximately 2 minutes, needing 1 minute for heating, 30 seconds for forming, and 45 seconds for cooling.
Though this equipment made strides in applying process physics knowledge to de-signing right-size equipment appropriate for manufacturing environments, some addi-tional concerns arose. First was the observation that though FEA models predicted that the thin polymer substrates should be a uniform temperature throughout, cooling from only one side actually imparted some thermal gradient and caused macroscale warping throughout the finished product. The temperature asymmetry caused by cooling from only one side is visible in Figure 3-3. Second was the observation that there was thermal leakage into the machine structure over time, causing machine tran-sients and increasing machine variation. Finally, the double-acting cylinder proved to be a less than ideal force source, due to its stiction and a minimum force requirement for motion that made controlled force application difficult. After evaluation of the operation of the machine, it was determined that another generation of equipment needed to be developed in order to successfully study process control in the context of manufacturing.
3.2
Microfactory Project Objectives
Overall, the stated goal of the microfactory project is to study the hot embossing process as applied to microfluidics devices, in a manufacturing-oriented environment.
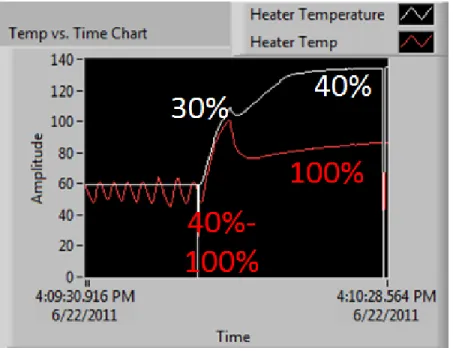
Figure 3-3: Asymmetric Temperature Profiles in Generation 3 Hardware: In this plot, the top (white) and bottom (red) temperature profiles for the generation 3 equipment can be observed; the numbers overlaid on the graph indicate the power output of each heater at that point in time. The initial heating rate of the top and bottom heaters are approximately the same, but when contact between the part and tool is initiated (noted by the peak approximately in the center of the plot), the bottom temperature diverges from the top. Due to the fact that the flow of coolant is never shut off, the bottom heater, exposed to the cooling block, struggles to maintain the setpoint temperature of 140◦C, even at 100% power.
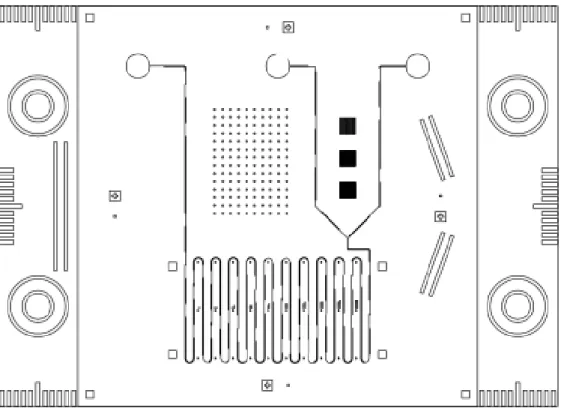
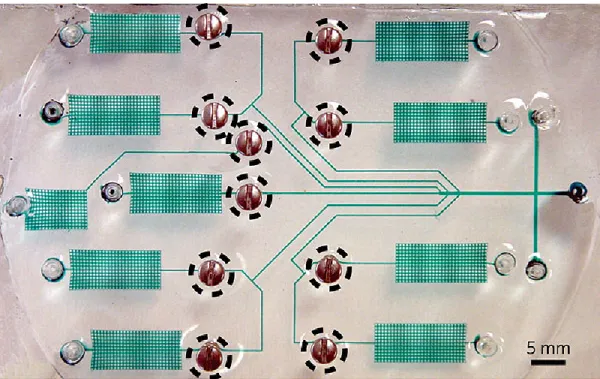
Figure 3-4: Test Micromixer Device: Fluid is input into the two rightmost ports, and exits in the leftmost port. The channels are 50µm wide. Additional test and metrology features are distributed throughout the design, including a grid of squares 20µm in size.
To accomplish this goal, the first step was to develop a testbed factory cell capable of minimizing equipment- and operator-induced variation. The work presented in this thesis contributes to this goal by developing precision hot embossing equipment serving as a suitable basis for further project developing.
Because the goal of this project is to study the hot embossing process instead of any one particular microfluidic design, a test micromixer design was chosen. In this design, two streams of fluid flow together and meet, and then proceed through a long serpentine channel; eventually these two streams become fully mixed by the process of diffusion in this long channel. The characteristic dimensions of this test device are channels 40µm deep and 50µm tall, giving an aspect ratio of 0.8. The finished devices are relatively small in size, occupying an approximately 2.5cm by 2.5cm embossed area. The mask used to create this test pattern is shown in Figure 3-4.
To complete the device, it must be sealed on the top. Again, because the goal of this project is to study the hot embossing process, any suitably quick and simple sealing process was deemed appropriate to the project goals. Pressure adhesive tape manufactured by Tesa Tape Inc. proved to be a superior choice due to its ease of use. The thick backing gives the tape rigidity, prevent it from collapsing into the channels. The adhesive is compatible with some biological applications, and has a thickness small enough to avoid filling the channel.1 The fact that the tape presents a nonuniform fourth wall (consisting of adhesive instead of PMMA) to the fluid flow is not a major concern for the purpose of developing the hot embossing process, but could be problematic for some applications.
Using this tape gives an interesting option for measuring part formation. Because the shoulders of the channel profile are the last part to form, and flow upward in a front of decreasing curvature with increasing fidelity to the tool (see Figure 2-5), these are the chief measure of part quality—that is, how closely the tool pattern was replicated on the finished product. When the tape is applied to the top surface, a change in the index of refraction occurs where the adhesive bonds to the PMMA, creating an optically visible shadow, shown in Figure 3-5. By imaging each device and measuring the width between these lines, the width of the shoulders can be extrapolated, and the profile inferred, based on the fact that the bottom of the channel forms correctly even under very low applied forces. This has proven a much faster and more holistic measurement than individually assessing each profile using confocal microscopy, scanning electron microscopy, or other tools. In addition, by performing a functional test and flowing fluid through the device, the point at which the two input fluid streams are fully mixed serves as another holistic measure of quality (as it is dependent on flow rate), and can indicate problems at the inlet or outlet ports that are not visible in the channel width measurement. An image showing the two streams gradually mixing is shown in Figure 3-6.
By quantifying these measurements, a numerical output of quality can be made.
1Due to the fact that the tape is under development by Tesa and is proprietary, further details will not be published in this work, per their request.
Figure 3-5: Well-Formed and Poorly-Formed Channels with Tape Applied: Images of (left) a well-formed device with sharp corners, and (right) a poorly formed device with rounded corners. The line of tape contact marking the channel width is visible by a change in index of refraction [14].
Figure 3-6: Fluid Flowing through Test Device: The two fluids (blue and clear) enter unmixed, and the color becomes uniform as it passes through the device [14]. The degree of mixing depends only on how long the two streams have been adjacent, as it is a diffusion process; so the mixing point is a measure of flow velocity, which is controlled by the channel profile.
Given sufficiently precise embossing equipment and materials handling, any variation measured using these means could then be accounted for by adjusting the embossing forming parameters. Successfully implementing this closed-loop cycle-to-cycle auto-mated feedback control of the process is the central goal of the microfactory project.
Chapter 4
Design of Precision Equipment
4.1
Motivation and Design Specifications
The overarching goal of this project is to develop an experimental testbed “micro-factory” on which closed-loop control of the hot embossing process, as applied to fabrication microfluidic devices, could be investigated. However, in order for this ef-fort to be successful, the first step was to develop a platform with sufficient precision, repeatability, and reliability to allow for it to be abstracted out of the process control efforts.
To this end, several key needs were identified.
1. The equipment needed to move precisely. Only one degree of freedom is required to complete the embossing process. However, to minimize equipment variations, this linear motion needed to be as repeatable as possible.
2. Precise and repeatable control of the applied force was necessary.
3. The substrate needed to be repeatably and accurately registered with the tool, to allow for existing substrate features to align with tool features.
4. The active thermal mass of the system needed to be minimized in order to allow for diminished energy waste as well as faster heating and cooling cycles.
5. A symmetric thermal profile between the upper and lower surfaces of the sub-strate was required in order to prevent residual stresses and any resulting macroscale warping of the substrate.
The previous generation of precision equipment had addressed some of these con-cerns, but also had discovered problems that called for another design revision [13]. In the following sections, the design work involved in developing solutions to each of these needs is detailed, as well as the final solution to each design problem.
4.2
Design
4.2.1
Precision Linear Motion
The first need was for precision and repeatability in the forming motion of the ma-chine. In the work done by Hale, the necessity of separating imprecise force sources from precision linear motion became clear. The double-acting air cylinder used in that equipment, while providing a surfeit of forming force, did not have very controllable or repeatable motion.
The guiding design principle was then to decouple any parasitic motions of the force source from the linear motion of the platens. A precision linear guide of some design was required to accomplish this task. The guide needed to have a range of motion sufficiently large to allow for a gap into which blanks could be loaded into the machine; based on manual ease of use and the existing end effector on the commercial robot arm, this gap was quantified to need to be approximately 0.4in.
The first concept that was developed was to use a parallel flexure design to con-strain all undesirable degrees of freedom. Since flexures exhibit nearly perfectly re-peatable elastic behavior, they are a desirable mechanical element for applications where precise motion is required [30]. The flexure concept was based on a stage mounted on a set of mirrored parallel flexures; the symmetry of the setup would reduce or eliminate planar parasitic errors. However, two major design challenges existed for the flexure. First, the parasitic errors due to in-plane rotation (“rocking
the cradle”) were significant. If force application were even slightly off center, the parallelism of the flexure would be severely compromised, in particular along the di-rection axially parallel to the blades. Limitations on in-house fabrication capabilities restricted the flexure design to a minimum thickness of approximately 0.050in. Given this fixed constraint, the solution was to make the blades of the flexures wider and thus more resistant to torsion. Using sequential finite element simulations, it was determined that the flexures were required to be 25mm wide to rein any torsional errors in to 1µm under a 10N torsional load.
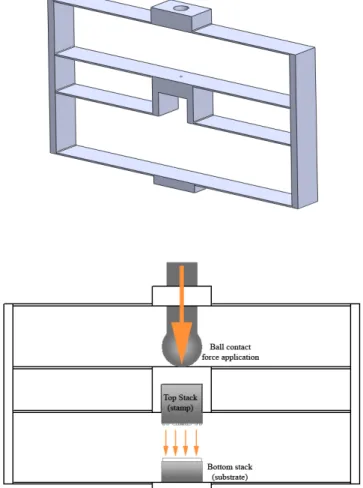
The second problem was that a 0.4in range of motion was required. Most ma-terials suitable for flexures begin to yield at only a few percent strain; aluminum, a preeminent choice, yields at approximately 0.2% strain [31]. To prevent stresses in the flexure from causing it to yield with a safety factor of 2, finite element simula-tions, as shown in Figure 4-2, indicated that the blades needed to be at least 100mm long, giving the flexure a total footprint of 258mm by 25mm, which was large, but still smaller than the previous generation. Diagrams detailing the completed flexural bearing design are shown in Figure 4-1.
Unfortunately, by making the blades longer to increase the range of motion of the flexure, their torsional stiffness was decreased, and they also needed to become wider to compensate. This increased the bending stiffness of the blades, reducing their range of motion, and so on. In the end, the flexural design was rejected because of this trade-off; it was believed that other solutions likely existed that would not require a compromise on performance and compactness.
The next design concept to be investigated was to use an air bushing as a linear guide. In an air bushing, a permeable medium allows air to flow into a bushing; a precision shaft rides in the bushing, with a thin gap between the surface of the shaft and the inner walls of the bushing. A cushion of high-pressure air forms in this gap, creating an extremely stiff and low-friction bearing. The air bushing investigated for the design, a 2in diameter New Way Air Bearings air bushing, had a radial stiffness of 110N/µm and a pitch stiffness of 23Nm/rad [23]. This means that under an estimated radial cross load of 100N, the air bearing would deviate less than 1µm from its radial
Figure 4-1: Flexural Bearing Design: Shown here are the flexure design (top) and a schematic of how this design would be incorporated into a forming machine (bottom). In this design, the tool was intended to be mounted facing downward on the center stage, and the facing platen mounted on the base at the bottom of the flexure. A shaft passing through the opening at the top would apply a force to the top of the stage during forming.
Figure 4-2: Simulation of Stresses under 12mm Z-Displacement: To ensure a safety factor of approximately 2, the length of each flexure blade was required to be approx-imately 100mm.
path. Under a pitch cross load of 20N at the point of application (a worst-case scenario that a clever coupling mechanism could minimze), the deviation of the top surface of the lower platen (designed to be 176mm from the point of application) can be computed as:
(Fcross−load)(r2)
Kradial
= δ. (4.1)
Substituting in known values, the deviation is calculated to be 6.734µm along an arc of radius 176mm. In contrast, finite element simulations indicated that the flexural bearing deviated 5.5µm under a 10N load parallel to the blades, and 12.0µm under a 10N load perpendicular to the blades, as shown in Figure 4-3. In addition, simulations indicated that the stiffness in the parallel direction decreases as the stage translates down, due to a buckling effect on the blades; the simulation then shows error in the best-case scenario. Thus, the worst case scenario for the air bushing presented at minimum a 100% improvement over the best-case scenario of the flexural bearing.
The air bushing was also compact and simple in construction, making its imple-mentation straightforward. Based on its clear superiority, the air bushing was selected as the optimal design choice for a guide for the linear motion.
Figure 4-3: Finite Element Simulations of Planar Stiffness of Flexural Bearing. Under 10N in-plane loads, the flexural bearing deformed 5.56µm parallel to the blades (left) and 12.0µm perpendicular to the blades (right). Under combined downward and cross loading, the planar stiffness decreases due to buckling effects, and the error becomes worse.
The major design challenge presented by the air busing was the fact that it did not constrain axial rotation of the shaft, which was highly undesirable. The immediate solution was to use a clamped blade flexure to control this motion. By orienting the widest dimension of the blade tangential to the axial rotation, the resistance to rotary motion was increased from nearly zero to 3.3×10⁵N/m, as estimated by the
finite element simulation shown in Figure 4-3. Spring steel with a thickness of 0.01in was chosen for its ability to withstand large strains, making it capable of traversing the required 0.4in gap at a blade length of 1.64in. The downside of using a flexure in this application was that by making the flexure compact, the small angle approximation that determines the linearity of its motion was violated, and at the extreme ends of its orbit, it deviates from the linear stiffness curve expected for this type of element. The solution was simply to linearize the system around the point at which the tool contacts the substrate, and to neglect to model the nonlinear extremes.
4.2.2
Precise and Repeatable Force Actuation
Once a linear guide mechanism was chosen, a force source also needed to be chosen. The first concept was to continue to use the pneumatic cylinders from the previous generation of hardware. By placing a spherical contact on the end of the cylinder shaft, the motion transmitted to the linear guide could be constrained to be perfectly linear—all other cross-motions would just result in slip of the contact point around
the contact surface.
However, the pneumatic cylinder presented other problems. Both double-acting and spring return cylinders exhibit a suite of nonlinear behaviors such as stiction and dead zones. Highly granular force control becomes difficult, and successfully applying linear control techniques becomes a difficult battle. After review, it was decided that these pneumatic cylinders were not appropriate for this precision application, and an alternative was sought.
Electromagnetic actuators such as voice coils were also briefly considered. These were soon rejected, primarily due to their low power density compared to pneumatic devices. Without a mechanical element such as a lead screw to multiply force, an enormous actuator would be required. Incorporating such a mechanical element, however, reintroduces some of the nonlinear problems associated with the pneumatic cylinders, such as backlash and stiction. Pneumatic actuators were decided to be superior.
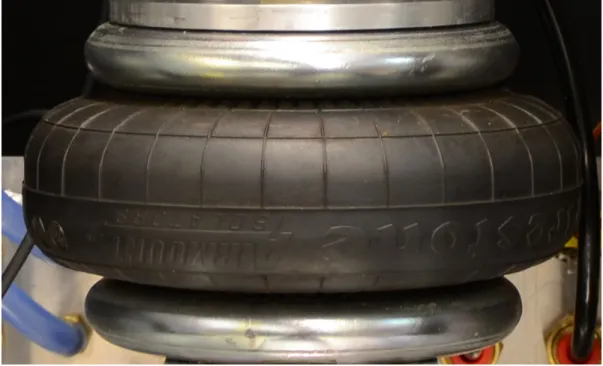
The final design for the pneumatic actuator was an expandable pneumatic bellows, also known as an air spring, and sold commercially as Firestone AirStroke, and shown in Figure 4-4. These devices are most widely recognized as being used in kneeling buses as a means to gently lower the front entrance of the bus to allow for easier boarding, as well as in trucks for shock absorption. It consists of a rubber annulus capped at each end with a steel plate. The annulus was specially designed with reinforcing ribs to make its motion as purely vertical as possible. Because the motion was purely elastic stretching and relaxing as the bladder was inflated and deflated, the continuum of force control was excellent, and had exhibited perfectly linear behavior, as shown in Figure 4-5. The model selected was the Firestone AirStroke W01-M58-6155, with a maximum force exertion of 6.5kN and a maximum stroke of 50mm [21]. Though the pneumatic actuator was designed to exhibit completely vertical mo-tion with little parasitic error, any errors in vertical momo-tion, combined with possible offset errors generated by assembly, could create cross-loading forces on the linear guide, decreasing accuracy and repeatability. To address this problem, a means of coupling the actuator to the linearly guided shaft needed to be developed that
trans-Figure 4-4: Firestone AirStroke Pneumatic Actuator: The actuator consists of a specially shaped and reinforced rubber cylinder between two metal plates, which have fixtures for mounting.
mitted only the desired vertical force and rejected any cross-loading forces. The design solution was to use passive contact between the top surface of the actuator and the bottom surface of the shaft riding in the air bushing, in which the shaft merely rests on the top plate of the air bearing and maintains contact through its own weight. The upper bound on the radial and pitch cross-loading forces is the fact that these forces can only be transmitted by friction between the two machined surfaces of the guided shaft and the actuator cap; once the upper bound of static friction is exceeded, the frictional force is reduced to sliding friction, and minimal cross-forces are transmitted. One last consideration remained. All of these components needed structural sup-port, and this support needed to be designed such that it did not detract from the precision motion when loaded with a maximum force of 2kN. Though the previous generation of hardware had selected the C-frame as showing acceptably small levels of deviation [13], the goal of this thesis work was again to improve on that perfor-mance if possible. A symmetric design was then preferred; an O-frame structure was the first logical choice. When loaded, it deforms symmetrically: the legs stretch in
Figure 4-5: Linearity of Output Force with Pressure: Extracted from the curves provided by Firestone, at a fixed height of 95mm (the approximate height of the actuator when the platens are in contact), increasing pressure generates a highly linear increase in force [21].
a tensile fasion, and the top and bottom crossbeams bend symmetrically in 3-point bending about the point of load application. By making the structure of 1in thick aluminum plates, the structure became highly rigid. The bending of the top plate under maximum load was shown in finite element simulations to be limited to 10µm, and the bending occurs in such a way that objects situated in the center of the top crossbar are essentially translated upward but not deformed (a simple obstacle to overcome, merely by utilizing closed-loop force control).
This stiction-free actuator, combined with the extremely low friction air bushing and elastic guide flexure, produces smooth and perfectly controllable linear motion. The degree of repeatability of this motion is believed to be on the level of only a few microns, as no variation was measurable using a dial gauge resolving down to 6µm.
4.2.3
Precision Substrate Registration
The other key area necessitating mechanical design innovation was in the placement of unformed blank substrates onto the platen. In previous generations of hardware, a 3-point kinematic alignment system was demonstrated to allow repeatable placement to 25µm when combined with an industrial pick-and-place robotic arm [15]. A pair of small tabs separate from the pins applies a downward force on formed substrates during demolding. This system was carried over to the new generation of hardware, in the form of dowel pins potted into CNC machined bores in the lower platen, and appears in Figure 4-7.
In addition, due to the fact that the blank substrates have pre-existing inlet ports, a need to be able to accurately register the blank substrates with existing tool features existed. To this end, a planar flexure allowing translational motion in X and Y as well as rotational motion about the normal Z axis was designed. Due to strong coupling between each axis, this flexure serves best as a manual as-needed calibration element, and the six thumb screws included allow its planar position to be fixed in place once the proper location is determined. The planar flexure backs against a precision flat plate and transfers load to it and thus to the machine structure, allowing it to withstand the full range of forming loads. A diagram of the flexure explaining its
![Figure 2-1: Ideal Forming Cycle for Hot Embossing: This diagram indicates typical levels of force and temperature (the selected input parameters) during a forming cycle for PMMA substrates [18].](https://thumb-eu.123doks.com/thumbv2/123doknet/14732770.573417/32.918.183.733.122.417/figure-forming-embossing-indicates-temperature-selected-parameters-substrates.webp)