Eur J Clin Microbiol Infect Dis (2005) 24: 733–738 DOI 10.1007/s10096-005-0044-4
A RT I C L E
H. H. Hirsch . H. Drechsler . A. Holbro . F. Hamy . P. Sendi . K. Petrovic . T. Klimkait . M. Battegay
Genotypic and phenotypic resistance testing
of HIV-1 in routine clinical care
Published online: 23 November 2005
# Springer-Verlag 2005
Abstract Data on genotypic and phenotypic resistance testing of HIV-1 in the routine clinical setting are lacking. In a retrospective single-center study, all patients (n=102) for whom genotypic resistance typing (GRT) and pheno-typic resistance typing (PRT) were performed during the calendar year 2002 were examined. GRT and PRT results were concordant for 79% of the drugs, being highest for nevirapine (92%) and lowest for didanosine (57%). Con-cordance of results for protease inhibitors was lowest for lopinavir (78%) and highest for indinavir (88%). Discor-dant results for lamivudine were observed in 16% of patients; 90% of these results corresponded to high-level resistance by PRT and susceptibility by GRT. Overall, HIV loads were lower and CD4+ cell counts higher after ther-apy following resistance testing, but a significant associ-ation with the number of active drugs as predicted by GRT or PRT could not be identified. In a subgroup of 43 patients with virological failure under antiretroviral therapy and sufficient follow-up data, HIV loads were significantly lower after 3 and 6 months. More patients with HIV loads <400/ml had 2 or more active drugs according to PRT (21/29 [75%]) than according to GRT (15/29 [52%]; p=0.109). This was also found for HIV loads <50/ml (PRT 16/22 [72%], GRT 10/22 [42%]; p=0.103), although the differences were not statistically significant. There was no
discernable difference between GRT and PRT in the clinic-based population, but the numbers of resistance tests per-formed are not sufficient to draw definitive conclusions.
Introduction
Current guidelines recommend testing for HIV drug resis-tance in HIV-infected patients requiring salvage regimens, in newly HIV-infected individuals, and in HIV-infected preg-nant women [1, 2]. These recommendations are based largely on studies from research settings, and thus their sig-nificance for the routine clinical situation is unknown. Several studies, including GART/CPCRA 046 [3], VIR-ADAPT [4], HAVANA [5], and ARGENTA [6], have suggested that antiretroviral therapy (ART) guided by genotypic resistance testing (GRT) with or without expert advice may improve virological outcome and, possibly, immunological reconstitution. In some studies, this was cor-related with a higher number of active drugs prescribed and was most consistently demonstrable after 12 or 24 weeks of therapy. In the NARVAL [7] and the VIRA3001 studies [8], phenotypic resistance testing (PRT) was not associated with a significantly higher rate of HIV-1 suppression. A recent study suggests that GRT followed by database interpretation (virtual phenotype) correlated with a more pronounced reduction in HIV load than PRT [9]. Longer-lasting efficacy has not been investigated or was difficult to demonstrate due to the increasing impact of confounding factors not related to resistance testing, such as patient adherence to the treatment regimen, drug tolerability, and comorbidities. More re-cently, the CERT study randomized patients to routine PRT, GRT, or“no testing” and found no significant impact on the long-term virological outcome, but patient compli-ance was not assessed [10]. In a subgroup of patients with more than three prior ART regimens, routine PRT, but not GRT, was associated with a more favorable response. In the subgroup of non-nucleoside reverse transcriptase inhibitor (NNRTI)-experienced patients, both PRT and GRT had a significant impact compared to“no testing” [10]. To better understand the role of resistance testing in the routine clinical H. H. Hirsch . H. Drechsler . A. Holbro .
P. Sendi . M. Battegay (*)
Division of Infectious Diseases & Hospital Epidemiology, Department of Internal Medicine, University Hospital Basel, Petersgraben 4,
4031, Basel, Switzerland e-mail: [email protected]
H. H. Hirsch . A. Holbro . T. Klimkait
Institute for Medical Microbiology, University of Basel, Petersplatz 10,
4003, Basel, Switzerland
F. Hamy . K. Petrovic . T. Klimkait Inpheno AG, Basel,
Vesalgasse 1,
situation, we investigated all patients for whom GRT and PRT were performed during the calendar year 2002 to determine the level of concordance of GRT and PRT results as well as the virological outcome of HIV infection.
Patients and methods
The HIV-1 outpatient clinic Basel served 543 HIV-1-infected individuals at the time of study. During the calendar year 2002, GRT and PRT were ordered for 102 patients by the treating physicians as part of the routine management. Of note, tenofovir had been used in Basel only since late 2002, while efavirenz and lopinavir/ritonavir had been introduced into the routine more than a year previously, suggesting no potentially confounding factor of treatment response. ART was prescribed to 86 (84%) patients within 6 months after resistance testing, eight of whom were treatment naive. Of 78 ART-experienced patients, 61 (60%) had complete PRT and GRT for both reverse transcriptase and protease. Of these 61 patients, 18 were excluded from further analysis due to various reasons that included plasma viral load below 1,000 copies/ml (n=2), missing follow-up data (n=6), or a new regimen that included tenofovir or atazanavir (n=10), leaving 43 patients for further analysis.
Routine GRT was based on the identification of mu-tations and polymorphisms by cycle sequencing of the HIV-1 reverse transcriptase and protease genes and their interpretation according to the algorithm of the Stanford University Database (http://hivdb.stanford.edu). For the purpose of this study, the GRT results were grouped as follows:“susceptible” and “potential low-level resistance” as susceptible; “low-level resistance” and “intermediate resistance” as intermediate; and “high-level resistance” as resistant [11,12]. PRT was performed using a commercial assay (PhenoTect; InPheno, Basel, Switzerland) that de-termined resistance factor RF50 from the ratio of inhibitory drug concentrations IC50 of the patient-derived reverse transcriptase- or protease-recombinant virus relative to the IC50 of a wild-type reference strain pNL4-3 [13,14]. The RF50 was interpreted as sensitive, intermediate, or resistant relative to drug-specific biological cutoff values.
Concordance of GRT and PRT was scored if the same result was obtained in both assays. Complete discordance of GRT and PRT was defined as a result of“susceptible” in one assay and a result of “resistant” in the other assay. Partial discordance was defined as a result of “intermedi-ate-level resistance” in one test, and a result of “suscep-tible” or “high-level resistance” in the other test. Active drugs were defined as principally effective as demonstrated in GRT and/or PRT. Statistical analysis was performed using S-Plus 2000 software (Insightful Corporation, Seattle, WA, USA). Descriptive statistics were comple-mented with measures of association. In a linear regression model, we assessed the association of individual factors, with a change in viral load defined as the difference in viral load between the baseline measurement and the minimal value during the follow-up period. A p value of <0.05 was considered significant.
Results
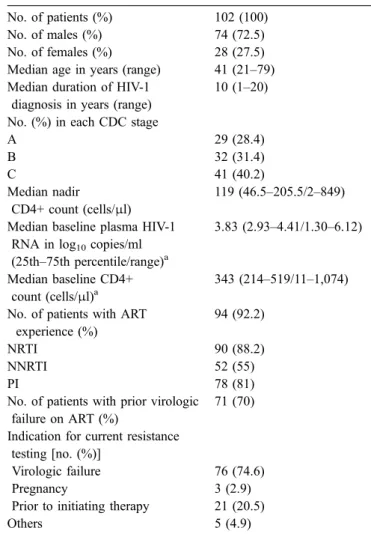
During the calendar year 2002, resistance testing was ordered for 102 of 543 (19%) HIV-infected patients in our center. The patient demographics are summarized in Table 1. Prior AIDS-defining events had been diagnosed in 40% of the patients. The indication for the resistance testing was virological failure in 76 (75%) patients. Twenty-one (20.5%) patients were off treatment at the time of the present resistance testing. Prior virological failure was known for 71 (70%) patients, but 92% had a history of prior exposure to antiretroviral agents, including zidovudine in 78%, stavudine in 71%, lamivudine in 91%, and didanosine in 44%. Prior NNRTI exposure was known in 55% of patients (efavirenz in 30%, nevirapine in 31%). Prior exposure to proteinase inhibitors was noted in 81%, including nelfinavir in 69%, indinavir in 46%, and lopinavir/ritonavir in 21%. In the remaining patients, nucleotide reverse transcriptase inhibitors (NRTIs) were prescribed in 78% (zidovudine in 32%, stavudine in 30%, lamivudine in 56%, didanosine in 20%), NNRTIs in 43%
Table 1 Characteristics of the patients included in the study No. of patients (%) 102 (100)
No. of males (%) 74 (72.5) No. of females (%) 28 (27.5) Median age in years (range) 41 (21–79) Median duration of HIV-1
diagnosis in years (range)
10 (1–20) No. (%) in each CDC stage
A 29 (28.4) B 32 (31.4) C 41 (40.2) Median nadir CD4+ count (cells/μl) 119 (46.5–205.5/2–849) Median baseline plasma HIV-1
RNA in log10copies/ml
(25th–75th percentile/range)a
3.83 (2.93–4.41/1.30–6.12) Median baseline CD4+
count (cells/μl)a
343 (214–519/11–1,074) No. of patients with ART
experience (%)
94 (92.2)
NRTI 90 (88.2)
NNRTI 52 (55)
PI 78 (81)
No. of patients with prior virologic failure on ART (%)
71 (70) Indication for current resistance
testing [no. (%)]
Virologic failure 76 (74.6)
Pregnancy 3 (2.9)
Prior to initiating therapy 21 (20.5)
Others 5 (4.9)
ART antiretroviral therapy, NRTI nucleoside analogue reverse transcriptase inhibitor, NNRTI non-nucleoside analogue reverse transcriptase inhibitor, PI protease inhibitor
a
(efavirenz in 22%, nevirapine in 21%), and proteinase inhibitors in 47% (nelfinavir in 21%, indinavir in 2%, lopinavir in 18%).
According to the results of GRT, the most frequently identified high-level resistance mutations in the reverse transcriptase were those causing resistance to lamivudine (with M184V identified in 39%), followed by those causing resistance to nevirapine (37%), efavirenz (30%, with K103N identified in 26%), abacavir (17%), and zidovudine (14%, with M41L identified in 20% and T215Y/F in 21%). Multidrug resistance associated with mutations Q151M and K65R amounted to less than 2%. The most frequent high-level protease resistance identified by GRT affected the efficacy of nelfinavir (22%) and indinavir (13%), but rarely that of lopinavir (2%). A multitude of mutations were observed, including L90M (16%), D30N (7%), I84V (6%),
and I54V (4%). PRT identified high-level resistance in the reverse transcriptase, most frequently for lamivudine (52%), nevirapine (41%), and efavirenz (38%), followed by abacavir (16%) and zidovudine (14%). High-level resistance to proteinase inhibitors as detected by PRT mostly affected the efficacy of nelfinavir (26%), indinavir (15%), saquinavir (14%), and lopinavir (12%). No resistance was identified by GRT or PRT in ten ART-naïve patients.
For 93 of the 102 patients, GRT and PRT results were available for HIV reverse transcriptase or protease. Overall, complete concordance between GRT and PRT was observed in 79% of the patients, partial discordance in 18%, and complete discordance in 3%, but drug-specific differences were found (Fig.1). Concordance of results was highest for NNRTIs (92%), followed by lamivudine (84%), and was lowest for didanosine (57%) and zalcitabine (63%) (Fig.1).
0 10 20 30 40 50 60 70 80 90 100
ABC AZT DDC DDI D4T 3TC EFV NVP APV IDV LPV NFV RTV SQV Antiretroviral drugs
Number of isolates
Concordance Partial discordance Discordance
Fig. 1 Concordance between results of genotypic and pheno-typic resistance testing. Concor-dance (green) of genotypic and phenotypic resistance testing was present if the same result was obtained in both assays. Complete discordance (red) of GRT and PRT was defined as a result of“susceptible” in one assay, and a result of“high-level resistance” in the other assay. Partial discordance (orange) was defined as a result of “in-termediate-level resistance” in one test, and a result of “sus-ceptible” or “high-level resis-tance” in the other test (ABC abacavir, AZT zidovudine, DDC zacitabine, DDI didanosine, D4T stavudine, 3TC lamivudine, EFV efavirenz, NVP nevirapine, APV amprenavir, IDV indinavir, LPV lopinavir, NFV nelfinavir, RTV ritonvair, SQV saquinavir) -13 -9 -6 -3 0 3 6 11 13 16 19 22 26 30 28 33 33 43 39 38 31 25 18 19 13 14 0 1 2 3 4 5 6
Viral load (log copies/ml)
months n Fig. 2 HIV load before and
after antiretroviral resistance testing. Months denote the average time before and after resistance testing for the corre-sponding measurement (day 0=baseline date); gray bounds around the median indicate the corresponding 95% CI, the hor-izontal line indicates the lower bound of the 95%CI of the median log plasma RNA at baseline, and dots indicate outliers
Partial and complete discordance was most frequently observed for didanosine (36% and 8%) and zalcitabine (34% and 8%) (Fig.1). Partial and complete discordance was also remarkable for lamivudine (7% and 9%, respectively). High-level resistance to lamivudine was detected in all but one of these discordant cases by PRT, whereas GRT in-dicated susceptibility. Complete discordance was observed less frequently for protease inhibitors (Fig. 1). No case of complete discordance was observed for lopinavir, but partial concordance was frequent. In 15 of 19 cases, intermediate resistance to lopinavir was suggested by GRT, while PRT indicated resistance and susceptibilty in seven and eight cases, respectively.
To investigate the impact of resistance testing on the subsequent therapeutic response, HIV viral loads and CD4+ cell counts were studied in 43 patients with virological
failure under ART and sufficient follow-up of 3–24 months. The change in viral load and CD4+ cell count over time is shown in Fig. 2and Fig. 3. The gray bounds around the median in each boxplot indicate the 95% confidence interval (CI) of the respective medians. The horizontal lines in Figs.2
and3indicate the lower and upper bounds of the 95%CI for the median baseline viral load and the CD4+ cell count, respectively. There was a significant decrease in median viral load after baseline at all periods. Viral plasma RNA could be reduced by 1.47 (95%CI, 0.47–2.47) log copies/ml on average. In Fig.4, the change in CD4+ cell counts and HIV loads after resistance testing is shown. More patients with HIV loads <400/ml or <50/ml had two or more active drugs according to PRT than according to GRT (21/29 [75%] and 15/29 [52%], respectively; p=0.109, or 16/22 [72%] and 10/22 [42%], respectively; p=0.103). However, this
differ--11 -9 -6 -3 0 3 6 9 13 16 19 22 26 27 27 32 29 41 36 37 29 24 19 17 11 12 0 200 400 600 800 1000 1200
CD4 cell count (cells/mm
3 )
months n Fig. 3 CD4+ cell count before
and after antiretroviral resistance testing. Months denotes the average days before and after resistance testing for the corre-sponding measuremement (day 0=baseline date); gray bounds around the median indicate the corresponding 95%CI, the hor-izontal line indicates the upper bound of the 95%CI of the median CD4+ cell count at baseline, and dots indicate outliers -6 -4 -2 0 2 4 6 -200 0 200 400
Increase in CD4 cell count
Change in log RNA Fig. 4 Change in HIV load and
CD4+ cell counts after resis-tance testing
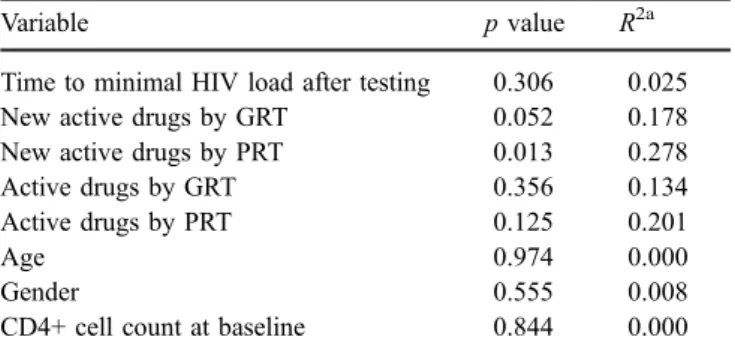
ence was not statistically significant. The results of the univariate regression showed that the number of new active antiretroviral drugs according to PRT or GRT was associated with a reduction in viral load, but the results reached statistical significance only for PRT. This analysis showed that, for example, new active drugs as measured by PRT accounted for close to 28% of the reduction in viral load (Table2). The CD4+ cell count increased by an average of 146 cells/mm3(95%CI, 104–188), which was more obvious in the first 3–6 months after resistance testing but did not reach statistical significance. No association between any predictor and an increase in CD4+ cell count could be found.
Discussion
In this retrospective single-center study, the prevalence of HIV drug resistance and the concordance of GRT and PRT results were investigated in 102 patients for whom GRT and PRT were performed as part of routine clinical care during the calendar year 2002. The main indication for resistance testing was ART failure (75% of the tests prescribed). The demographics of these patients indicate a long-standing history of HIV infection and considerable ART experience with prior treatment failures, hence re-presenting complex salvage situations that pose a major challenge for HIV care with regard to morbidity, mortality, and toxicity. Our data indicate a high rate of overall concordance of 79% between the results of GRT and PRT, whereas rates of partial and complete discordance were 18% and 3%, respectively. Although the number of patients in this study is small, more than 1,200 pairs of GRT/PRT results for the individual drugs were analyzed; thus, more than 200 partially discrepant results and more than 30 completely discrepant results were obtained.
Discrepant results were observed more frequently for NRTIs, particularly didanosine and zalcitabine. This is not unexpected, given the complex multistep development of resistance to these drugs and the ensuing methodological limitations of identifying biological, clinical, and penalty thresholds that are used to report susceptible, intermediate, and resistant viral mutants. It is interesting to note that complete discordance for didanosine and zalcitabine
re-sulted mostly from GRT results indicating resistance, but PRT results indicating susceptibility (11 of 12 cases; Fig.1). Similar methodological and biological limitations may apply to the detection and reporting of resistance to protease inhibitors, but mostly partial discordance was noted. For lopinavir, resistance may be particularly difficult to predict by GRT given the stepwise accumulation of more than six mutations. In the present study, partial discordance of results for lopinavir involved intermediate resistance detected by GRT in 15 of 18 cases, half of which were scored as resistant by PRT, while the other half was scored as susceptible by PRT. In contrast, concordance was highest for NNRTI resistance, as this was caused mostly by the point mutation K103N in GRT, which correlated well with high-level resistance in PRT. By the same token, the high number of discordant results for lamivudine is remarkable, since detection of M184V clearly indicates high-level re-sistance. Of note, complete discordance for lamivudine was due to GRT results being scored as susceptible in seven of eight cases with documented exposure, while PRT results were scored as resistant. Given the known impairment of the viral replication rate by the M184V mutation, a possible explanation for this discordance could be that the higher sensitivity of PRT allowed detection of minority popula-tions of <30% in mixtures of virus populapopula-tions that are known to escape routine detection by GRT.
As concordance of both assays was fairly high, the question arises whether partial and complete discordance might impact HIV surrogate markers in a clinical setting. As a first step, we examined the course of the HIV load and the CD4+ cell count in 43 ART-experienced patients for whom sufficient follow-up data were available. The data in Figs.2and3suggest that the treatment administered after the resistance testing did show some benefit with regard to the overall HIV load and CD4+ cell count. In this subgroup of 43 patients, suppression of HIV loads of up to <400 and <50 copies per milliliter were observed more often in patients treated with two or more active drugs as defined by PRT than by GRT, but this difference did not reach statistical significance (p=0.109). A more detailed analysis suggested that a reduction in viral load was significantly greater among patients who were switched to a regimen of active drugs as defined by PRT (p=0.013), which was not observed to the same extent for new active drugs as defined by GRT (p=0.052). Overall, the differences between GRT and PRT are marginal and illustrate the limitations of resistance studies in the clinical setting. Furthermore, the decrease in HIV load did not translate into a statistically significant increase in the CD4+ cell counts within the observation period. A limitation of this study is that re-sistance testing was investigated in diverse clinical settings as seen in routine outpatient care. On the other hand, this allowed us to assess concordance between the two resis-tance tests in the entire population.
Although the small number of patients and the retro-spective character of this study clearly limit the conclusions, we believe that the role of GRT and PRT in the clinical routine situation warrants further study. The recently pub-lished CERT study reported a significant benefit in the long-Table 2 Univariate analysis of factors associated with a change in
viral load
Variable p value R2a
Time to minimal HIV load after testing 0.306 0.025 New active drugs by GRT 0.052 0.178 New active drugs by PRT 0.013 0.278 Active drugs by GRT 0.356 0.134 Active drugs by PRT 0.125 0.201
Age 0.974 0.000
Gender 0.555 0.008
CD4+ cell count at baseline 0.844 0.000
a
Indicates the percentage of variability of the response variable (change in log viral load) explained by the respective predictor
term efficacy of PRT over GRT or “no testing” in patients with a history of more than three ART regimens [10]. Like the high rates of concordance between GRT and PRT for NNRTIs observed in our study, these authors observed that both GRT and PRT were more likely to provide a durable response to therapy than“no testing” in NNRTI-experienced patients [10]. Despite the potential role of resistance testing for choosing efficacious salvage regimens, it is clear that the careful examination and interpretation of the individual treatment history is still required, since neither GRT nor PRT efficiently detects latent resistant strains archived during previous treatment failures.
Acknowledgements The work of F. H. was supported by grant 3339-065514 from Swiss National Science Foundation.
References
1. EuroGuidelines Group for HIV Resistance (2001) Clinical and laboratory guidelines for the use of HIV-1 drug resistance testing as part of treatment management: recommendations for the European setting. AIDS 15:309–320
2. Hirsch MS, Brun-Vezinet F, Clotet B et al (2003) Antiretroviral drug resistance testing in adults infected with human immuno-deficiency virus type 1: 2003 recommendations of an interna-tional AIDS society-USA panel. Clin Infect Dis 37:113–128 3. Baxter JD, Mayers DL, Wentworth DN et al (2000) A randomized
study of antiretroviral management based on plasma genotypic antiretroviral resistance testing in patients failing therapy. CPCRA 046 study team for the Terry Beirn community programs for clinical research on AIDS. AIDS 14:F83–F93
4. Durant J, Clevenbergh P, Halfon P et al (1999) Drug-resistance genotyping in HIV-1 therapy: the VIRADAPT randomised controlled trial. Lancet 353:2195–2199
5. Tural C, Ruiz L, Holtzer C et al (2002) Clinical utility of HIV-1 genotyping and expert advice: the Havana trial. AIDS 16:209– 218
6. Cingolani A, Antinori A, Rizzo MG et al (2002) Usefulness of monitoring HIV drug resistance and adherence in individuals failing highly active antiretroviral therapy: a randomized study (ARGENTA). AIDS 16:369–379
7. Meynard JL, Vray M, Morand-Joubert L et al (2002) Phenotypic or genotypic resistance testing for choosing antiretroviral therapy after treatment failure: a randomized trial. AIDS 16:727–736 8. Cohen CJ, Hunt S, Sension M et al (2002) A randomized trial
assessing the impact of phenotypic resistance testing on antiretroviral therapy. AIDS 16:579–588
9. Perez-Elias MJ, Garcia-Arota I, Munoz V et al (2003) Pheno-type or virtual phenoPheno-type for choosing antiretroviral therapy after failure: a prospective, randomized study. Antivir Ther 8:577–584
10. Wegner SA, Wallace MR, Aronson NE et al (2004) Long-term efficacy of routine access to antiretroviral-resistance testing in HIV type 1-infected patients: results of the clinical efficacy of resistance testing trial. Clin Infect Dis 38:723–730
11. Kijak GH, Rubio AE, Pampuro SE et al (2003) Discrepant results in the interpretation of HIV-1 drug-resistance genotypic data among widely used algorithms. HIV Med 4:72–78 12. Ravela J, Betts BJ, Brun-Vezinet F et al (2003) HIV-1 protease
and reverse transcriptase mutation patterns responsible for discordances between genotypic drug resistance interpretation algorithms. J Acquir Immune Defic Syndr 33:8–14
13. Marki Y, Kaufmann GR, Battegay M, Klimkait T (2002) Impact of protease polymorphisms and viral fitness on human immunodeficiency virus (HIV) type 1 viremia in untreated HIV-1 infection. J Infect Dis 185:1844–1846
14. Klimkait T (2002) A sensitive replicative system to assess HIV-1 drug resistance. Am Clin Lab 2HIV-1:20–24