O R I G I N A L A R T I C L E
Chung-Yol Lee Æ Renato Kratter Æ Nicole Duvoisin Aydin Taskin Æ Julian Schilling
Cross-sectional view of factors associated with back pain
Received: 27 October 2003 / Accepted: 12 November 2004 / Published online: 21 April 2005 Ó Springer-Verlag 2005
Abstract Objective: To examine the factors associated with back pain within a working population. Methods: A cross-sectional survey of employees using a self-administered questionnaire and physical fitness tests. This study assessed 10,321 participants (6,251 male and 4,070 female) of two nationwide companies throughout Switzerland between 1996 and 1998. The participation rate was 41%. Results: Of the partici-pants, 4,945 (48%) suffered mild back pain and 696 (7%) suffered severe back pain. Reported ‘‘stress’’ was associated with back pain of any intensity. Abdominal muscle strength was inversely associated with severe back pain, while physical activity was non-linearly associated with severe back pain. Smoking was directly associated with any intensity of back pain. The vari-ables gender, obesity, strength of the abdominal mus-culature and frequency of physical activity were insignificant for back pain of any intensity in multi-variate analyses. Conclusion: Our results confirm the association of back pain with physical and behavioural factors. The non-linear relationship between physical activity and back pain may need further examination. Performing any kind of sport three to four times a week appears optimal.
Keywords Back pain Æ Employees Æ Health
promotion Æ Abdominal musculature Æ Physical activity
Introduction
Back pain is one of the most common and costly problems of modern society (van Tulder et al. 2000b). In 1995, costs of US $8.8 billion for the USA were estimated (Murphy and Volinn 1999). It was also shown that a relatively small number of back patients (10%) were responsible for 80% of the total back pain costs (Rothenbu¨hler 1997). In 1996, over 5,000 cases of back pain were registered in Japan, accounting for 60% of the total number of officially recognised cases of occupational diseases (Yamamoto 1997). Back pain affects 65% of the population in Switzerland annually (Jeanneret et al. 1998). All ages are affected, but the burden generally begins between the ages of 20– 40 years, with a prevalence peak between 45 and 60 years with a slight difference between the sexes (Jayson
1996).
Psychosocial risk factors, such as stress, employ-ment dissatisfaction, physical and family problems, a poor self-assessment of one’s condition of health, low level of education, poor occupational qualifications and too little physical activity, may play a role in the chronification of acute back pain (Keel et al. 1995; La¨ubli et al. 1995; Burdorf and Sorock 1997; Roth-enbu¨hler 1997; Yamamoto 1997; Jeanneret et al. 1998; Murphy and Volinn 1999; Thomas et al. 1999; Hell-sing and Bryngelsson 2000; van Tulder et al. 2000a; Power et al. 2001). Further unspecific, personality-dependent factors are held responsible for the unfa-vourable progression of pain (La¨ubli et al. 1995; Vi-scher et al. 1995; Jeanneret et al. 1998). These examples may illustrate that a large number of studies and reviews have focussed on a variety of relationships concerning low back pain. However, the factors lead-ing to the complex burden of disease remain unclear to some extent. Therefore, a cross-sectional approach with working people may add additional data from individuals into the present debate.
C.-Y. Lee Æ N. Duvoisin Æ A. Taskin Æ J. Schilling (&) Institute of Social and Preventive Medicine,
University of Zurich, Sumatrastrasse 30, 8006 Zurich, Switzerland E-mail: [email protected] Tel.: +41-1-6348590 Fax: +41-1-6348598 R. Kratter Orthopaedic Surgery,
Lachen Hospital, Lachen, Switzerland DOI 10.1007/s00420-004-0589-z
Methods
Data collection was carried out on behalf of the Check Bus Project, a health promotion programme offered to 25,234 employees of two large Swiss enterprises with different health tests on a voluntary basis, from August 1996 until August 1998, free of charge (Schilling et al.
2001). Those expressing interest received a standardised questionnaire with 59 multiple-choice questions on their general constitution, physical problems and work envi-ronment.
Among others, all participants were asked to report on their physical activity, smoking habits and personal conditions.
Participants were asked whether they performed physical activity in their leisure time at least once a week and on how many days a week (running, cycling, aero-bics, etc.). The number of days (one to seven times per week) was taken as an indicator for physical activity.
Individual behaviour for tobacco consumption was ascertained on the basis of the following three questions: if they smoked, what (cigarettes, cigars, small cigars, pipe) and how much they smoked on average per day and if they had ever regularly smoked for more than 6 months. Three categories were formed: smoker, ex-smoker (participants who had regularly smoked for a 6-month duration) and non-smoker (participants who did not smoke and had also never smoked for longer than 6 months).
Six stress questions comprised: overtime, conflict between occupation and private life, job security, working under time pressure, tension with co-workers and tension with superiors. These stress questions were represented by a sum-score on a Likert-scale: daily (1), several times a week (2), once a week (3), at least once a month (4), occasionally (5), and never (6).
Participants were asked whether, in the previous 4 weeks, they had suffered from back pain explicitly not at all, a little or severely.
Among others, a so-called fitness test was carried out under the supervision of doctors and nurses who visited the various branches of both companies (Schilling et al.
2001). Body weight and height were measured. For par-ticipants under 40 years of age, a fitness test was recom-mended prior to participation according to a standard protocol previously published (Berry 1997). All partici-pants could take part if they chose. The sum variable of the fitness tests comprised the individual components endurance, flexibility, upper body strength and abdomi-nal musculature, and was compared with the normal range of the health population for those age groups.
In the endurance test the pulse was measured 5 s after the subject had climbed up and down a 30-cm-high step for 3 min at a constant speed for 60 s.
Flexibility of the hip extensors and inflection of the lumbar vertebrae were examined by the participants’ sitting barefoot, legs outstretched on the floor, with the soles of their feet pressed against a box. They stretched
their upper bodies and arms forward as far as possible, and the distance between the fingertips and the box was measured.
As an indicator for the measurement of upper body strength, men performed press-ups with the body straight from toes to shoulders, women from knees to shoulder as often as possible for a 1-min period. The test was stopped if they paused for more than 3 s. The total number of press-ups was counted.
The strength of the abdominal musculature was measured by the participants’ lying on their backs, knees bent to a 90° angle and feet flat on the floor, with their hands behind their necks. The examiner held the par-ticipants‘ feet firmly on the ground. Participants had to raise their upper body towards the knees as often as possible for a 1 min period. The test was stopped if there was a pause of more than 3 s. The total number of sit-ups was counted. The sum variable of those four fitness tests was compared with that of normal population levels (Berry 1997). Further details are published else-where (Schilling et al.2001).
The chi-square test, t-test and ANOVA were used for bivariate analyses. Significant variables in bivariate analyses (two-tailed P< 0.01) were used to model the logistic regression analyses (two-tailed significance level at P< 0.05) separately for back pain of any intensity and for severe back pain, respectively. SPSS for win-dows version 9.0 was used for statistical analyses.
Results
Participants
A total of 10,321 persons participated in the Check Bus project available to all 23,243 employees from all hier-archic levels within two nationwide companies. Of the participants, 6,251 were male (61%), mean age 39.9±10.8 years and 4,070 were female (39%), mean age 37.9±11.3 years.
Back pain
Of the participants, 4,680 (45%) had not suffered at all from back pain in the previous 4 weeks, 4,945 (48%) reported having had mild back pain and 696 (7%) re-ported having suffered from severe back pain. The severe back pain group comprised 340 women (8%) and 356 men (6%). The percentage of men in the group with severe pain was statistically significantly higher: 51% compared with 49% of women (v2=27.71, P< 0.001).
Back pain and age
Age-group distribution of the 9,625 participants with no or minor complaints was significantly different from that
of the 696 participants with severe back pain (v2=20.09, P< 0.001). In this group the highest proportion (9.5%) was found in the over 55-year olds. No significant dif-ference between the age groups and gender with back pain, and those without, was found (Pearson v2=3.67, P=0.45).
Body mass index
Body mass index (BMI) was known for 10,306 partici-pants, of whom 6,514 participants (63%) had a normal weight with a BMI between 19 kg/m2 and 25 kg/m2. According to the generally accepted definitions of obesity (BMI >30 kg/m2), 513 (5%) participants were obese (309 men, 5%; 204 women, 5%); 2,710 (26%) were overweight (BMI 25–30 kg/m2) (2,102 men, 34%; 608 women, 15%) (v2=443.4, P<0.001), and 569 (6%) participants were underweight, with a BMI <19 kg/m2 (104 men, 2%; 465 women, 12%) (v2=451.7, P<0.001). No association between BMI and back pain was found when all categories were considered (v2=3.14, P=0.37).
Physical activity
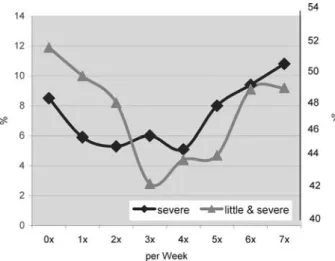
Two-thirds of the participants performed sport in their leisure time at least once a week [e.g. power walking, running, cycling; 6,897 (67.4%)]. Within this group, 76% were active once or twice a week. Frequency of physical activity per week during leisure time stood in a significant but non-linear relationship to back pain. No or little activity (none to two times a week), but also intensive physical activity (six to seven times a week), was associated with back pain. However, moderate activity (three to four times a week) was associated with less back pain (v2=30.86, P<0.001). A similar re-lationship was found for intense back pain and physical activity (v2=31.78, P<0.001) (Fig.1).
Fitness
A total of 4,694 (46%) participants chose the fitness test; 4,495 (85%) were under 40 years old. Endurance and strength were inversely associated (endurance and upper body strength r= 0.30, P<0.001; endurance and ab-dominal strength r= 0.37, P<0.001). Participants with higher endurance tended to have less strength in the upper body and abdominal musculature. Participants with more flexibility in the lumbar spine had a stronger upper body (r=0.18, P<0.001). Obese participants (BMI >30 kg/m2) fared significantly worse in flexibility, strength of the upper body and abdominal musculature (t-test flexibility P=0.05; upper body strength P<0.001; abdominal strength P<0.001).
The sum variable of the fitness tests from the indi-vidual components: endurance, flexibility, upper body
strength and strength of the abdominal musculature was associated with back pain of any intensity (t=3.06, P=0.002) but not with severe back pain alone (t=1.22, P=0.222). A statistically significant association between endurance and the appearance of back pain could not be found, either by comparing back pain independent of the intensity (t = 1.53, p = 0.127) or by comparing severe back pain (t=0.06, P=0.951). Flexibility showed a statistically significant correlation with severe back pain compared with the status ‘‘without’’ or ‘‘minor’’ back pain (t=3.36, P=0.001), but no association was found for back pain independent of intensity (t=0.33, P=0.743).
For upper body strength a significant difference was found between participants with back pain of any intensity, or severe back pain, and those with no com-plaints, (t=2.19, P=0.029 for any intensity; t=3.52, P<0.001 for severe back pain). Abdominal strength also showed a difference between the groups with back pain and those without (t=4.0, P<0.001 for back pain of any intensity; t=2.85, P=0.004 for severe back pain).
Well-being and stress factors
The average sum of the six stress factor questions was 15.99 (SD=5.25); 241 (2%) participants scored the minimum of 6 and three participants the maximum of 36. On average, participants stated to suffer from these stress factors once a month or less. Conflict between occupation and private life, concern about job security and tension between co-workers and superiors was rated as rare, but overtime and working under time pressure was frequent, usually several times per week. Of the participants, 4,472 (43%) worked overtime several times a week or daily, 10% never and 21% less than once a month, giving an average value of 3.7
Fig. 1 The non-linear relationship between the numbers of days per week that participants performed sport during leisure time and back pain. The left-hand Y axis shows the percentage of participants with severe back pain. The right-hand Y axis shows the percentage of participants with little and severe back pain
(SD=1.61). Although 1,600 (16%) participants had problems several times a week or a daily juggling of their private life with their occupation, for the majority (61%) this was never, or less than once a week, a problem. Of the participants, 74% worried less than once a month or never, while 1,032 (10%) worried daily or several times a week about their job security.
Of the participants, 3,541 (34%) reported working under time pressure once or several times per week, but 3,381 (33%) were never, or less than once a month, under time pressure.
Of the participants with no back pain, the average sum of the stress factors was 15.69 points, and for the participants with back pain it was 16.31 points (SD=5.5). The association between back pain and the sum of the stress factors was statistically significant (t=5.99, P<0.001). A statistically significant difference (t=3.51, P<0.001) was found between the participants with severe back pain, who averaged 16.67 points (SD=5.5), and participants with no back pain or with mild back pain, who averaged 15.95 points (SD=5.23).
Smoking
There were 5,179 (50.%) non-smokers, 1,826 (18%) ex-smokers and 3,316 (32%) ex-smokers. Of these, 2,839 (27%) smoked, on average, 15 cigarettes daily
(mini-mum one, maxi(mini-mum 101), 292 (3%) cigar smokers averaged 2.75 cigars daily (1–30), 182 (2%) cigarillo smokers averaged 4.57 cigarillos daily, (1–20) and 201 (2%) pipe smokers averaged 3.10 pipes daily (1–20).
For participants with back pain, independent of intensity, an association with smoking was found (v2=8.94, P=0.011; linear-by-linear v2=8.65, P=0.003). Stress factor scores for smokers, non-smok-ers and ex-smoknon-smok-ers were significantly different (t=1.97, P=0.02).
Multivariate analyses
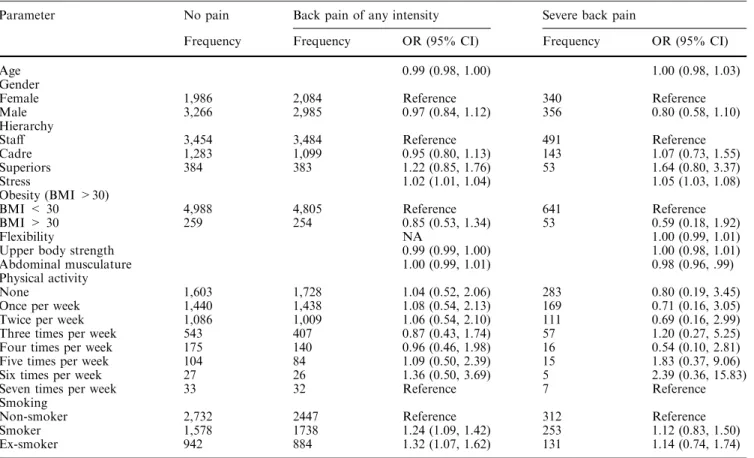
Back pain prevalence of any intensity decreased with increasing age (OR 0.99, 95% CI 0.98–1.00). A weak upper body (OR 0.99, 95% CI 0.99–1.00) and personal stress increased the likelihood of back pain (OR 1.02, 95% CI 1.01–1.04), as did smoking (OR 1.2, 95% CI 1.09–1.42) and ex-smoker status (any intensity: OR 1.32, 95% CI 1.07–1.62). The variables gender, obesity, strength of the abdominal musculature and frequency of physical activity were insignificant (Table1).
The likelihood of intense back pain increased with personal stress (OR 1.05, 95% CI 1.03–1.08) and weak abdominal musculature (OR 0.98, 95% CI 0.96–0.99). The variables gender, age, obesity, physical activity, strength of the upper body and smoking were insignifi-cant.
Table 1 Logistic regression on back pain (any intensity/severe)
Parameter No pain Back pain of any intensity Severe back pain
Frequency Frequency OR (95% CI) Frequency OR (95% CI)
Age 0.99 (0.98, 1.00) 1.00 (0.98, 1.03)
Gender
Female 1,986 2,084 Reference 340 Reference
Male 3,266 2,985 0.97 (0.84, 1.12) 356 0.80 (0.58, 1.10) Hierarchy
Staff 3,454 3,484 Reference 491 Reference
Cadre 1,283 1,099 0.95 (0.80, 1.13) 143 1.07 (0.73, 1.55) Superiors 384 383 1.22 (0.85, 1.76) 53 1.64 (0.80, 3.37)
Stress 1.02 (1.01, 1.04) 1.05 (1.03, 1.08)
Obesity (BMI >30)
BMI < 30 4,988 4,805 Reference 641 Reference BMI > 30 259 254 0.85 (0.53, 1.34) 53 0.59 (0.18, 1.92)
Flexibility NA 1.00 (0.99, 1.01)
Upper body strength 0.99 (0.99, 1.00) 1.00 (0.98, 1.01) Abdominal musculature 1.00 (0.99, 1.01) 0.98 (0.96, .99) Physical activity
None 1,603 1,728 1.04 (0.52, 2.06) 283 0.80 (0.19, 3.45) Once per week 1,440 1,438 1.08 (0.54, 2.13) 169 0.71 (0.16, 3.05) Twice per week 1,086 1,009 1.06 (0.54, 2.10) 111 0.69 (0.16, 2.99) Three times per week 543 407 0.87 (0.43, 1.74) 57 1.20 (0.27, 5.25) Four times per week 175 140 0.96 (0.46, 1.98) 16 0.54 (0.10, 2.81) Five times per week 104 84 1.09 (0.50, 2.39) 15 1.83 (0.37, 9.06) Six times per week 27 26 1.36 (0.50, 3.69) 5 2.39 (0.36, 15.83) Seven times per week 33 32 Reference 7 Reference Smoking
Non-smoker 2,732 2447 Reference 312 Reference Smoker 1,578 1738 1.24 (1.09, 1.42) 253 1.12 (0.83, 1.50) Ex-smoker 942 884 1.32 (1.07, 1.62) 131 1.14 (0.74, 1.74)
Discussion
This cross-sectional survey of 10,321 healthy employees of two large national companies showed that back pain commonly occurred in 55%. The majority of partici-pants (48%) reported only mild pain, but 7% had suf-fered from severe pain in the previous 4 weeks. Of the participants with severe back pain, the highest propor-tion was found in the age group over 55 years. The influence of age, with its characteristic peak between 45 years and 54 years, has been described in other studies (Keel et al.1995). In the logistic regression analysis, the variable ‘‘age’’ was significant for back pain of any intensity but not for severe back pain.
Frequency of physical activity during leisure time in our study stood in a non-linear but significant relationship to back pain. There are strong beliefs that, in general, sport helps to protect against back pain in the long term (Croft et al. 1999). The results suggest that physical activity six to seven times a week may increase the odds for back pain, while moderate phys-ical activity (three to four times per week) may have a preventive effect. However, frequency of physical activity was not an independent predictor of back pain, and the lack of information on duration and intensity of activity per session and week may have biased the results. Nevertheless, the hypothesis that a little sport may contribute to one’s physical well-being but too much may be hazardous and should be limited to four times per week could lead to a very general recom-mendation.
Upper body strength showed a highly significant association with back pain of any intensity. A weaker association was found for participants with severe back pain. Multiple logistic regression analysis showed a sig-nificant association between upper body strength and minor or severe back pain. These findings confirm the common view that a strong upper body and abdominal musculature is associated with a lower likelihood of back pain. Nevertheless, good general health may be associated with a lower prevalence of most somatic disorders and may not be specific for back pain. Muscle strength and physical fitness are probably also associ-ated with back pain (Pope1989), but the endurance test showed no association supporting earlier findings (Wittink et al.2000).
Personal stress was significantly raised in participants with severe back pain as well as in participants with back pain of any severity. However, it is known that working people suffering from back pain may overestimate the influence of their work situation. Nevertheless, logistic regression analysis showed that stress might be a sig-nificant factor for back pain of any severity. Cross-sec-tion study analysis may also confirm, on an individual level, the findings from earlier work: stress and the work environment may play an important role in the genesis and/or perception of back pain (Engel 1970; Schwartz et al. 1974; Radanov1994; Croft et al.1995; Keel et al.
1995; Kopp et al.1995; Oliveri et al.1995; Papageorgiou et al.1997; Thomas et al.1999; Power et al.2001).
Smoking was predictive only of back pain of any intensity but not for severe back pain. Epidemiological literature may anticipate an association of smoking with back pain, but smoking can be viewed only as a weak risk factor and not as the cause of back pain (Leboeuf-Yde1999). A Canadian study of 502 students examined smoking as a risk factor for back pain. Smokers expe-rienced low back pain more than non-smokers (OR 2.4; 95% CI 1.3–6.0) with a dose–response relationship be-tween amount smoked and development of low back pain (Feldman et al.1999). A recent prospective study in a British cohort also confirmed the role of smoking in back pain (Power et al.2001). The present data support these findings.
Study limitations
The participation rate of 41% may be considered low compared with studies specifically tackling back pain with higher participation rates of up to 55%–60% (Pa-pageorgiou et al. 1995; Cassidy et al. 1998). Neverthe-less, for a voluntary health promotion project, carried out by invitation without any pressure for participation, one could consider a participation rate of over 40% as successful. Especially in view of the structural reorga-nisation of the two companies at the time, an over 40% participation rate may even be remarkable.
As there is no information on back pain of non-responders, generalisation for the Swiss working popu-lation may not be possible. On the other hand, cross-sectional studies do not intend to prove causal relations in general.
Information on doctors’ consultations due to back pain, long-term outcomes and the inability to work be-cause of back complaints, was not available. The ques-tionnaire of the Check Bus project did not sensitise possible participants specifically for back pain. There-fore, the prevalence of back pain in the study population may not be overestimated. On the other hand, there is no information on the duration of symptoms for either the responders or the non-responders. It could be as-sumed that an episode of pain during the questioned period of 4 weeks was judged as a minor disability by participants, or the contrary. However, other relevant factors (e.g. high level of personal stress factors, dissat-isfaction with work and so forth) associated with back pain were found. The data confirm the increasing awareness that subjective factors may play an important role and may even be decisive in the chronification of the disease.
In conclusion, back pain remains an important re-search topic for the working population. The results may suggest that persons with intense back pain represent a distinct population associated with physical and behavioural factors. The non-linear relationship be-tween physical activity and back pain needs further
examination, but the performance of sport three to four times a week, but not more, may be anticipated as being optimal.
References
Berry P, et al (1997) FITCHECK (Programmu¨bersicht, fu¨r Win-dows 3.1). Berry Health, St. Moritz
Burdorf A, Sorock G (1997) Positive and negative evidence of risk factors for back disorders. Scand J Work Environ Health 23:243–256
Cassidy JD, Carroll LJ, Cote P (1998) The Saskatchewan health and back pain survey. The prevalence of low back pain and related disability in Saskatchewan adults. Spine 23:1860–1866; (discussion 1867)
Croft PR, Papageorgiou AC, Ferry S, Thomas E, Jayson MI, Sil-man AJ (1995) Psychologic distress and low back pain. Evi-dence from a prospective study in the general population. Spine 20:2731–2737
Croft PR, Papageorgiou AC, Thomas E, MacFarlane GJ, Silman AJ (1999) Short-term physical risk factors for new episodes of low back pain. Prospective evidence from the South Manchester Back Pain Study. Spine 24:1556–1561
Engel GL (1970) Psychisches Verhalten in Gesundheit und Krankheit. Huber, Bern
Feldman DE, Rossignol M, Shrier I, Abenhaim L (1999) Smoking. A risk factor for development of low back pain in adolescents. Spine 24:2492–2496
Hellsing AL, Bryngelsson IL (2000). Predictors of musculoskeletal pain in men: a twenty-year follow-up from examination at enlistment. Spine 25:3080–3086
Jayson MI (1996) ABC of work related disorders. Back pain. BMJ 313:355–358
Jeanneret B, Frey D, Scharen S (1998) [Chronic back pain]. Schweiz Med Wochenschr 128:706–718
Keel P, et al (1995) Multizentrisches Interventionsprojekt zur funktionellen Wiederherstellung von Patienten mit lumbalen Ru¨ckenschmerzen durch ein integriertes, sportmedizinisch ori-entiertes Behandlungsprogramm. In: Keel P, Perini C, Schu¨tz-Petitjean D (eds) Chronifizierung von Ru¨ckenschmerzen: Hin-tergru¨nde, Auswege (Schlussbericht des Nationalen For-schungsprogramms Nr 26B). EULAR, Basel
Kopp HG, et al (1995) Psychosoziale Faktoren in der Chronifi-zierung von Ru¨ckenschmerzen bei Schweizern und italienischen Immigranten. In: Keel P, Perini C, Schu¨tz-Petitjean D (eds) Chronifizierung von Ru¨ckenschmerzen: Hintergru¨nde, Auswe-ge (Schlussbericht des Nationalen Forschungsprogramms Nr 26B). EULAR, Basel
La¨ubli T, et al (1995) Zusammenha¨nge zwischen Beruf, Arbeit-splatz und motorischer Koordination bei lumbalen Ru¨ckenschmerzen sowie sozioo¨konomische Korrelate der Chronifizierung. In: Keel P, Perini C, Schu¨tz-Petitjean D (eds) Chronifizierung von Ru¨ckenschmerzen: Hintergru¨nde, Auswe-ge (Schlussbericht des Nationalen Forschungsprogramms Nr 26B). EULAR, Basel
Leboeuf-Yde C (1999) Smoking and low back pain. A systematic literature review of 41 journal articles reporting 47 epidemio-logic studies. Spine 24:1463–1470
Murphy PL, Volinn E (1999) Is occupational low back pain on the rise?. Spine 24:691–697
Oliveri M, et al (1995) Die Bedeutung von ko¨rperlicher Aktivita¨t und physischer Leistungsfa¨higkeit fu¨r die Pra¨vention und Be-handlung chronischer Ru¨ckenschmerzen. In: Keel P, Perini C, Schu¨tz-Petitjean D (eds) Chronifizierung von Ru¨ckenschmer-zen: Hintergru¨nde, Auswege (Schlussbericht des Nationalen Forschungsprogramms Nr 26B). EULAR, Basel
Papageorgiou AC, Croft PR, Ferry S, Jayson MI, Silman AJ (1995) Estimating the prevalence of low back pain in the general population. Evidence from the South Manchester Back Pain Survey. Spine 20:1889–1894
Papageorgiou AC, MacFarlane GJ, Thomas E, Croft PR, Jayson MI, Silman AJ (1997) Psychosocial factors in the work-place—do they predict new episodes of low back pain? Evidence from the South Manchester Back Pain Study. Spine 22:1137– 1142
Pope MH (1989) Risk indicators in low back pain. Ann Med 21:387–392
Power C, Frank J, Hertzman C, Schierhout G, Li L (2001) Pre-dictors of low back pain onset in a prospective British study. Am J Public Health 91:1671–1678
Radanov BP (1994) [Somatization—problems in the borderland between somatic medicine and psychiatry]. Schweiz Rundsch Med Prax 83:642–646
Rothenbu¨hler B (1997) Chronifizierungsprozesse am Beispiel von Patienten mit Ru¨ckenschmerzen. Suva Rehaklinik Bellikon, p 60
Schilling J, Lee C-Y, Faisst K, Dixon M, von Mu¨hlinen I, Itten E, Gutzwiller F (2001) Methods of the National Check Bus Pro-ject. Soz Praventivmed 46:195–206
Schwartz GI, et al (1974) Facial expression and depression: an electromyographic study. Ann Med Am Psychosom Soc 29–31 Thomas E, Silman AJ, Croft PR, Papageorgiou AC, Jayson MI, MacFarlane GJ (1999) Predicting who develops chronic low back pain in primary care: a prospective study. BMJ 318:1662–1667 van Tulder M, Malmivaara A, Esmail R, et al (2000a) Exercise
therapy for low back pain: a systematic review within the framework of the Cochrane collaboration back review group. Spine 25:2784–2796
van Tulder MW, Malmivaara A, Esmail R, Koes BW (2000b) Exercise therapy for low back pain. Cochrane Database Syst Rev 2
Vischer TL, et al (1995) Einflu¨sse auf Ru¨ckenschmerzen bei Ang-estellten eines Unternehmens mit Evaluation des Effektes einer pra¨ventiven Intervention (Vergleich von zwei Gruppen). In: Keel P, Perini C, Schu¨tz-Petitjean D (eds) Chronifizierung von Ru¨ckenschmerzen: Hintergru¨nde, Auswege (Schlussbericht des Nationalen Forschungsprogramms Nr 26B). EULAR, Basel Wittink H, Hoskins Michel T, Wagner A, Sukiennik A, Rogers W
(2000) Deconditioning in patients with chronic low back pain: fact or fiction?. Spine 25:2221–2228
Yamamoto S (1997) A new trend in the study of low back pain in workplaces. Ind Health 35:173–185