POTENTIAL TUMOUR DOUBLING TIME: DETERMINATION
OF T
potFOR VARIOUS CANINE AND FELINE TUMOURS
U. SCHWYN1, N.E.A. CROMPTON3, H. BLATTMANN3, B. HAUSER2,
B. KLINK1, A. PARVIS1, D. RUSLANDER1AND B. KASER-HOTZ1* 1Veterinary Medicine Department, Radio-Oncology Programme and2Institute of
Veterinary Pathology, University of Zu«rich, Winterthurerstr. 260, CH-8057 Zu«rich;
3Paul Scherrer Institute, CH-5232 Villigen, Switzerland
*Correspondence
ABSTRACT
Schwyn, U., Crompton, N.E.A., Blattmann, H., Hauser, B., Klink, B., Parvis, A., Ruslander, D. and Kaser-Hotz, B., 1998. Potential tumour doubling time: determination of Tpotfor various canine and feline
tumours. Veterinary Research Communications, 22(4), 233^247
Spontaneous tumours in dogs and cats are an excellent model for clinical human research, such as in developing proton conformation radiotherapy for humans. The kinetics of tumour cells can be used e¡ectively to predict prognosis and response to therapy in patients with tumours. Knowledge of the kinetic parameters in these tumours is therefore important. In the present study the kinetic parameters evaluated included the labelling index (LI), relative movement (RM), mitotic index (MI), and potential doubling time (Tpot). These parameters were determined using in vivo labelling with
bromodeoxyur-idine, £ow cytometry and histological preparation. Samples were obtained and evaluated from 72 dogs and 20 cats, presenting as patients in our clinic. Within the groups of epithelial and mesenchymal tumours from dogs and cats, the kinetic parameters LI, RM and MI were compared with Tpot.
Signi¢cant correlations were observed for the comparison Tpotand LI. No correlation was found
between Tpotand RM.
Keywords: bromodeoxyuridine, cat, dog, kinetics, potential doubling time, tumour
Abbreviations: BrdU, bromodeoxyuridine; HBSS, Hank's balanced salt solution; LI, labelling index; MI, mitotic index; RM, relative movement; Tpot, potential doubling time; TS, duration of S phase
INTRODUCTION
Tumours have been described in small-animal medicine for many years and an increase in cancer cases has been observed over the past few years. They form an excellent model for clinical human tumours (Gillette, 1982). The WHO has provided staging criteria for a variety of animal tumours (Owen, 1980), and surgery, radiotherapy and chemotherapy are established cancer therapies in veterinary medicine today. Various imaging techniques, clinical work-up, histopathology and cytology are used during diagnosis, but it is di¤cult to assess the kinetic potential of a growing tumour at a particular time. Remvikos and colleagues (1991) described the importance of cell kinetics as a predictor in clinical tumour diagnostics. Knowing more precisely the speed at which a tumour mass is growing greatly enhances prognosis, and tumour therapy can be chosen on a more appropriate and individual patient basis. Potential
tumour doubling time (Tpot) is the theoretical time predicted for a tumour to double in
cell number. Tpotis an important predictor in radiotherapy because, during standard
treatments intended to kill the tumour cells, any radiotherapeutic procedure may be overridden by rapid growth of the surviving cells in those tumours with a short potential doubling time. This may also be true for some chemotherapeutic agents (Dewhirst et al., 1995). In the method described in this paper, tumour cells are labelled in vivo and the Tpotof the tumour is determined from a single biopsy a few hours later.
Gratzner (1982) and Dolbeare and colleagues (1983) described a novel method of cell analysis utilizing a monoclonal antibody to bromodeoxyuridine (BrdU), which makes it possible to determine accurately the fraction of cells from a given population in a speci¢ed cell-cycle phase. BrdU is an analogue of uridine and is incorporated speci¢cally into DNA in place of thymidine. Only those cells which are synthesizing DNA incorporate BrdU into their DNA, i.e. those cells in the S-phase of the cell cycle. The use of BrdU overcomes problems associated with injecting patients with radio-active substances and taking multiple samples. Begg and colleagues (1985) described a method for estimating the labelling index and the duration of the S-phase from measurements on a single tumour biopsy. These workers used £ow cytometry to determine the fraction of cells from a given population in various phases of the cell cycle. Tpotcan be calculated from a single sample of cells taken several hours after
labelling with BrdU in vivo. When tumour cell kinetics are studied using this method, tumour proliferation rates can be monitored in vivo with a single injection of nontoxic and nonradioactive bromodeoxyuridine, requiring excision of only a single biopsy 4^8 h later, as shown by Begg (1989).
Numerous reports have been published of analyses of human tumours using this method (Mitchell et al., 1983; Kinsella et al., 1984; Dressler et al., 1987; Wilson et al., 1988a,b; Giordano et al., 1991; Rew et al., 1991, 1992; Shimomatsuya et al., 1991; Popert et al., 1993; Remvikos et al., 1991; Cooke et al., 1994), but little documentation about the various animal tumours is available. Carter and colleagues (1993) showed that the use of £ow cytometry is as relevant in veterinary medicine as it is for human medicine. Flow cytometric analysis of BrdU-labelled cells has led to the description of various methods of determining Tpot from single veterinary samples. Vail (1993)
examined lymphomas in dogs and discussed the potential bene¢t to the clinical oncologist of having quantitative kinetic assays for accurate prediction of the response to treatment and long-term survival. La Rue and colleagues (1994) obtained multiple samples from 30 dogs with osteosarcomas. Their study investigated the variation between tumours from di¡erent dogs and compared this with the variation between di¡erent samples from the same tumour for a number of kinetic parameters. The results of their study showed that there was more variation between tumours than within tumours for the kinetic growth parameters examined, such as Tpot.
The major goals of this report are to described the preparation of biopsies from di¡erent tumour types, to describe a simple, reliable protocol for producing single-cell suspensions, and to report on the spectrum of growth parameter values observed from a variety of canine and feline tumours. To our knowledge, only canine lymphomas and osteosarcomas have been studied to date, and no information is available on tumours from cats. The results of this predictive assay should be useful for cancer prognosis,
planning of therapy, and the incorporation of these measurements into clinical trials. Therefore, it is important to obtain good, reproducible results. Tpotvalues of various
tumours from dogs and cats were compared with the labelling index (the fraction of cells which were synthesizing DNA at the time of BrdU administration), the relative movement (a measure of how far labelled cells progress through S-phase between BrdU labelling and biopsy excision), and the mitotic index (the fraction of cells observed to be in mitosis), all from the same tumours.
MATERIALS AND METHODS
The study involved an investigation of various tumours from 72 dogs and 20 cats, of both sexes, and of di¡erent breeds. The median age of the dogs was 9.5 years (range 0.7^16 years) and the median age of the cats was 13 years (range 1^16 years). The animals were presented to the Small Animal Clinic of the University of Zurich between January 1995 and May 1996. Owners were informed about the study and asked to monitor the animals for any subsequent side-e¡ects. Patients mostly presented with a palpable mass at di¡erent body locations. Clinical diagnosis of neoplasia was based on histopathological examination. All tumour samples were examined microscopically at the Institute of Veterinary Pathology of the University of Zurich. The histological type of the tumour, its grade and mitotic index were determined. The mitotic index was determined using a standard method by counting the number of mitoses visible in several microscope ¢elds of 0.17 mm2(magni¢cation 400-fold). Samples of normal or
in£ammatory tissue were excluded from this analysis.
BrdU (5-bromo-2'-deoxyuridine), an analogue of thymidine, is incorporated into the DNA during the S-phase of the cell cycle (Cooke et al., 1994). BrdU is not radioactive, nor is it toxic in the dose required for labelling the cells (Wilson et al., 1988a; Giordano et al., 1991; Cooke et al., 1994). Infusions of twice the dose of BrdU can be tolerated for several weeks without myelosuppression (Mitchell et al., 1983; Kinsella et al., 1984). The BrdU used for intravenous injection in this study was prepared at the Paul Scherrer Institute, Villigen, Switzerland. BrdU (7.00336 mg/ml: Fluka Chemie AG, Buchs, Switzerland) was dissolved in pyrogen-free 0.9% NaCl, pH 6, and 51 mmol NaOH/L. BrdU solutions were tested for stability and sterility. After 6 months the stability of 500 mg BrdU dissolved in 72 ml sterile, pyrogen-free saline was still greater than 99%. The sterility test con¢rmed its suitability for use in veterinary medicine. All the dogs were given 500 mg BrdU and all the cats were given 100 mg BrdU, in single intravenous injections (Wilson et al., 1988a; La Rue et al., 1994). After an average post-injection incubation period of 5.78+1.87 h, biopsies were obtained by excising the tumour. Half the biopsy was ¢xed in 50% ethanol and left overnight in a refrigerator. The other half was ¢xed in formalin for histological identi¢cation. Excess bromodeox-yuridine in the circulation is eliminated in a two-step process: ¢rst, BrdU is degraded to bromouracil, in a manner analogous to the degradation of thymidine; secondly, enzymatic dehalogenation takes place in the liver to form atomic bromine (Hughes et al., 1964). The concentration of BrdU in the circulation falls to 30% of its original value after 24 h.
A single-cell suspension for £ow cytometric evaluation was obtained from the biopsy which had been ¢xed in 50% ethanol at 48C. First, the tumour sample was ¢nely minced using two scalpels. During mincing, the tumour was submerged in approximately 1 ml of pepsin-HCl solution (0.4 mg pepsin (E. Merck, Darmstadt, Germany) per ml of 0.1 mol/L HCl; Schutte et al., 1987; Wilson et al., 1988a). Next, the minced tumour was transferred to a conical tube for digestion in 4 ml pepsin-HCl solution. HCl treatment promotes denaturation of DNA, and simultaneous treatment with pepsin decreases the subsequent amounts of debris and enhances the staining of nuclei (van Erp et al., 1988). The tumour suspension was digested for 25 min at 378C in a water bath, the tube occasionally being manually agitated. Incubation for more than 30 min causes overdigestion of the probe, unsatisfactory DNA pro¢les, and inaccurate determination of Tpot(Popert et al., 1993). Afterwards, the supernatant was withdrawn
with a syringe and ¢ltered through a 40 mm mesh. The single-cell suspension so obtained was centrifuged (400g, 5 min), the supernatant was aspirated, and the pellet was resuspended in 3 ml Hanks' balanced salt solution (HBSS: Life Technologies, Basel, Switzerland). This suspension was also centrifuged (300g, 5 min), the super-natant was aspirated, and the pellet was resuspended in 500 ml 2 mol/L HCl, and incubated for 10 min at 378C in a water bath, after which 3 ml HBSS was added. After further centrifugation (300g, 5 min), the supernatant was aspirated, and the pellet was resuspended in 3 ml HBSS. This wash step was repeated. After the next centrifugation (300g, 5 min), the supernatant was aspirated, and the pellet was resuspended in 3 ml HBSS with 0.5% Tween 20 (Serva Feinbiochemica, Heidelberg, Germany) and 0.5% bovine serum albumin (Readysysteme AG, Zurich, Switzerland). After another centrifugation (300g, 5 min), the supernatant was aspirated, and the pellet was again resuspended in 3 ml HBSS (White et al., 1990). The cell density in this suspension was assessed using an electronic counter (Coulter counter). The suspension was centrifuged once more (300g, 5 min), the supernatant was aspirated, and the pellet was resuspended in 100 ml HBSS and 20 ml of anti-BrdU FITC-antibody (anti-BrdU-FITC with gelatine and 0.1% acid; Becton Dickinson, Basel, Switzerland). The cells were then incubated at room temperature for 25 min, the tube being occasionally manually agitated. Thereafter 3 ml of HBSS was added and the suspension was centrifuged (300g, 5 min), the supernatant was aspirated, and the pellet was resuspended in 1 ml HBSS and 20 ml propidium iodide (1 mg/ml). Propidium iodide is an intercalating dye which binds to double-stranded DNA (van Erp et al., 1988). The pellet was mixed thoroughly and cells were left to stain for 5 min at 48C, ready for £ow cytometric analysis.
In the analysis, 20 000 cells were examined in a FACScan £ow cytometer (Becton Dickinson, San Jose, CA, USA). Procedures for £ow cytometry have been described in detail previously (Begg et al., 1985; Wilson et al., 1985; Becton Dickinson, 1989). Brie£y, four parameters were measured using an argon laser emitting light of 488 nm wavelength: forward-angle light scatter (cell volume), 908 side-angle light scatter (cell granularity), green £uorescence (BrdU content) and red £uorescence (DNA content). The cells were ¢rst identi¢ed on the basis of their size and granularity. Subsequently, bivariate density `dot-plots' of DNA-area (the area of the DNA £uorescence signal) versus DNA-width (the width of the DNA £uorescence signal) permitted exclusion by
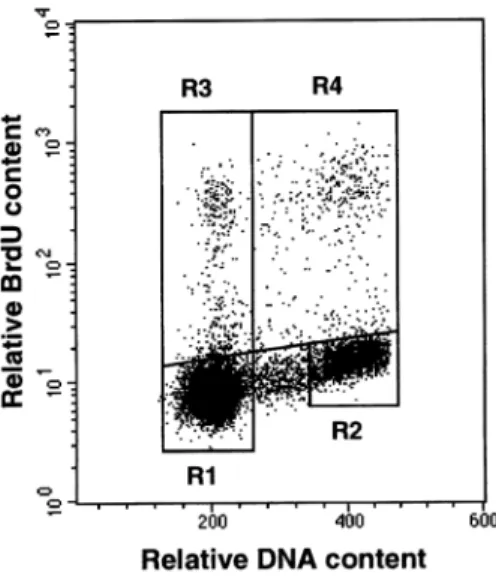
gating of abnormal signals and signals from unavoidable cell aggregates. A DNA-area histogram, and a DNA-area versus BrdU-incorporation bivariate density dot-plot were prepared from the data for the gated cells (see Figures 1 and 2).
Figure 1. Flow cytometric DNA histogram of canine mammary carcinoma. The cell cycle phases are labelled: G1, gap 1 phase; S, DNA synthesis phase; G2, gap 2 phase. The units of DNA content are relative based on £uorescence signal size
Figure 2. Bivariate density dot-plot of cellular DNA content versus bromodeoxyuridine (BrdU) labelling of a canine mammacarcinoma (see Figure 1). R1, G1-phase cells; R2, G2-phase cells; R3, labelled cells which have undergone cell division; R4, labelled cells which have not yet undergone cell division. The units of DNA content and BrdU content are relative based on £uorescence signal size
The Tpot method involves calculations using £ow cytometric data of BrdU
incorporation (determined from the green £uorescence of the FITC-labelled anti-bodies) and total DNA content (determined from the red £uorescence of propidium iodide incorporated into the DNA) of the tumour cells. Four parameters must be measured: FG1, FG2, FLand LI. FG1is the average DNA £uorescence of cells in G1
-phase, FG2that of cells in G2-phase, and FLthat of cells which were BrdU-labelled but
had not yet passed through mitosis (i.e. labelled, non-undivided), while LI is the fraction of cells labelled with BrdU. To determine FG1and FG2, G1-phase cells were
identi¢ed from the DNA histogram (Figure 1) and `gated' and their average DNA content was determined automatically using Lysis II software (Becton Dickinson, San Jose, CA, USA). FG2could then be determined as a function of the FG1value simply
multiplying by 1.9 (VindelÖv and Christensen, 1990). These values were often of assistance when separating undivided labelled cells from divided labelled cells on the dot-plots (Figure 2). FLand LI values for calculating Tpotwere obtained directly after
`gating'. This optimized analysis permitted a standard procedure to be applied to each specimen. To determine the average DNA £uorescence of labelled, undivided cells, the bivariate density dot-plot of DNA-area versus BrdU content was analysed. A gate was set around the labelled cells in order to determine labelling index. A gate was also set around the labelled cells which had not yet divided and had not yet entered the G1
-phase of the cell cycle. In the automated statistical subroutine of the Lysis II software, the average DNA content of FLcells was automatically determined.
Using these data, relative movement (RM), duration of S-phase (TS), and Tpotwere
determined. The methods of Begg and colleagues (1985) and White and colleagues (1990) were employed. RM was determined using: RM = (FL^FG1)/FG2^FG1). Tpot
was calculated from: Tpot= lTS/LI. The calculation assumes that movement of labelled
cells toward G2is linear with time. TScan be derived from RM using TS= 0.5t/(RM^
0.5), where t is the time between intravenous administration of the BrdU and excision of the biopsy (Begg et al., 1985). LI, the labelling index, is the fraction of cells which were synthesizing DNA at the time of BrdU administration and which therefore incorporated the label. l is a correction factor which takes into account the nonlinear distribution of cells through the cell cycle; it can be estimated but not calculated exactly from data made available from a £ow cytometric histogram (Terry et al., 1991). A realistic estimate of l is 0.8 and this is generally suitable for use with tumour biopsies (Steel, 1977; Wilson et al., 1988b).
RESULTS
During these studies, the following observations were made regarding procedures which contributed to an optimal determination of Tpot. The size of the biopsies had to
be at least 1^2 mm3in order for us to obtain su¤cient cells for £ow cytometry, because
many cells were lost during the work-up procedure. The size of the biopsy also limited the speed of ¢xation by ethanol, which must penetrate into the centre of the sample, so the sample size should not be too large. Alanen and colleagues (1989) compared four standard ¢xation techniques for £ow cytometric determination of Tpot: fresh,
formalin-¢xed, ethanol-preserved and para¤n-embedded samples. Identical DNA indices and fairly constant S-phase values were obtained from 50% ethanol-preserved samples stored at 48C for up to 5 months. In the present study, the samples were preserved in 50% ethanol and stored in a refrigerator at 48C for at least 24 h. This method of preserving the biopsy permitted analysis of the samples even several days after the biopsies were taken. It was also possible to perform additional analyses at later dates, as long as su¤cient material was still available. The pepsin-HCl incubation period for the diced sample, and the use of Hanks' balanced salt solution, were determined in a series of tests on di¡erent tumour types. During the course of these tests, three wash-steps were found to be necessary for obtaining suitable pH conditions for anti-BrdU-antibody binding following the HCl incubation. Both the duration and the temperature of antibody incubation were studied. Incubation at room temperature for 25 min gave optimum results.
BrdU was administered to 107 patients and biopsies were obtained. In 92 cases the Tpotvalue was measured successfully. In 9 of the 15 cases where no useful data could be
obtained, histological examination revealed no tumour was present. In 2 other cases the biopsy was taken from a necrotic area of the tumour, and in the remaining 4 cases the biopsy sample was too small and too few labelled cells were available for analysis in the £ow cytometer. Therefore, kinetic cell data were obtained from 85% of the samples. The majority of the biopsies were taken from dogs (73/92), while the rest (19/92) were taken from cats. These numbers represent approximately the ratio of dogs to cats presenting as tumour patients at our clinic. The majority of tumours were categorized as either epithelial or mesenchymal, because of the distinct ontogenetic origins of these two tumour types. Tumours such as insulinoma, mesothelioma, malpighioma and ameloblastoma, which were seldom seen, were listed separately. The potential doubling time (Tpot), labelling index (LI), relative movement (RM), and mitotic index (MI) were
evaluated for all 92 tumours. Tables I and II show the histopathological classi¢cation and the kinetic values of the epithelial and mesenchymal tumours in the dogs and cats, respectively. In these tables, the median values and range are indicated for each category. Comparisons can be made both between and within the epithelial and mesenchymal tumour groupings from dogs and cats of Tpot, LI, and RM. Values of
MI are displayed in Table III.
Regression analyses of loge(LI) versus loge(Tpot) for canine and feline mesenchymal
and epithelial tumours are presented in Figures 3A to 3D. Figure 3A presents the regression line for loge(LI) versus loge (Tpot) of canine mesenchymal tumours. The
same relationship for canine epithelial tumours is presented in Figure 3B. In Figure 3C, the regression curve of loge(LI) versus loge(Tpot) for feline mesenchymal tumours is
shown, while in Figure 3D the same relationship is presented for feline epithelial tumours. In all four ¢gures there is a signi¢cant slope and their data lie close to the regression curve. Figures 4A and 4B display the combined canine and feline mesenchymal and epithelial Tpot values in linear and logarithmic plots. Figure 4C
presents the distribution of LI values, and Figure 4D the distribution of RM values. Whereas the RM values were normally distributed, both the Tpotand LI were
log-normally distributed. The regression curve of RM versus loge(Tpot) for all canine and
coe¤cient was close to zero and was not signi¢cant (p = 0.25). Figure 5B presents loge
(LI) versus loge(Tpot) for the combined canine and feline mesenchymal and epithelial
tumours. Figure 5C presents the regression curve of loge(MI) versus loge(Tpot) for the
combined canine and feline mesenchymal and epithelial tumours. The modest correlation was highly signi¢cant (p50.0001). Figure 5D presents the regression curve of loge (MI) versus loge (LI) for combined canine and feline mesenchymal and
epithelial tumours. The modest correlation was also highly signi¢cant (p50.0001).
TABLE I
Tumour kinetic parameters of all canine tumours studied
Median Median Median
potential labelling relative
Tumour Tumour doubling time index in % movement
class No. type in days (range) (range) (range)
Epithelial tumours 25 See text 9.5 (2.8^63.0) 2.6 (0.4^9.8) 0.87 (0.75^1.06) Mesenchymal tumours 30 See text 19.3 (2.6^139.4) 2.4 (0.2^10.3) 0.88 (0.59^1.02) Miscellaneous tumours 7 Mixed 15.6 (5.3^72.9) 1.4 (0.3^3.5) 0.86 (0.81^0.90)
mammary cancer
Pigment cell tumours 4 Melanoma 14.9 (3.0^76.1) 2.8 (0.5^7.6) 0.91 (0.79^0.94) Di¡erent tumours 4 Epulides 8.7 (8.5^10.1) 3.0 (2.7^3.5) 0.85 (0.78^0.85)
1 Insulinoma 14.4 3.1 0.77
1 Mesothelioma 4.2 5.4 0.95
1 Malpighioma 8.1 2.3 0.96
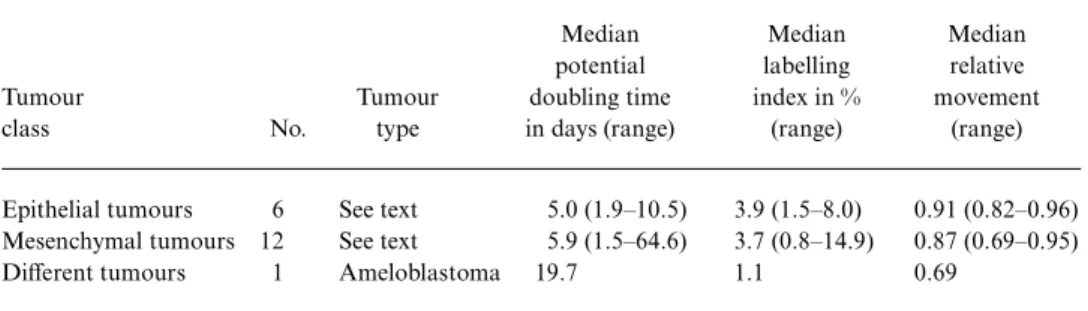
TABLE II
Tumour kinetic parameters of all feline tumours studied
Median Median Median
potential labelling relative
Tumour Tumour doubling time index in % movement
class No. type in days (range) (range) (range)
Epithelial tumours 6 See text 5.0 (1.9^10.5) 3.9 (1.5^8.0) 0.91 (0.82^0.96) Mesenchymal tumours 12 See text 5.9 (1.5^64.6) 3.7 (0.8^14.9) 0.87 (0.69^0.95)
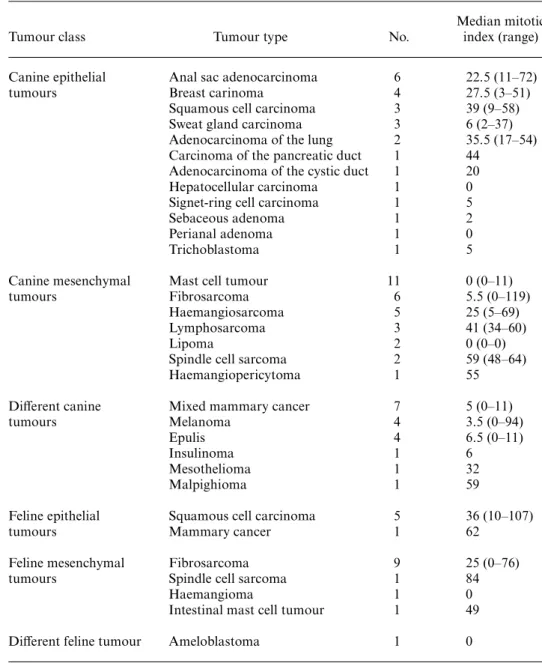
TABLE III
Histological class, histological type, number of tumours and mitotic index of tumours in dogs and cats
Median mitotic
Tumour class Tumour type No. index (range)
Canine epithelial Anal sac adenocarcinoma 6 22.5 (11^72)
tumours Breast carinoma 4 27.5 (3^51)
Squamous cell carcinoma 3 39 (9^58)
Sweat gland carcinoma 3 6 (2^37)
Adenocarcinoma of the lung 2 35.5 (17^54)
Carcinoma of the pancreatic duct 1 44
Adenocarcinoma of the cystic duct 1 20
Hepatocellular carcinoma 1 0
Signet-ring cell carcinoma 1 5
Sebaceous adenoma 1 2
Perianal adenoma 1 0
Trichoblastoma 1 5
Canine mesenchymal Mast cell tumour 11 0 (0^11)
tumours Fibrosarcoma 6 5.5 (0^119)
Haemangiosarcoma 5 25 (5^69)
Lymphosarcoma 3 41 (34^60)
Lipoma 2 0 (0^0)
Spindle cell sarcoma 2 59 (48^64)
Haemangiopericytoma 1 55
Di¡erent canine Mixed mammary cancer 7 5 (0^11)
tumours Melanoma 4 3.5 (0^94)
Epulis 4 6.5 (0^11)
Insulinoma 1 6
Mesothelioma 1 32
Malpighioma 1 59
Feline epithelial Squamous cell carcinoma 5 36 (10^107)
tumours Mammary cancer 1 62
Feline mesenchymal Fibrosarcoma 9 25 (0^76)
tumours Spindle cell sarcoma 1 84
Haemangioma 1 0
Intestinal mast cell tumour 1 49
DISCUSSION
Tumour-volume doubling time is an important clinical parameter but, unlike Tpot, it
cannot be determined rapidly. Tpotis determined from the viable cells in a population;
both quiescent and cycling cells. Tpotis more informative than tumour-cell cycle-time
because it also takes into account the growth fraction, which is the proportion of cells that are actively dividing. However, at least three sources of potential di¡erence between Tpotand tumour-volume doubling time exist. First, the contribution of cell
loss through metastasis, exfoliation, cell death, etc., is not quanti¢ed by the Tpot
method (Terry et al., 1992). This can result in inappropriate Tpotvalues, especially for
carcinomas, where cell loss contributes considerably to the tumour volume kinetics (Denekamp, 1970). Second, because Tpotmeasurements are based on the average of all Figure 3. Regression analyses of logelabelling index [log LI] versus logepotential doubling time [loge (Tpot/days)] for various small animal tumours. A, canine mesenchymal tumours; B, canine epithelial tumours; C, feline mesenchymal tumours; D, feline epithelial tumours. Labelling index is absolute, not a percentage. The formula for the regression curves and Pearson's correlation coe¤cients are given below the plots
cells, this can be misleading when determined from tumours populated by only a small fraction of the tumour cells (clonogenic stem-cells). Third, heterogeneity in cell growth across the total tumour mass may contribute to biased Tpotvalues. Nevertheless, the
potential doubling time expressed in days is an attractive prognostic parameter for the clinician. Furthermore, numerous authors have reported that there is less intratumour than intertumour variation, con¢rming that observed di¡erences between Tpotvalues
re£ect actual di¡erences in growth rate (Wilson et al., 1988b; Giordano et al., 1991; LaRue et al., 1994). Tpotvalues have also been reported to be higher in metastases than
in primary tumours (Holmgren et al., 1995).
In the present study, all tumour types displayed a wide range of Tpot values, as
previously reported by Fowler (1986). This emphasizes the need to determine the tumour kinetic parameters for each patient; no single tumour-characteristic value can be assumed. The Tpotvalues were log-normally distributed (see Figures 5A and 5B).
This was also true of the LI and MI values. The tumours in the slow-growing `tails' of
Figure 4. Histogram plots of various kinetic parameters from combined canine and feline mesenchymal and epithelial tumours. A, potential doubling time [Tpot/days]; B, logepotential doubling time [loge(Tpot/days)]; C, labelling index [LI]; D, relative movement [RM]. Labelling index is absolute, not a percentage. Relative movement is a dimensionless quantity. The continuous black line denotes the best ¢t of the data to a normal distribution
these distributions tend to represent the more radiotherapy-resistant tumours. Three experimental parameters contribute to Tpot: t, RM and LI. The average t value was
5.78+1.87 h and was independent of tumour growth kinetics. The average RM was 0.85+0.1, ranging from 0.59 to 1.06. Tpotis inversely proportional to `RM ^ 0.5', which
varied from 0.086 to 0.56, a 6.5-fold range. Compared to the range of LI values, the contribution of RM was negligible and no signi¢cant correlation with Tpot was
observed (see Figure 5A). LI displayed a 75-fold range from 0.2% to 14.9% (average of combined data 3.5+2.9%). The LI data were clearly skewed to small values: m3/ Figure 5. Regression analyses of various kinetic parameters from combined mesenchymal and epithelial tumours. A, relative movement [RM] versus logepotential doubling time [loge(Tpot/ days)]; B, logelabelling index [logeLI] versus logepotential doubling time [loge(Tpot/days)]; C, logemitotic index [loge(MI/%)] versus logepotential doubling time [loge(Tpot/days)]; D, loge mitotic index [loge(MI/%)] versus logelabelling index [logeLI]. Labelling index is absolute, not a percentage. Relative movement is a dimensionless quantity. The formula for the regression curves and Pearson's correlation coe¤cients are given below the plots
s = 1.4 (see Figure 4C) and were log-normally distributed. The loge(LI) versus loge
(Tpot) regression plots for canine mesenchymal and epithelial tumours both displayed a
distinct slope, with little scatter, indicating a high correlation (see Figures 3A and 3B). The same was true for feline mesenchymal and epithelial tumours (see Figures 3C and 3D). As LI is inversely proportional to Tpot, and because LI displayed a wide range of
values, it was both expected and observed to be a strong predictor of Tpot(see Figure
5B). If Tpot is derived from LI data alone (Tpot= 0.2365/LI), the estimates of Tpot
deviate from the experimental values by an average of only 28%.
The duration of the S-phase (TS) was determined using t and RM values. The
average TS could also be derived from the slope of the loge (LI) versus loge (Tpot)
regression curves, because the numerical value of the slope equals lTS, and l was ¢xed
at 0.8 (Begg et al., 1985). For canine mesenchymal tumours, TSwas 10.0 h; for canine
epithelial tumours, 8.1 h; for feline mesenchymal tumours, 8.5 h; and for feline epithelial tumours, 5.4 h. This con¢rmed clinical observations indicating that epithelial tumours tend to grow more quickly than mesenchymal tumours. The TS data also
suggest that the S-phase in feline tumour cells is shorter than it is in canine tumour cells. Histological determination of MI and Tpotanalysis were performed on the same
biopsy sample by dividing the excised material into two small pieces. A modest but highly signi¢cant correlation between loge(MI) and loge(Tpot) and between loge(MI)
and loge(LI) was observed (see Figures 5C and 5D). Signi¢cant correlations between
these di¡erent tumour growth parameters were expected.
The method described in this study for evaluating tumour kinetic data using BrdU-labelled tumour cells is straightforward and reproducible. Tpotvalues were found to
correlate well with the labelling index. In the future it may not be necessary to calculate Tpotusing this method if adequate estimates based on labelling index can be made. It
may even be possible to estimate labelling index noninvasively. This study demon-strated signi¢cant intertumour variation in the potential doubling time and re-emphasized the need for analysis of the data from individual patients. Determination of the kinetic growth of a tumour a¡ords an additional prognostic step towards improved, patient-speci¢c cancer therapy.
ACKNOWLEDGEMENTS
This work was supported by the Swiss National Science Foundation: Grant 31-40482.94.
REFERENCES
Alanen, K.A., Klemi, P.J., Joensuu, H., Kujari, H. and Pekkala, E., 1989. Comparison of fresh, ethanol-preserved, and para¤n-embedded samples in DNA £ow cytometry. Cytometry, 10, 81^85
Becton Dickinson, 1989. Monoclonal antibodies detecting cell proliferation and activation. Source Book Becton Dickinson Immunocytometry Systems, Mountain View, California, USA, Section 2.80.1^3.80.2 Begg, A.C., 1989. Derivation of cell kinetic parameters from human tumours after labelling with
Begg, A.C., McNally, N.J., Shrieve, D.C. and Ka«rcher, H., 1985. A method to measure the duration of the DNA synthesis and the potential doubling time from a single sample. Cytometry, 6, 620^626
Carter, O.W., Robinson, J.P. and Narayanan, P.K., 1993. Flow cytometry: theory and clinical applications. Proceedings of the American College of Veterinary Internal Medicine Forum, 11, 785^787
Cooke, L.D., Cooke, T.G., Forster, G., Jones, A.S. and Stell, P.M., 1994. Prospective evaluation of cell kinetics in head and neck squamous carcinoma: the relationship to tumour factors and survival. British Journal of Cancer, 69, 717^720
Denekamp, J., 1970. The cellular proliferation kinetics of animal tumours. Cancer Research, 30, 393^400 Dewhirst, M.W., LaRue, S.M. and Gerweck, L., 1995. Tumor physiology and cell kinetics. Seminars in
Veterinary Medicine and Surgery (Small Animal), 10, 148^157
Dolbeare, F.A., Gratzner, H.G., Pallavicini, M.G. and Gray, J.W., 1983. Flow cytometric measurement of total DNA content and incorporated bromodeoxyuridine. Proceedings of the National Academy of Science of the USA, 80, 5573^5577
Dressler, L.G., Seamer, L., Owens, M.A., Clark, G.M. and McGuire, W.L., 1987. Evaluation of a modeling system for S-phase estimation in breast cancer by £ow cytometry. Cancer Research, 47, 5294^5302 Fowler, J.F., 1986. Potential for increasing the di¡erential response between tumours and normal tissues:
can proliferation rate be used? International Journal of Radiation Oncology, Biology and Physiology, 12, 641^645
Gillette, E.L., 1982. Spontaneous canine neoplasms as models for therapeutic agents. In: I.J. Fidler and R.J. White (eds), Design of Models for Testing Cancer Therapeutic Agents, (Van Nostrand Reinhold), 185^192
Giordano, M., Riccardi, A., Danova, M., Brugnatelli, S. and Mazzini, G., 1991. Cell proliferation of human leukemia and solid tumors studied with in vivo bromodeoxyuridine and £ow cytometry. Cancer Detection and Prevention, 15, 391^396
Gratzner, H.G., 1982. Monoclonal antibody to 5-bromo- and 5-iododeoxyuridine: a new reagent for detection of DNA replication. Science, 218, 474
Holmgren, L., O'Reilly, M.S. and Folkman, J., 1995. Dormancy of micrometastases: balanced prolifera-tion and apoptosis in the presence of angiogenesis suppression. Nature Medicine, 1, 149^153
Hughes, W.L., Commerford, S.L., Gitlin, O., Kru«ger, R.C., Schultze, B., Shah, V. and Reilly, P., 1964. DNA metabolism in vivo: I. Cell proliferation and death as measured by incorporation and elimination of IUdR. Federation Proceedings, 23, 640
Kinsella, T.J., Russo, A., Mitchell, J.B., Rowland, J., Jenkins, J., Schwade, J., Meyers, C.E., Colins, J.M., Speyer, J., Kornblith, P., Smith, B., Kufta, C. and Gladstein, E.A., 1984. A phase I study of intermittent bromodeoxyuridine with conventional fractionated irradiation. International Journal of Radiation Biology and Physiology, 10, 69^76
LaRue, S.M., Fox, M.H., Withrow, S.J., Powers, B.E., Straw, R.C., Coªte¨, I.M. and Gillette, E.L., 1994. Impact of heterogeneity in the predictive value of kinetic parameters in canine osteosarcoma. Cancer Research, 54, 3916^3921
Mitchell, J.B., Kinsella, T.J., Russo, A., McPherson, S., Rowland, J., Kornblith, P. and Gladstein, E., 1983. Radiosensitization of hematopoietic precursor cells (CFUs) in glioblastoma patients receiving inter-mittent intravenous infusions of bromodeoxyuridine (BUdR). International Journal of Radiation Oncology, Biology and Physiology, 9, 457^464
Owen, L.N., 1980. TMN Classi¢cation of Tumours in Domestic Animals, ed. 1. (World Health Organization, Geneva)
Popert, R.J.M., Joyce, D.J., Walmsley, B.H. and Coptcoat, M.J., 1993. Bromodeoxyuridine labelling of transitional cell carcinoma of the bladder ^ an index of recurrence? British Journal of Urology, 71, 279^ 283
Remvikos, Y., Vielh, P., Padoy, E., Benyahia, B., Voillemot, N. and Magdele¨nat, H., 1991. Breast cancer proliferation measured on cytological samples: a study by £ow cytometry of S-phase fractions and BrdU incorporation. British Journal of Cancer, 64, 501^507
Rew, D.A., Wilson, G.D., Taylor, I. and Weaver, P.C., 1991. Proliferation characteristics of human colorectal carcinomas measured in vivo. British Journal of Surgery, 78, 60^66
Rew, D.A., Campbell, I.D., Taylor, I. and Wilson, G.D., 1992. Proliferation indices of invasive breast carcinomas after in vivo 5-bromo-2'-deoxyuridine labelling: a £ow cytometric study of 75 tumours. British Journal of Surgery, 79, 335^339
Shimomatsuya, T., Tanigawa, N. and Muraoka, R., 1991. Proliferation activity of human tumors: assessment using bromodeoxyuridine and £ow cytometry. Journal of Cancer Research, 82, 357^362 Steel, G.G., 1977. Growth Kinetics of Tumours: Cell Population Kinetics in Relation to the Growth and
Schutte, B., Reynders, M.M.J., van Assche, C.L.M.V.J., Hupperets, P.S.G.J., Bosman, F.T. and Blijham, G.H., 1987. An improved method for the immunocytochemical detection of the bromodeoxyuridine labeled nuclei using £ow cytometry. Cytometry, 8, 372^376
Terry, N.H.A., White, R.A., Meistrich, M.L. and Calkins, D.P., 1991. Evaluation of £ow cytometric methods for determining population potential doubling times using cultured cells. Cytometry, 12, 234^ 241
Terry, N.H.A., White, R.A. and Meistrich, M.L., 1992. Cell kinetics: from tritiated thymidine to £ow cytometry. British Journal of Radiology, 24, 153^157
Vail, D.M., 1993. Analysis of tumor cell-cycle kinetics: a tool for predicting prognosis and treatment response. Proceedings of the 11th ACVIM Forum, 778^781
van Erp, P.E.J., Brons, P.P.T., Boezeman, J.B.M., de Jongh, G.J. and Bauer, F.W., 1988. A rapid £ow cytometric method for bivariate bromodeoxyuridine/DNA analysis using simultaneous proteolytic enzyme digestion and acid denaturation. Cytometry, 9, 627^630
VindelÖv, L.L. and Christensen, I.J., 1990. A review of techniques and results obtained in one laboratory by an integrated system of methods designed for routine clinical £ow cytometric DNA analysis. Cytometry, 11, 753^770
White, R.A., Terry, N.H.A., Meistrich, M.L. and Calkins, D.P., 1990. Improved method for computing potential doubling time from £ow cytometric data. Cytometry, 11 314^317
Wilson, G.D., McNally, N.J., Dunphy, E., Karcher, H. and Pfagner, R., 1985. The labelling index of human and mouse tumors assessed by bromodeoxyuridine staining in vitro and in vivo and £ow cytometry. Cytometry, 6, 641^647
Wilson, G.D., McNally, N.J., Dische, S. and Bennett, M.H., 1988a. Cell proliferation in human tumours measured by in-vivo labelling with bromodeoxyuridine. British Journal of Radiology, 61, 419^422 Wilson, G.D., McNally, N.J., Dische, S., Saunders, M.I., Des Rochers, C., Lewis, A.A. and Bennett, M.H.,
1988b. Measurement of cell kinetics in human tumours in vivo using bromodeoxyuridine incorporation and £ow cytometry. British Journal of Cancer, 58, 423^431