Publisher’s version / Version de l'éditeur:
Journal of Agricultural and Food Chemistry, 50, 2, pp. 248-254, 2001-12-19
READ THESE TERMS AND CONDITIONS CAREFULLY BEFORE USING THIS WEBSITE. https://nrc-publications.canada.ca/eng/copyright
Vous avez des questions? Nous pouvons vous aider. Pour communiquer directement avec un auteur, consultez la première page de la revue dans laquelle son article a été publié afin de trouver ses coordonnées. Si vous n’arrivez pas à les repérer, communiquez avec nous à [email protected].
Questions? Contact the NRC Publications Archive team at
[email protected]. If you wish to email the authors directly, please see the first page of the publication for their contact information.
NRC Publications Archive
Archives des publications du CNRC
This publication could be one of several versions: author’s original, accepted manuscript or the publisher’s version. / La version de cette publication peut être l’une des suivantes : la version prépublication de l’auteur, la version acceptée du manuscrit ou la version de l’éditeur.
For the publisher’s version, please access the DOI link below./ Pour consulter la version de l’éditeur, utilisez le lien DOI ci-dessous.
https://doi.org/10.1021/jf0106695
Access and use of this website and the material on it are subject to the Terms and Conditions set forth at
Using a modified ferrous oxidation-xylenol orange (FOX) assay for
detection of lipid hydroperoxides in plant tissue
DeLong, John M.; Prange, Robert K.; Hodges, D. Mark; Forney, Charles F.;
Bishop, M. Conny; Quilliam, M. A.
https://publications-cnrc.canada.ca/fra/droits
L’accès à ce site Web et l’utilisation de son contenu sont assujettis aux conditions présentées dans le site
LISEZ CES CONDITIONS ATTENTIVEMENT AVANT D’UTILISER CE SITE WEB.
NRC Publications Record / Notice d'Archives des publications de CNRC:
https://nrc-publications.canada.ca/eng/view/object/?id=7ee3580f-c134-4185-a6d3-cb87c5e10071
https://publications-cnrc.canada.ca/fra/voir/objet/?id=7ee3580f-c134-4185-a6d3-cb87c5e10071
Using a Modified Ferrous Oxidation
−
Xylenol Orange (FOX)
Assay for Detection of Lipid Hydroperoxides in Plant Tissue
J
OHNM. D
EL
ONG,*
,†R
OBERTK. P
RANGE,
†D. M
ARKH
ODGES,
†C
HARLESF. F
ORNEY,
†M. C
ONNYB
ISHOP,
†ANDM
ICHAELQ
UILLIAM‡ Atlantic Food and Horticulture Research Centre, Agriculture and Agri-Food Canada, 32 Main Street,Kentville, Nova Scotia B4N 1J5, Canada, and Institute for Marine Biosciences, National Research Council of Canada, Halifax, Nova Scotia B3L 3V2, Canada
The ferrous oxidation-xylenol orange (FOX) assay was adapted for quantifying lipid hydroperoxides (LOOHs) in plant extracts. Excised pieces of several fruit and vegetable species were exposed to 83 kJ m-2day-1of biologically effective ultraviolet B irradiance (UV-B
BE) for 10-12 days to induce cellular oxidation. The LOOH and thiobarbituric acid reactive substance (TBARS) concentrations of these plant tissues were assessed with the FOX and iodometric assays for the former and a modified TBARS assay for the latter. There was generally good agreement between the FOX and iodometric methods both prior to and following the UV exposure. However, the iodometric assay appeared to have some difficulty in consistently quantifying lower LOOH levels (<11 µM), whereas the FOX assay measured LOOH concentrations as low as 5 µM. All tissues exhibited UV-induced increases in TBARS, indicating a marked degree of cellular oxidation in the exposed tissue segments. Compared with the iodometric assay, the FOX method consistently generated less variable LOOH values. The presence of authentic linoleic acid-OOHs in spiked avocado and spinach samples (11 µM) was identified with liquid chromatography-mass spectrometry techniques, which validated corresponding FOX assay results. The FOX method is inexpensive, is not sensitive to ambient O2or light levels, and can rapidly generate LOOH measurements. The physiological value of the FOX assay resides in its ability to measure initial rather than more advanced fatty acid oxidation; hence, early membrane-associated stress events in plant tissue can be detected.
KEYWORDS: Fatty acid oxidation; ferrous oxidation-xylenol orange (FOX) assay; lipid hydroperoxides; oxidative stress
INTRODUCTION
Fatty acid oxidation has been implicated in normal and
stress-induced plant metabolism (1-4), in plant senescence
mecha-nisms (5, 6), in the etiology of various animal-based diseases
such as atherosclerosis (7), coronary heart disease (8), and cancer
(9, 10), and in inflammation disorders such as arthritis (11) and
asthma (12).
Membrane fatty acids are susceptible to oxidative degradation
under a variety of cellular stress conditions often resulting in
the eventual breakdown of membrane structure and function
(13, 14). As polyunsaturated fatty acids (PUFA) undergo
nonenzymic peroxidative reactions or enzyme-catalyzed
oxida-tion, molecular (O
2) or singlet (
1O
2) oxygen is incorporated into
the hydrocarbon skeleton, resulting in the formation of lipid
hydroperoxides (LOOHs) (15-17).
Hence, the formation of hydroperoxide moieties is an initial
event in the oxidative degradation of fatty acid molecules.
Hydroperoxides can then undergo various decomposition
path-ways often involving transition metals (notably Fe
2+) or
enzyme-mediated reactions that yield various products such as alkenals,
hydroxyalkenals, alkanes, and jasmonic acid (2, 18).
Lipid hydroperoxides have been measured by using a variety
of techniques including high-performance liquid chromatography
(HPLC) (19), gas chromatography (GC) (20), electrospray
mass spectrometry (21), iodide oxidation (22), heme degradation
of peroxides (23), cylco-oxygenase activation (24), and
micro-peroxidase-luminol chemiluminescence (25). These methods
are time-consuming or costly or require strict control of ambient
oxygen levels. In recent years, another method has been
developed that is based upon the oxidation of ferrous (Fe
2+) to
ferric (Fe
3+) ions by LOOHs with the subsequent binding of
the Fe
3+ion to the ferric-sensitive dye xylenol orange
(26-28). Known as the ferrous oxidation-xylenol orange (FOX)
assay (versions I and II), the technique is sensitive (nanomole
to micromole levels of LOOHs), inexpensive, and not affected
by ambient oxygen concentrations. As version II permits the
quantification of low concentrations of LOOHs in the presence
* Author to whom correspondence should be addressed [telephone (902) 679-5765; fax (902) 679-2311; e-mail [email protected]].
†Agriculture and Agri-Food Canada. ‡National Research Council of Canada.
248
J. Agric. Food Chem. 2002, 50, 248
−
254
10.1021/jf0106695 CCC: $22.00 Published 2002 by the American Chemical Society Published on Web 12/19/2001
of high background levels of nonperoxidized fatty acids, it is
the preferred method.
To date, the FOX assay has been mainly used to measure
the presence of LOOHs in reconstructed membrane systems and
in mammalian tissue and serum extracts (26, 27, 29, 30). It has
the potential to be a rapid and inexpensive method for detecting
incipient lipid peroxidation in plant tissue. To our knowledge,
the FOX assay has been reported by only one other group for
LOOH measurement in plant tissue (31, 57), although it has
been utilized for LOOH detection in edible vegetable oils (32,
33). The main objective of this study was to adapt the FOX
assay to more accurately detect the presence of LOOHs in plant
tissue.
MATERIALS AND METHODS
Chemicals.Boric acid, methanol (HPLC grade), potassium iodide, and trichloroacetic acid (TCA) were purchased from Fisher Scientific, Pittsburgh, PA, whereas the sulfuric acid (H2SO4; reagent grade) and
glacial acetic acid were obtained from Anachemia Science, Montreal, PQ. Bovine serum albumin (BSA, fraction V), butylated hydroxytoluene (BHT), 3,3′ -bis[N,N-di(carboxyethyl)aminomethyl]-o-cresolsulfone-pthalein sodium salt (xylenol orange), ethylenediaminetetraacetic acid disodium salt dihydrate (EDTA), ferrous ammonium sulfate hexa-hydrate, n-heptane, hydrogen peroxide (H2O2; 30.4%), linoleic acid
(cis-9,cis-12-octadecadienoic acid), lipoxygenase [(LOX) EC 1.13.11.12], thiobarbituric acid (TBA), triphenylphosphine (TPP), and polyoxy-ethylenesorbitan monolaurate (Tween-20) were purchased from Sigma, St. Louis, MO. The double-distilled water was generated by a Millipore QUF water purification system (Millipore, Danvers, MA). The 95% ethanol was purchased from Alcools De Commerce Inc., Boucherville, PQ.
Plant Material.All plant material used was obtained from local supermarkets or from the Atlantic Food and Horticulture Research Centre of Agriculture and Agri-Food Canada in Kentville, NS. Tissue segments of avocado (Persea americana Mill.) flesh, potato (Solanum tuberosum L.) cortex, red cabbage (Brassica oleracea L.) and spinach (Spinacia oleracea L.) leaves, pear (Pyrus communis L.) skin, and red bell pepper (Capsicum annuum L.) skin and flesh were used and ranged in mass from 0.2 to 1.1 g. All tissue was hand ground with a mortar and pestle using ∼0.5-1.0 g of inert sand in 10 mL of 80:20 ethanol/ water with 0.01% (w/v) BHT added to arrest any further oxidation (34). Each sample was then centrifuged at 3000g for 10 min with supernatant aliquots being used for LOOH and TBARS determination. The blanks were processed identically except for the absence of the tissue segments. The 80:20 ethanol/water solution was chosen as the superior extracting solvent for both the FOX and TBARS assays compared with either 100% ethanol or ethyl acetate (data not shown).
FOX Assay.The FOX version II assay (47) was used to quantify the presence of LOOHs in artificial systems and plant tissue extracts. The simplified reaction sequence involves the oxidation of ferrous (Fe2+) to ferric (Fe3+) ions by LOOHs with the subsequent binding of
the Fe3+ion to the ferric-sensitive dye xylenol orange, yielding an
orange to purple complex (color dependent on the amount of -OOHs present), which is measured at 560 nm (27, 28, 35).
For each 1000 mL volume, the FOX reagent consisted of 90% methanol (v/v), 10% 250 mM H2SO4(v/v) (25 mM final concentration),
880 mg of BHT (4 mM), 98 mg of ferrous ammonium sulfate hexahydrate (250 µM), and 76 mg of xylenol orange (100 µM). The methanol, H2SO4, and BHT were mixed and stored at 4°C, whereas
the iron and xylenol orange were added just prior to the addition of reagent to the samples. The complete reagent (with iron and xylenol orange) was used within 24 h or a new batch was made.
For some samples, 100 µL of the plant extract was combined with 100 µL of 10 mM TPP (a LOOH reducing agent) in methanol,. The mixture was momentarily stirred with a Vortex-Genie 2 (VWR Scientific, Mississauga, ON) and then incubated for 30 min to allow for the complete reduction of any present -OOHs by TPP (+TPP). Samples without TPP (-TPP) addition were treated identically except that the TPP aliquot was substituted with methanol or ethanol. Following the 30-min TPP incubation, 2000 µL of FOX reagent was added to
each sample with the absorbance at 560 nm being recorded exactly 10 min after reagent addition on an Ultraspec 3000 spectrophotometer (Pharmacia Biotech, Cambridge, U.K.). The absorbance difference between the samples without and with TPP indicated the presence of LOOHs; -OOH values were then expressed as micromolar H2O2
equivalents using a standard curve spanning a 0-20 µM H2O2range
(Figure 1A). The relationship between the 560 nm absorbance values and H2O2concentration became curvilinear around 30 µM H2O2(data
not shown).
Iodometric Assay.The iodometric assay (27, 36) was used to verify the presence of LOOHs in reconstructed LOOH systems and plant tissue extracts. The LOOHs are reduced to alcohols by iodide (2I
-) resulting in the conversion of 2I
-to the triiodide anion (I3-), which is measured
spectrophotometrically at 290 or 360 nm. Reagent A consisted of a 1:1 (v/v) mixture of methanol/glacial acetic acid, whereas reagent B was a 10% (w/v) solution of KI in methanol with 1 mg‚mL-1of EDTA.
Reagents A and B were deoxygenated by sparging with high-purity (>99%) N2for 10 min prior to any sample introduction. Reagent B
was stirred for 30 min before deoxygenation to facilitate thorough mixing of the KI into solution, followed by an N2sparging for 10 min.
For each sample, 1.2 mL of reagent A was mixed with 1.8 mL of reagent B in a quartz cuvette and quickly sealed with a threaded cap having a gas-impermeable Teflon septum. The combined reagent solution was deoxygenated by bubbling with N2 gas for 1 min via
insertion of a hypodermic needle through the septum, after which 50 µL of sample extract was introduced by the same method as the N2
gas, followed by inversion of the cuvette to ensure adequate mixing. The sample/reagent absorbances were then measured every 6 min at 360 nm to determine the point of maximum color development. The sample concentrations of LOOHs were calculated as micromolar H2O2
equivalents based upon a standard curve spanning a 0-20 µM H2O2
range (Figure 1B).
Figure 1. Standard curves relating µM H2O2equiv (X) to (A) absorbance
units at 560 nm (Y) as determined by the FOX assay or (B) absorbance units at 360 nm (Y) as determined by the iodometric assay.
TBARS Assay.A modified TBARS assay was used as an alternative assessment of lipid oxidation (34). The TBARS reagent consisted of 20% (w/v) TCA, 0.65% (w/v) TBA, and 0.01% (w/v) BHT in double-distilled H2O. Two hundred microliters of 80:20 ethanol/water (v/v)
was combined with 800 µL of H2O and either 1000 µL of reagent with
TBA added (+TBA) or 1000 µL of reagent without TBA (-TBA). Samples were then mixed vigorously, incubated at 95°C in a block heater (Multiblok, Lab-Line Instruments) for 25 min, cooled, and centrifuged at 3000g for 10 min. Sample absorbances for the malon-dialdehyde (MDA)-TBA adduct were then measured spectrophoto-metrically at 532 nm; nonspecific turbidity and total soluble sugars (principally sucrose, fructose, and glucose) were subtracted from the 532 nm signal by measurements at 600 and 440 nm, respectively. This TBARS procedure (34) eliminates any 532 nm artifacts contributed by the presence of interfering compounds according to the following equations:
Generation and Phase Separation of LOOHs.Lipid-OOHs were generated via LOX or autoxidation. The LOX samples contained boric acid buffer (200 mM; pH 9.0), linoleic acid (9.7 mM), Tween-20 (2.2 mM), and 11250 units‚mL-1 of LOX protein and were moderately
stirred in the dark for ∼24 h. The autoxidation samples contained the same constituents minus the LOX and were moderately stirred in the dark at room temperature for 48 h. The controls in both systems did not contain linoleic acid. One hundred microliters from each of the LOX and autoxidation solutions was added to 10 mL of 80:20 (v/v) ethanol/water grinding medium and vigorously stirred for a few seconds on a Vortex-Genie. One and a half milliliters from each solution was then added to 1.5 mL of heptane, followed by mixing and centrifugation at 3000g for 10 min, which yielded an upper organic phase and a lower aqueous phase (37). The phases were separated, with 500 µL from each being evaporated with N2gas, and were then reconstituted to 1 mL
with 100% methanol. One hundred microliters from the reconstituted organic and aqueous phases was used to determine the presence of LOOHs via the FOX assay.
Linoleic acid-OOHs were also generated according to a Sigma-Aldrich protocol (38), which were then quantified using LC-MS. Five hundred microliters of 95% ethanol was added to 500 µL of linoleic acid, which was then combined with 50 mL of 200 mM boric acid buffer (pH 9.0). One to three hundred microliters of Tween-20 was also added to solubilize the fatty acid. Five milliliters of this solution was then combined with 20 mL of boric acid buffer into which ∼9500 units‚mL-1of LOX was added and moderately stirred at room
temper-ature for ∼18 h. Controls did not contain the fatty acid substrate but did have LOX. Following the reaction period, the -OOH solution was diluted 30-fold with methanol and had an absorbance of 1.5-2.0 units at 234 nm. The calculation of LOOH concentration was based on the formation of conjugated dienes in which 1 absorbance unit ) 0.12 µmol of linoleic acid oxidized () 0.12 µmol of -OOH formed). The LOOH solution was kept at -20°C and was stable for several weeks.
Protein Oxidation.A 500 µM aqueous stock solution of BSA was continuously agitated on a magnetic stirring plate for ∼20 h at room temperature to induce protein oxidation and was then held at room temperature for an additional 20 h. A fatty acid solution (10 mM) consisting of 25 mL of boric acid (200 mM; pH 9.0), 65 µL of Tween-20, and 80 µL of linoleic acid was continuously stirred on a magnetic plate for 17-18 h to induce fatty acid oxidation. Twenty-five milliliters of the fatty acid solution was added to the same volume of the BSA mixture, which was then stirred for 1-1.5 h. Three concentrations of BSA [0.08 (∼1.2 µM), 0.32 (∼4.7 µM), and 3.0 (∼44 µM) mg‚mL-1]
were tested separately and in combination with three concentrations of linoleic acid [3.38 (12.1 µM), 13.5 (48.2 µM), and 124 (444 µM) µg‚mL-1] for FOX reactivity.
UV-B Treatment.To induce lipid peroxidation, plant tissue seg-ments were continuously exposed for 10-12 days to UV-B radiation generated by unfiltered UV-B lamps (Philips FS-40 UV-B lamps, Blacklock Medical Products, Delta, BC), which generated radiation from approximately 280 to 400 nm with 86% of the irradiance in the UV-B (280-320 nm) band. The levels of UV-B irradiance were monitored daily by a UV-Biometer, model 501A (Solar Light Co., Philadelphia, PA), which was weighted with the erthymal action spectra. Biologically effective UV-B (UV-BBE) radiation was then determined by converting
the units of the biometer into spectroradiometric readings weighted with the generalized plant damage action spectra, normalized to unity at 300 nm (39, 40).
Liquid Chromatography)Mass Spectrometry (LC-MS). LC-MS
analyses were performed to quantify linoleic acid-OOHs using a Hewlett-Packard (Palo Alto, CA) HP1100 LC system connected with a Perkin-Elmer SCIEX (Concord, ON) API-165 single-quadrupole MS system equipped with an ion-spray source. Analyses were conducted in negative ion mode using selected ion monitoring of [M - H]
-ions. Separations were performed on a 50 × 2 mm i.d. column packed with 3 µM BDS-Hypersil C8 silica with 0.20 mL‚min-1of pH 2.4 mobile
phase comprising acetonitrile/water (75:25, v/v) with 2 mM ammonium formate and 50 mM formic acid.
Statistical Analysis.Data from the plant tissue experiment were subjected to analysis of variance with mean separation performed by the Fisher LSD method (41). Regression equations for the standard curves were determined with Sigma Plot version 5. Data expressed as means ( standard errors were calculated with SAS software (42).
RESULTS AND DISCUSSION
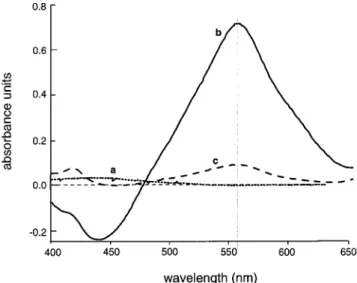
The spectrophotometric absorption profile indicates that the
spinach extracts treated with and without TPP have maximum
absorbances at 560 nm (Figure 2). Lipid hydroperoxides were
differentiated from interfering compounds by incubating some
of the samples with the -OOH reductant TPP for 30 min prior
to the addition of the FOX reagent, whereupon the LOOH
content is determined by the simple equation
[(Abs532+TBA-Abs600+TBA)
-(Abs532-TBA-Abs600-TBA)] ) A (1)
[(Abs440+TBA-Abs600+TBA) × 0.0571] ) B (2)
MDA equiv (nmol‚mL-1) ) (A - B/157000) × 106 (3)
Figure 2. Spectrophotometric scan from 400 to 650 nm of 200 µL of methanol (blank) (a), 100 µL of spinach extract aliquot and 100 µL of methanol (no TPP) (b), or 100 µL of spinach extract aliquot and 100 µL of 10.0 mM TPP (c). Following a 30-min incubation, 2000 µL of FOX reagent was added to samples a−c with the absorbances being measured 2.5 h later.
[-TPP] - [+TPP] )
[Abs560 LOOH + Abs560 interfering compounds]
-[Abs560 interfering compounds] ) Abs560 LOOH
Although the precise identification of the interfering compounds
is not known, phenolic (e.g., flavonoid) compounds likely
represented a large portion of these substances as they have
aborption maxima in the 500-600 nm range (43, 44). Hodges
et al. (34) demonstrated that anthocyanins and other compounds
strongly interfere with the assessment of the lipid peroxidation
product MDA as determined by the conventional TBARS assay.
In the present study, the contribution of non-LOOH absorbances
to the 560 nm signal is accounted for via the difference between
the -TPP and +TPP samples.
A potential contribution to the FOX assay in plant tissue
extracts is H
2O
2, as this molecule does not react with TPP and,
if present, may inflate the 560 nm signal. The possible H
2O
2interferences were eliminated in this study by treatment of
samples with catalase prior to reagent addition (data not shown).
Hence, incubation of samples with 500-1000 units of catalase
mL
-1for 15-30 min is highly recommended to test for the
presence of H
2O
2and, if necessary, to include catalase routinely
(35, 45).
Lipid-OOH content was quantified by calibration using H
2O
2for both the FOX and the iodometric assays. In animal and
artificial system applications, H
2O
2is often used as the reference
unit for LOOH measurements due to its high FOX reagent
reactivity and the ease and simplicity in establishing standard
curves from known stock concentrations (27, 32, 35, 46). A
calculated molar extinction coefficient (ǫ) for H
2O
2of 60342
M
-1cm
-1(data not shown) at 560 nm in FOX reagent is nearly
identical to the ǫ of 60000 M
-1cm
-1for linoleic acid-OOHs
reported by Gay et al. (45), indicating that H
2O
2is a suitable
standard against which LOOH concentrations in biological tissue
can be measured. In addition, the H
2O
2-generated stoichiometric
yield of 2.0-3.0 Fe
3+formed per -OOH reacted is similar
to more complex biological -OOHs than either cumene- or
tert-butyl-OOHs (45).
In the early development of this assay, maximal color
development consistently occurred during a 2.5-h incubation
period for pure chemical hydroperoxides species (e.g., H
2O
2,
cumene-OOHs, and linoleic acid-OOHs). When the LOOH
content of various plant extracts was being determined, the time
required for maximal color development was inconsistent for
different tissue, sometimes occurring between 120 and 180 min
and often requiring much longer time periods (data not shown).
Hence, the designation of a benchmark time period (e.g., 30
min; 31) for maximal color measurement is not reliable as this
plateau may occur hours after initial incubation of the sample
and reagents. In addition, the development of color in plant
tissue extracts is often curvilinear the longer the incubation
period, with the degree of curvilinearity being affected by the
endogenous tissue levels of polyunsaturated fatty acids (data
not shown). To circumvent these problems and to standardize
the method of determining LOOH concentration regardless of
tissue type and condition, the color development occurring
exactly 10 min following sample introduction into the FOX
reagent was recorded. During this 10-min period, the 560 nm
absorbance developed linearly in all systems tested.
An important assumption underlying the use of the FOX assay
is that separation of the lipid from the aqueous fraction is not
necessary as the methanolic-H
2SO
4FOX reagent denatures
lipoproteins sufficiently to allow interaction of Fe
2+ions with
LOOHs (27, 47). Intimated in this assumption is that the change
in polarity conferred by the formation of the LOOH group(s)
changes the fundamental hydrophobicity of the fatty acid,
resulting in an increased degree of hydrophilicity and thus
permitting chemical reactions within the methanol-based solvent.
To determine whether a separate lipid extraction is required for
the FOX method, the nonpolar and polar phases of spinach leaf
extracts were separated (37) and then each was assayed for
LOOHs with the modified FOX protocol. The results clearly
show that the 560 nm signal resides in the polar phase (Table
1); hence, a separate lipid extraction is not necessary if the intent
is to use the FOX assay as a general indicator of the presence
of LOOHs. The omission of a lipid extraction procedure is a
marked benefit as it not only reduces the time and labor involved
in sample processing but also reduces the degree of
time-dependent degradation of the metastable -OOHs. If the
experimental intent is to detect the presence of LOOHs in
purified lipid systems or among different classes of lipids, then
a lipid phase extraction would be required.
The presence of authentic linoleic acid-OOHs in avocado
and spinach samples was verified by LC-MS techniques, which
validated corresponding FOX results following the addition of
∼11 µM linoleic acid-OOHs to avocado and spinach samples
(Table 2). The similar difference values between the nonspiked
and spiked samples indicates good agreement between the two
methods for detection of the added linoleic acid-OOHs.
However, a small residual FOX signal of unknown origin was
present in the nonspiked samples (Table 2). The possibility that
excess, sample-derived Fe
3+caused the artifact was tested by
incubating nonspiked spinach extracts with 100 µL of the
reducing agent mercaptoethanol (10 mM), 100 µL of sample,
and 100 µL of TPP for 30 min followed by the addition of the
FOX reagent. The data indicated that ferric ions were not the
source of the residual signal as absorbances were identical to
the TPP-treated samples (data not shown). It may be that the
residual absorbance was caused by hydroperoxide species that
the LC-MS analysis did not detect as only linoleic acid-OOHs
were quantified, although TPP should have reduced all -OOH
groups present. Hence, an important objective for future work
with plant systems will be identification and elimination of all
potential non-OOH artifactual absorbances.
To determine if the FOX assay differentiates between
lipid-and protein-OOHs, BSA was autoxidized at room temperature
for ∼20 h. The data indicate that the FOX assay did not detect
protein-OOHs due to their absence or the inaccessibility of
the -OOH group to Fe
2+-induced reduction (Table 3). If -OOH
moieties formed on the BSA protein, it may be that they were
largely unavailable for reaction with Fe
2+due to the complex
secondary, tertiary, and quaternary structure of protein
mol-ecules, possibly compounded with the high concentration of
Table 1. H2O2Equivalents (Micromolar) in the Polar and Nonpolar Phases for LOOHs Derived via LOX and Autoxidationamode of oxidation phase LOX autoxidized
polar 45±3 29±4
nonpolar 0 0
aEach mean±standard error is based upon four replicate samples.
Table 2. H2O2Equivalent Values for Nonspiked and Spiked (+11 µM Linoleic Acid−OOH) Avocado and Spinach Samplesa
plant material protocol nonspiked (µM) spiked (µM) difference
avocado LC-MS 0 5.8 5.8
FOX 5.7 12.9 7.2
spinach LC-MS 0 7.7 7.7
FOX 7.4 12.5 5.1
aEach mean comprises four replicate observations.
BSA used. When autoxidized linoleic acid was added to a
similar BSA solution, an absorbance signal at 560 nm was
observed at the low and medium fatty acid concentrations,
indicating the presence of -OOHs. Interestingly, at the highest
concentration of BSA and fatty acid, no Abs560nm signal was
detectable (Table 3). Albumin has antioxidant properties (56),
can bind fatty acids (48), and can protect them from oxidation
by inhibiting -OOH formation (49). At the highest level of
BSA tested (∼44 µM), the data suggest that any -OOH groups
formed on the free fatty acids were either chemically altered or
bound by the BSA, resulting in no Fe
2+-induced reduction and
no subsequent binding of Fe
3+to xylenol orange (Table 3).
Recent work on protein-OOH detection has shown that
BSA-OOHs generated with
60CO irradiation are measurable via the
ferric-xylenol orange complex (45). However, the oxidizing
environment created with γ-radiation in that study would be
much more extreme than that induced in the present work by
moderate stirring of the BSA mixture for 20 h in the presence
of ambient O
2levels. Nonetheless, when protein concentrations
in the aqueous-base mixture were in the range commonly found
in plant tissue [micrograms to milligrams‚(g FW)
-1],
protein-OOHs were not detected with the FOX assay, whereas Lprotein-OOHs
were.
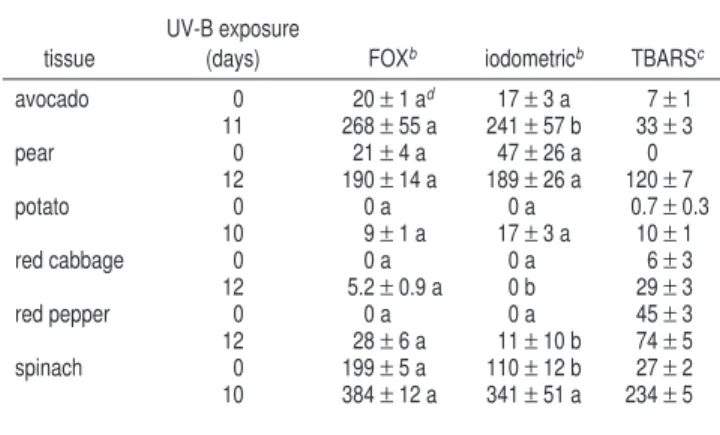
Following 10-12 days of UV-B
BEexposure, marked
in-creases in TBARS and LOOHs for all tissues were observed,
with the exception of the iodometric measurements of red
cabbage for the latter (Table 4). Past work demonstrates that
UV-B
BEradiation oxidizes membrane fatty acids directly or
indirectly in tissue as diverse as Arabidopsis thaliana LER (50),
cucumber (Cucumis satiVus L.) (51, 52), the marine
phytoplank-ton Tetraselmis sp. (53), several species of microalgae (54),
isolated thylakoid membranes (40), and some of the same plant
material used in this study (34). Recently, a less intense hormic
dose of germicidal UV-C on tomato (Lycopersicon esculentum
L.) fruit prior to storage caused a significant induction of
TBARS and other lipid peroxidation markers within the first 5
days of storage, suggesting that membranes are direct targets
of UV damage (55).
Comparison of the LOOH measurements by the FOX and
iodometric assays show that these methods generated fairly
similar readings at day 0 and following the UV exposure period
as judged by statistical nonsignificance or numeric closeness
of means (Table 4). In some cases, as with pear at day 0,
the LOOH averages for the two methods were 2-fold different
but were statistically similar due to the large variation in
the iodometric measurements. For avocado and red cabbage
tissue following the UV exposure, the LOOH means, although
statistically different, were considered similar from a practical
standpoint due to the relatively small numeric range between
them.
The plant extract LOOH values generated by the FOX assay
tended to be higher than those produced with the iodometric
method (Table 4); Nourooz-Zadeh et al. (32) reported similar
results when LOOHs in various vegetable oils were assayed,
with some of the FOX-derived averages being >5-fold higher
than those obtained with the iodometric assay. Gay et al.
(45) recently found that iodometric measurements of absolute
LOOH concentrations in human serum were not reliable as the
liberated iodine reacted with serum protein. This protein-iodine
reaction may explain why the iodometric means were often
numerically less than the FOX-derived values in the present
study (Table 4).
The iodometric assay did not indicate the presence of LOOHs
in plant extracts when the concentrations were below 11 µM
H
2O
2equiv, whereas the FOX assay measured concentrations
as low as 5 µM (Table 4). Nourooz-Zadeh et al. (32) also found
that lower -OOH levels in edible oils were not measurable with
the iodometric method as there appeared to be a certain -OOH
threshold below which the assay could not quantify. This lower
measurement limit may be due to or be exacerbated by the rapid
increase in the signal once the sample is introduced into the
reagent, the high mobile baselines, the high O
2sensitivity, and
the high intra-assay sample variation (32). The smaller standard
errors associated with the FOX assay in the present work
indicate that the FOX method is more reproducible than the
iodometric assay, generating less sample-to-sample variation in
plant extracts (Table 4).
For plant tissue extracts, the FOX assay is valuable as a
relative measure of incipient lipid peroxidation. At this point,
the assay does not distinguish between different types of LOOH
molecules and is therefore a general indicator of the presence
of LOOH. Nonetheless, the assay is relatively simple, requires
inexpensive chemicals, produces results rapidly, is not sensitive
to ambient O
2or light levels, and does not require heating or
special reaction conditions, and the lipid components do not
need to be separated from the rest of the cellular homogenate.
To distinguish LOOHs from the contribution of pigments and
other compounds to the 560 nm signal, it is necessary that some
samples are treated with TPP. Modifications to the FOX assay
Table 3. Absorbance at 560 nm for (i) BSA Protein, (ii) BSA andTween-20, and (iii) BSA, Tween-20, and Linoleic Acid Solutionsa
treatment BSAb (mg mL-1) linoleic acidc (µg mL-1) Abs560 (−TPP− +TPP) BSA 0.08 0 0 0.32 0 0 3.0 0 0 BSA+Tween-20 0.08 0 0 0.32 0 0 3.0 0 0 BSA+Tween-20+ 0.08 3.38 0.090 linoleic acid 0.32 13.5 0.17±0.02 3.0 124 0
aEach Abs560 value is a mean±standard error of three observations.bBSA
concentrations: 0.08 mg mL-1) ∼1.2 µM, 0.32 mg mL-1) ∼4.7 µM, and 3.0
mg mL-1) ∼44 µM.cLinoleic acid concentrations: 3.38 µg mL-1)12.1 µM, 13.5 µg mL-1)48.2 µM, and 124 µg mL-1)444 µM.
Table 4. LOOHs and TBARS in Various Plant Tissues Prior to and Following 10−12 Days of Continuous UV-BBEExposurea
tissue
UV-B exposure
(days) FOXb iodometricb TBARSc
avocado 0 20±1 ad 17±3 a 7±1 11 268±55 a 241±57 b 33±3 pear 0 21±4 a 47±26 a 0 12 190±14 a 189±26 a 120±7 potato 0 0 a 0 a 0.7±0.3 10 9±1 a 17±3 a 10±1 red cabbage 0 0 a 0 a 6±3 12 5.2±0.9 a 0 b 29±3 red pepper 0 0 a 0 a 45±3 12 28±6 a 11±10 b 74±5 spinach 0 199±5 a 110±12 b 27±2 10 384±12 a 341±51 a 234±5
aEach value is a mean of four sample replicate measurements±standard
error. Tissues were exposed to a continuous daily UV-BBEirradiance of ∼83 kJ
m-2.bFOX and iodometric assay units: µM H
2O2equiv (g FW)-1mL-1.cTBARS
assay units: nmol MDA equiv (g FW)-1mL-1.dFOX and iodometric assay means
for the same UV-B exposure day having different letters are significantly different at the 5% R level.
originating from this work include the sample preparation
protocol and quantifying LOOH concentrations in samples
during the linear phase of color development, i.e., exactly 10
min following reagent introduction into the sample. The value
of the FOX assay from a physiological perspective lies in its
ability to detect initial rather than more advanced fatty acid
oxidation; hence, early membrane-associated stress events can
be detected. Studies are presently being pursued to more
precisely identify the nature of the LOOHs responsible for
generating the FOX assay signal in plant extracts.
ACKNOWLEDGMENT
We gratefully acknowledge the contributions of Dr. Kenneth
L. Steffen and Mark Johnson to this work. We also thank
Barbara Daniels-Lake and Sonia Gaul for their review of the
manuscript and Bill Hardstaff for technical assistance with the
LC-MS procedure.
LITERATURE CITED
(1) Anderson, H. W. Lipid Peroxidation and Plant Tissue Disorders: Introduction to the Workshop. HortScience 1995, 30, 196-197. (2) Gardner, H. W. Biological Roles and Biochemistry of the
Lipoxygenase Pathway. HortScience 1995, 30, 197-205. (3) Shewfelt, R. L.; Purvis, A. C. Toward a Comprehensive Model
for Lipid Peroxidation in Plant Tissue Disorders. HortScience
1995, 30, 213-218.
(4) Gallego, S. M.; Benavides, M. P.; Tomaro, M. L. Effect of Heavy Metal Ion Excess on Sunflower Leaves: Evidence for Involvement of Oxidative Stress. Plant Sci. 1996, 121, 151-159.
(5) Paliyath, G.; Droillard, M. J. The Mechanisms of Membrane Deterioration and Disassembly During Senescence. Plant Physiol. Biochem. 1992, 30, 789-812.
(6) Hodges, D. M.; Forney, C. F. The Effects of Ethylene, Depressed Oxygen and Elevated Carbon Dioxide on the Antioxidant Pro-files of Senescing Spinach Leaves. J. Exp. Bot. 2000, 51, 645-655.
(7) Witztum, J. L. The Oxidation Hypothesis of Atherosclerosis. Lancet 1994, 344, 793-795.
(8) Kinsella, J. E.; Lokesh, B.; Stone, R. Dietary n-3 Polyunsaturated Fatty Acids and Amelioration of Cardiovascular Disease: Pos-sible Mechanisms. Am. J. Clin. Nutr. 1990, 52, 1-28. (9) Ames, B. Dietary Carcinogens and Anticarcinogens. Science
1983, 221, 1256-1264.
(10) Caragay, A. B. Cancer-Preventive Foods and Ingredients. Food Technol. 1997, 46, 65-68.
(11) Gambhir, J. K.; Lali, P.; Jain, A. K. Correlation Between Blood Antioxidant Levels and Lipid Peroxidation in Rheumatiod Arthritis. Clin. Biochem. 1997, 30, 351-355.
(12) Sampson, A. P. The Leukotrienes: Mediators of Chronic Inflammation in Asthma. Clin. Exp. Allergy 1996, 26, 995-1004.
(13) Halliwell, B.; Gutteridge, J. M. C. Role of Free Radicals and Catalytic Metal Ions in Human Disease: an Overview. Methods Enzymol. 1990, 186, 1-85.
(14) Janero, D. R. Malondialdehyde and Thiobarbituric Acid-Reactiv-ity as Diagnostic Indices of Lipid Peroxidation and Peroxidative Tissue Injury. Free Radical Biol. Med. 1990, 9, 515-540. (15) Elstner, E. F.; Osswald, W. Mechanisms of Oxygen Activation
During Plant Stress. Proc. R. Soc. Edinburgh, Sect. B: Biol. Sci. 1994, 102B, 131-154.
(16) Antunes, F.; Salvador, A.; Marinho, H. S.; Alves, R.; Pinto, R. E. Lipid Peroxidation in Mitochondrial Inner Membranes. I. An Integrative Model. Free Radical Biol. Med. 1996, 21, 917-943.
(17) Girotti, A. Lipid Hydroperoxide Generation, Turnover, and Effector Action in Biological Systems. J. Lipid Res. 1998, 39, 1529-1542.
(18) Gumpricht, E. Characterization of Glutathione-Dependent Pro-tection Against Membrane Peroxidative Damage in Sheep Liver: an Examination of the Role of Microsomal Glutathione S-Transferases. Ph.D. Dissertation, College of Health and Human Development, The Pennsylvania State University, 1995. (19) Nakamura, T.; Maeda, H. A Simple Assay for Lipid
Hydro-peroxides Based on Triphenylphosphine Oxidation and High-Performance Liquid Chromatography. Lipids 1991, 26, 765-768.
(20) Turnipseed, S. B.; Allentoff, A. J.; Thompson, J. A. Analysis of Trimethylsilylperoxy Derivatives of Thermally Labile Hydro-peroxides by Gas Chromatography-Mass Spectrometry. Anal. Biochem. 1993, 213, 218-225.
(21) Spickett, C. M.; Pitt, A. R.; Brown, A. J. Direct Observation of Lipid Hydroperoxides in Phospholipid Vesicles by Electrospray Mass Spectrometry. Free Radical Biol. Med. 1998, 25, 613-620.
(22) Hicks, M.; Gebecki, J. M. A Spectrophotometric Method for the Determination of Lipid Hydroperoxides. Anal. Biochem.
1979, 99, 249-253.
(23) Frei, B.; Yamamoto, Y.; Niclas, D.; Ames, B. N. Evaluation of an Isoluminol Chemiluminescence Assay for the Detection of Hydroperoxides in Human Blood Plasma. Anal. Biochem. 1998, 175, 120-130.
(24) Marshall, P. J.; Warso, M. A.; Lands, W. E. M. Selective Microdetermination of Lipid Hydroperoxides. Anal. Biochem.
1985, 145, 192-199.
(25) Yamamoto, Y.; Frei, B.; Ames, B. N. Assay of Lipid Hydro-peroxides Using High-Performance Liquid Chromatography with Isoluminol Chemiluminescence Detection. Methods Enzymol.
1990, 186, 371-380.
(26) Jiang, Z.-Y.; Hunt, J. V.; Wolff, S. P. Ferrous Ion Oxidation in the Presence of Xylenol Orange for Detection of Lipid Hydro-peroxide in Low-Density Lipoprotein. Anal. Biochem. 1992, 202, 384-389.
(27) Nourooz-Zadeh, J.; Tajaddini-Sarmadi, J.; Wolff, S. P. Measure-ment of Plasma Hydroperoxide Concentrations by the Ferrous Oxidation-Xylenol Orange Assay in Conjunction with Triphenyl-phosphine. Anal. Biochem. 1994, 220, 403-409.
(28) Wolff, S. P. Ferrous Ion Oxidation in Presence of Ferric Ion Indicator Xylenol Orange for Measurement of Hydroperoxides. Methods Enzymol. 1994, 223, 182-189.
(29) Hermes-Lima, M.; Willmore, W. G.; Storey, K. B. Quantification of Lipid Peroxidation in Tissue Extracts Based on Fe(II) Xylenol Orange Complex Formation. Free Radical Biol. Med. 1995, 19, 271-280.
(30) Grau, A.; Codony, R.; Rafecas, M.; Barroeta, A. C.; Guardiola, F. Lipid Hydroperoxide Determination in Dark Chicken Meat Through a Ferrous Oxidation-Xylenol Orange Method. J. Agric. Food Chem. 2000, 48, 4136-4143.
(31) Griffiths, G.; Leverentz, M.; Silkowski, H.; Gill, N.; Sanchez-Serrano, J. Lipid Hydroperoxide Levels in Plant Tissue. J. Exp. Bot. 2000, 51, 1363-1370.
(32) Nourooz-Zadeh, J.; Tajaddini-Sarmadi, J.; Birlouez-Aragon, I.; Wolff, S. P. Measurement of Hydroperoxides in Edible Oils Using the Ferrous Oxidation in Xylenol Orange Assay. J. Agric. Food Chem. 1995, 43, 17-21.
(33) Burat, M.; Bozkurt, O. Improvement of Calibration Curve for Determining Peroxide Values of Food Lipids by the Modified Ferrous Oxidation-Xylenol Orange Method. J. AOAC Int. 1996, 79, 995-997.
(34) Hodges, D. M.; DeLong, J. M.; Forney, C. F.; Prange, R. K. Improving the Thiobarbituric Acid-Reactive-Substances Assay for Lipid Peroxidation in Plant Tissues Containing Anthocyanin and Other Interfering Compounds. Planta 1999, 207, 604-611. (35) Jiang, Z.-Y.; Hunt, J. V.; Wolff, S. P. Ferrous Ion Oxidation in the Presence of Xylenol Orange for Detection of Lipid Hydro-peroxide in Low-Density Lipoprotein. Anal. Biochem. 1992, 202, 384-389.
(36) Pryor, W. A.; Castle, L. A. Chemical Methods for Detection of Lipid Hydroperoxides. Methods Enzymol. 1984, 105, 293-299.
(37) Burton, G. W.; Webb, A.; Ingold, K. U. A Mild, Rapid, and Efficient Method for Lipid Extraction for Use in Determining Vitamin E/Lipid Ratios. Lipids 1985, 20, 29-39.
(38) Hamberg, M.; Samuelsson, B. On the Specificity of the Oxygenation of Unsaturated Fatty Acids Catalyzed by Soybean Lipoxidase. J. Biol. Chem. 1967, 242, 5329-5335.
(39) Caldwell, M. Solar Radiation as an Ecological Factor for Alpine Plants. Ecol. Monogr. 1968, 38, 243-268.
(40) DeLong, J. M.; Steffen, K. L. Lipid Peroxidation and R-Tocopherol Content in R-R-Tocopherol Supplemented Thylakoid Membranes During UV-B Exposure. EnViron. Exp. Bot. 1998, 39, 177-185.
(41) SAS Institute. SAS/STAT User’s Guide, version 6, 4th ed.; Cary, NC, 1990; Vol. 1.
(42) SAS Institute. SAS Procedure’s Guide, version 6, 3rd ed.; Cary, NC, 1990; Vol. 1.
(43) Hayashi, K. The Anthocyanins. In The Chemistry of FlaVonoid Compounds; Geismann, T. A., Ed.; Pergamon Press: London, U.K., 1962; pp 248-285.
(44) Hodges, D. M.; Nozzolillo, C. Anthocyanin and Anthocyanoplast Content of Cruciferous Seedlings Subjected to Mineral Nutrient Deficiencies. J. Plant Physiol. 1996, 147, 749-754.
(45) Gay, C.; Collins, J.; Gebicki, J. M. Hydroperoxide Assay with the Ferric-Xylenol Orange Complex. Anal. Biochem. 1999, 273, 149-155.
(46) So¨dergren, E.; Nourooz-Zadeh, J.; Berglund, L.; Vessby, B. Re-evaluation of the Ferrous Oxidation in Xylenol Orange Assay for the Measurements of Plasma Lipid Hydroperoxides. J. Biochem. Biophys. Methods 1998, 37, 137-146.
(47) Nourooz-Zadeh, J. Ferrous Ion Oxidation in Presence of Xylenol Orange for Detection of Lipid Hydroperoxides in Plasma. Methods Enzymol. 1999, 300, 58-62.
(48) Bojesen, E.; Bojesen, I. N. Albumin Binding of Long-Chain Fatty Acids: Thermodynamics and Kinetics. J. Phys. Chem. 1996, 100, 17981-17985.
(49) Neuzil, J.; Stocker, R. Free and Albumin-Bound Bilirubin are Efficient Co-Antioxidants for R-Tocopherol, Inhibiting Plasma
and Low-Density Lipoprotein Lipid Peroxidation. J. Biol. Chem.
1994, 269, 16712-16719.
(50) Landry, L. G.; Chapple, C. C. S.; Last, R. L. Arabidopsis Mutants Lacking Phenolic Sunscreens Exhibit Enhanced Ultraviolet-B Injury and Oxidative Damage. Plant Physiol. 1995, 109, 1159-1166.
(51) Kramer, G. F.; Norman, H. A.; Krizek, D. T.; Mirecki, R. M. Influence of UV-B Radiation on Polyamines, Lipid Peroxidation and Membrane Lipids in Cucumber. Phytochemistry 1991, 30, 2101-2108.
(52) Takeuchi, Y.; Fukumoto, R.; Kasahara, H.; Sakaki, T.; Kitao, M. Peroxidation of Lipids and Growth Inhibition Induced by UV-B Irradiation. Plant Cell Rep. 1995, 14, 566-570. (53) Goes, J. I.; Handa, N.; Taguchi, N.; Hama, T. Effect of
UV-B Radiation on the Fatty Acid Composition of the Marine Phytoplankter Tetraselmis sp.: Relationship to Cellular Pigments. Mar. Ecol. Prog. Ser. 1994, 114, 259-274.
(54) Wang, K. S.; Chai, T.-J. Reduction in Omega-3 Fatty Acids by UV-B Irradiation in Microalgae. J. Appl. Phycol. 1994, 6, 415-421.
(55) Barka, E. A.; Kalantari, A.; Makhlouf, J.; Arul, J. Effects of UV-C on Lipid Peroxidation Markers During Ripening of Tomato (Lycoperiscon esculentum L.) Fruits. Aust. J. Plant Physiol. 2000, 27, 147-152.
(56) Halliwell, B. Albuminsan Important Extracellular Antioxidant? Biochem. Pharmacol. 1988, 37, 569-571.
(57) Griffiths, G.; Leverentz, M.; Silkowski, H.; Gill, N.; Sanchez-Serrano, J. J. Lipid Hydroperoxides in Plants. Biochem. Soc. Trans. 2000, 28, 837-839.
Received for review May 21, 2001. Revised manuscript received September 19, 2001. Accepted September 20, 2001. Atlantic Food and Horticulture Research Centre Contribution 2220.